

 PDF
PDF ePub
ePub Citation
 Print
Print


Introduction
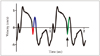
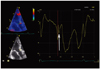
The tissue Doppler imaging (TDI) derived pattern of the left ventricular (LV) longitudinal motion is characterized by a distinct velocity pattern during the time interval between the end of the systolic velocity wave and the onset of the early diastolic velocity wave. Negative and positive velocity waves are commonly distinguished.1)2)3) The origin of these longitudinal myocardial velocities has not been fully resolved. We suggest considering the nadir of the negative velocity wave as being the onset of a notch leading to an interruption of the ongoing basally directed velocity of the myocardium. We have labeled this phenomenon as the post-systolic velocity notch (PSN) (Fig. 1). Remme et al.4) demonstrated that the presence of the aortic valve is necessary for a PSN to occur. Stenting of the aortic valve led to the disappearance of the PSN in an animal model. The downstroke of the velocity curve between the end of the systolic wave and the onset of the PSN represented the protodiastolic myocardial lengthening. However, the exact origin of the upstroke of the PSN, which frequently reaches positive values, was not clarified.
For the current study, it was hypothesized that the energy released at the instant of the sudden cessation of the closing motion of the aortic valve is responsible for the upstroke of the PSN. In order to evaluate this assumption the timing of the onset, the amplitude and the duration of the PSN were measured at different cardiac segments along the longitudinal axis in healthy subjects.
Methods
Study subjects
Patients referred for a standard transthoracic echocardiogram were included in the study if they met the following inclusion criteria: no history of known cardiovascular disease, no abnormalities on physical examination, electrocardiogram and echocardiogram.
Ultrasound acquisition
For the purpose of the study, color TDI images of the apical longitudinal axis of the left ventricle were obtained. The width of the echocardiographic window was adjusted to achieve a frame rate of at least 165 frames per second. Three consecutive cardiac cycles at the end of expiration were acquired. The echocardiographic equipment used was the VIVID 7 and S6 (GE Vingmed Ultrasound AS, Horten, Norway).
Off-line analysis
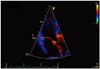
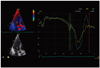
The off-line reconstructions of the TDI velocity curves using the recorded raw data was performed with commercially available software (EchoPac, version 110.0.2, GE Vingmed Ultrasound AS, Horten, Norway). The standardized measurements were performed at the following levels: the anterior aortic annulus (AA), the posterior aortic wall (AW) below the sino-tubular junction, the mid anteroseptal wall (MAS) and the posterior mitral annulus (MA) (Fig. 2). Temporal averaging (curve smoothing) of the measurement results was not applied. The time delay of the PSN onset (Fig. 3) was assessed between the AA and the AW, the AA and the MAS, the AA and the MA. In addition, the following values were determined at each measurement level: the velocity at the onset of the PSN, the velocity at the peak of the PSN and the duration of the PSN (onset to peak). The amplitude of the PSN was calculated (peak velocity minus onset velocity).
Statistics
Timing, velocity and duration data are presented as mean ± standard deviation. The one-sample t-test was used to test the hypothesis of the later onset of the PSN at the AW, the MAS, and the MA relatively to the AA. The onset timing, the velocity and the duration were compared using the paired t-test. p < 0.05 was considered statistically significant.
Results
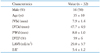
Thirty two persons were included in the study. The mean age was 35 ± 10 years and 16 were male. The basic demographic and echocardiographic parameters are shown in Table 1. The mean frame rate of the color TDI acquisition was 170 ± 6 frames per second.
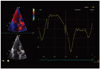
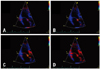
The PSN was present at the AA, the AW, the MAS, and the MA of all studied subjects (Fig. 4).
Timing of the onset
Compared to the AA, the time delays of the PSN onset at the AW, the MAS, and the MA were found to be significantly longer than zero (5.1 ± 2.2 ms, 6.0 ± 2.3 ms, 6.8 ± 2.8 ms; p < 0.001). This implies that the PSN onset occurs at the level of the AA before the PSN onset at any other measurement level. The onset of the PSN at the level of the MA occurred significantly later than at the level of the AW (p < 0.005).
Amplitude and duration
The amplitude of the PSN was the highest at the level of the AA compared with the AW, the MAS, and the MA. There was no significant difference in the duration of the PSN between the measurement levels (Table 2).
The onset and the peak velocities
The onset velocities of the PSN were significantly more negative (p < 0.001) and the peak velocities significantly higher (p < 0.001) at the AA than at all other measurement levels (Table 2).
The onset of the PSN had a negative velocity in all the subjects at all measurement levels. The peak of the PSN showed a positive value in 90.6% of the subjects at the level of the AA. At the other studied levels it reached the positive values less frequently (AW 68.8%, MAS 56.3%, MA 59.4%).
Additional findings
In 10 of 32 (31%) studied subjects, the second PSN spike was identifiable at the AA level (Fig. 5). Of these, 9 (28%) exhibited a second PSN spike at the AW, 3 (9%) at the MAS and no one at the MA.
Discussion
A distinct PSN pattern could be distinguished in the TDI derived curves of all studied subjects. It was demonstrated that the PSN is the earliest and the largest at the level of the AA when compared to other sites along the apical longitudinal axis. We suggest that the sudden cessation of the closing motion of the aortic valve at the onset of the PSN is associated with release of kinetic energy responsible for the abrupt change of direction of the myocardial acceleration, leading to an upstroke of the velocity curve. Our findings form a circumstantial though significant plea to allocate the moment of the aortic valve closure to the PSN onset at the level of the AA. According to our hypothesis the resulting PSN wave propagates as well in proximal (compression wave) as in distal (rarefaction wave) direction. The decrease of the amplitude of the PSN at the remote segments relative to the AA fits this hypothesis. The significantly longer delay of the PSN onset at the MA as compared with the AW is, probably, explained by the longer distance for the PSN wave to travel from its origin and different velocities of the PSN wave while travelling through myocardium versus AW. Our findings seem to further develop the hypothesis of Remme et al.4) strongly suggesting that the impact of the closing aortic valve and not merely the interruption of the protodiastolic myocardial lengthening at the instant of the cessation of its closing motion accounts for the upstroke of the PSN. The existence of the pulsatile wave propagating from the base of interventricular septum to the apex was previously shown by a phased tracking method.5) The wave starts with a steep pulse near the base of interventricular septum just at the instant of the closure of the aortic valve and propagates with a speed about 5-6 m/s. The rough approximation of the propagation velocity in our study yields the comparable value (3 cm in 6 ms = 5 m/s).
In the case of a sufficiently strong impact, the upstroke of the PSN can reach positive values, called a post-systolic motion.6)7)8)9)10)11)12) We propose this simple mechanism to explain the biphasic configuration of the post-ejection velocity spike. Previous research had suggested it to be a resultant of different phenomena such as: asynchronous contraction and ventricular interdependence,13) asynchronous deformation of subendocardial and subepicardial LV wall layers14) and tug-of-war between weak and strong segments during the isovolumic relaxation phase.15) The prevalence of the positive PSN velocities found in the current study is somewhat higher than previously reported,3) probable because no temporal averaging of the measurement results was applied. The centrifugal propagation of the positive PSN velocity front is illustrated by a frame-by-frame analysis of a color TDI sample (Fig. 6).
To the best of our knowledge the present study describes for the first time the existence of two PSN spikes with apically directed acceleration. This was possible due to use of the high frame rate and non-smoothed measurement results. While the origin of the first PSN spike is as discussed above, probably, the closure of the aortic valve, the genesis of the second PSN spike is less clear. We hypothesize that the sudden cessation of the aortic backflow at the instant of the aortic valve closure16) is a potential mechanism behind the second PSN spike. The transmission of the kinetic energy could be sufficient to cause an acceleration of adjacent structures in the direction of the left ventricle.17) The magnitude of the retrograde flow in the ascending aorta is known to vary significantly between the healthy subjects and constitutes 4-29% of the antegrade aortic flow. At an average of 600-700 mL/min retrograde flow the coronary circulation takes 200-300 mL/min, the remainder turns around in the sinuses of Valsalva.18) The maximal velocity of the retrograde flow in the ascending aorta is in the range of 8-40 cm/s in healthy subjects.19) These differences in velocity and volume of the retrograde aortic flow are likely to cause a wide spectrum of velocity and duration of the second PSN spike. Further studies are needed to elucidate its nature and clinical significance.
Limitations
The apical longitudinal axis view is hampered by suboptimal alignment of the Doppler interrogation with longitudinal motion of the ascending aorta which varies with the magnitude of the aorto-septal angle. However, it is unlikely that possible malalignment influenced the timing intervals measured in this study.
Potential study implications
The issue of the timing of the aortic valve closure relatively to the LV longitudinal velocity tracing seems not definitely to be resolved due the limitations of the reference methods used for the timing of the aortic valve closure.20) Different points on the velocity curve have been suggested to coincide with the instant of the aortic valve closure: the time point of zero velocity at the end of the systolic wave,21)22) the time point of peak positive acceleration during isovolumic relaxation period,4)23) the time point of zero velocity at the end of the negative spike after the systolic wave.20)24) Based on our results the PSN onset at the level of the AA can be used as a marker of end-systole on the TDI tracings when using the apical longitudinal axis view. The PSN onset at the level of any segment in the standard four- and two-chamber view is expected to be delayed relatively to the instant of the aortic valve closure and represent the arrival of the PSN velocity front to the studying segment.
Conclusion
The concept of the PSN was presented. This distinct velocity pattern interrupts the longitudinal basally directed LV motion during the ongoing protodiastolic relaxation. The relative timing and amplitude reveal its origin to be at the level of the AA. A second PSN spike is present in a substantial amount of healthy subjects predominantly at the AA level. We suggest the first and the second PSN spike to be caused, respectively, by the myocardial propagation of kinetic energy of the closing aortic valve and retrograde aortic flow which is interrupted at the instant of the aortic valve closure.

 XML Download