

 PDF
PDF ePub
ePub Citation
 Print
Print


Introduction
General performance parameters of the left ventricle (LV), such as the ejection fraction, cannot differentiate the local changes caused by different physiological conditions. Local study of the left ventricular performance was carried out by quantification of the myocardium trajectory, using the parameters of strain, strain rate and stress.1) The helix structure of the myofibers of myocardium and the change of these myofibers' angle along the wall thickness, lead to torsional motion of the ventricle (apex rotational motion in the opposite direction of the base).2)3) According to the Torrent-Gausp model,4) the left ventricular tissue consists of two descending (clockwise) and ascending (counter-clockwise) branches which form the base section at first, then descend spirally, and ascend to the aorta. In addition to the uniform distribution of stress and shortening along the fibers, torsion also plays a major role in the ejection fraction of the heart. So with a shortening of myofibers of about only 15-20%, the heart's ejection fraction is estimated at 50-60%.5)6) Any torsional disorders increase the stress and strain in the inner layer, hence increasing the demand for oxygen, and ultimately decreasing the systolic performance of the LV.7)8) Thus, the potential characteristic of measuring LV torsion may bean early diagnosis of myocardial damage.8)9)
The quantification of such motion has been done using the angle of rotation, torsion angle and circumferential-longitudinal shear angle10) with invasive implantation of tantalum markers and X-ray imaging,10) and non-invasive techniques such as magnetic resonance imaging (MRI) and echocardiography.11)12) The measurement of torsion in echocardiography images was initially done using the tissue Doppler technique.13) The latest technique for the measurement of the torsion angle is using the block matching algorithm to track sequential echocardiography images,14)15) which does not have the problems associated with the tissue Doppler technique. Despite the 3-dimensional motion of the myocardium, this angle has so far been estimated in echocardiography images by eliminating the longitudinal motion in 2-dimensional short-axis view images,11)14)15) and by eliminating the circumferential motion in 2-dimensional longitudinal view images.16) Despite many studies about the left ventricular angle of rotation on a two-dimensional scale, there are as yet, no studies about the introduction and extraction of the torsion angle of myocardial levels on a 3-dimensional scale.
Thus in the current study, 2-dimensional echocardiography images are first synchronized for two short-axis and longitudinal-axis views, using the view's electrocardiogram (ECG) signals. The sequential echocardiography images are then processed, using the block matching algorithm. Coordination of the interventricular septum trajectory will be estimated at the three levels of base, mid and apex. Since the quality of images is very important for the accuracy of tracking, the highest quality images of the base, mid and apex levels of the septal wall are used. After extracting the 3-dimensional trajectory, the angle of the left ventricular 3-dimensional trajectory will be estimated, considering 3-dimensional trajectory vectors. The correlation between the 3-dimensional angle of trajectory in the base, mid and apex levels of the interventricularseptal wall, and extracted rotation angles from both the short-axis and longitudinal axis views, will be analyzed and assessed.
Methods
Subjects
Nineteen adult males (46 ± 6 years old), who based on echocardiography examinations, had a healthy heart, volunteered to participate in this study. Based on Framingham study indices,17) including a person's gender, age, blood pressure, smoking, blood cholesterol levels, having diabetes and hypertrophy, the risk of developing coronary artery disease in the volunteered participants was less than 10%. Each healthy individual underwent normal physical examinations, including blood pressure measurements, echocardiographic general parameters studies, and recording of ECG signals, at the same time as echocardiography imaging. The volunteered individuals had no history of cardiovascular diseases, angina, high blood pressure, or diabetes, and were not taking any medication. Before echocardiography imaging, the blood pressure of the individuals was measured in the supine position, using a Microfile_BP 3BU (Microfile, Heerbrugg, Switzerland) calibrated oscillometric sphygmomanometer with a blocking cuff (± 1 mmHg, 30-280 mmHg). General performance parameters of the heart, including linear measurements of ventricular dimensions and the left atrium of heart, were then extracted in longitudinal parasternal and apical four-chambers views, using M-mode and B-mode ultrasound imaging techniques. The ventricular diastolic performance was also extracted, using blood flow parameters of the mitral valve, with spectral Doppler imaging technique. Before the test, informed participation consent was received from all the volunteers. This protocol was approved by the medical ethics committee of Tarbiat Modares University.
Imaging and extracting the myocardial muscle movement stage
After a general examination of the subjects, tissue harmonic imaging (transmitted frequency of 1.7 MHz and received frequency of 3.4 MHz) was done using an echocardiography system (Philips iE33 xMATRIX, Best, Netherlands) with electronic ultrasonic transducer (S5-1), and 75-95 frames per second in Digital Imaging and Communications in Medicine format, a spatial resolution of 0.26 ± 0.01 mm, and a maximum depth of study of 12 to 16 cm. Echocardiography images were recorded from the longitudinal four chambers and short-axis views at the three apex, mid and base levels according to the standards of the American Heart Association (AHA).18) To remove artifacts caused by movement of the diaphragm, the volunteers were asked to hold their breath during the recording of three cardiac cycles of echocardiography images. After transferring the sequential echocardiography images to the computer, with a minimum temporal resolution of 14 ms, the mid-ventricular septal wall was tracked based on the AHA sixteen segments standard model,18) using the block matching algorithm, in three cardiac cycles at the three base, mid and apex levels, and the average of these three measurements, with an error of less than 10%, was considered as the output. Low quality images that had artifacts, due to the movement of diaphragm or the subjects during the imaging process, were removed from the study.
In the block matching algorithm, after reading images of a cardiac cycle as the input, the region of interest (ROI) in the source images was then selected by the user. Considering the size of the ROI and its location in the source image, the search area was defined in dimensions twice as large as the area of the ROI, centered on the location of the ROI in the target image. In the next stage, the sum of absolute difference (SAD) quantity between the ROI, and all blocks with the same size was calculated in the search area. The location of the block with the minimum SAD was selected as the location of the ROI in the target image.19)20)
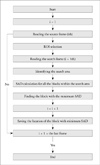
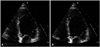
According to the flowchart shown in Fig. 1, the ROI is selected by the user in the first frame, and the block corresponding to the minimum SAD is found in the second frame (Fig. 2). In order to select the corresponding block in the third frame, a block that has the minimum SAD, compared to the block that was found in the second frame, would be selected and so forth.
After the execution of the block matching algorithm, considering the geometric model of the heart as an truncated ellipsoid (Fig. 3A),2) and the geometry of the taken views, the coordinates (Ximage, Yimage) (Fig. 3B) and (⊥Zimage, Zimage) (Fig. 3C) were achieved, relative to the image coordinate system.The reference coordinate system was considered as shown in Fig. 3 by selecting the center of the mid-level of the LV as the origin of the coordinates and choosing the orientation of its axes. The center of ventricle (X0, Y0) (Fig. 3B) was identified in short-axis view on coordinates of the image using Fiji software (http://fiji.sc) (the image processing software package for bioscience researchers), by fit of circular or oval shapes on segments of the LV anatomical images. The origin of coordinates (⊥Z0, Z0) (Fig. 3C) was identified in longitudinal axis view, using the anatomical papillary muscle marker. At the end of this stage, the coordinates of the myocardium's septum were transferred, from the coordinates system defined in the image, to the reference coordinate system (equations 1-4).
Synchronization of the LV views in both longitudinal and lateral axes
Longitudinal and short-axis views were imaged with a 2-3 min delay from the heart of each individual. Due to the changes of heart rate during successive cycles of the heart and unequal frame rates in both views in this study, combining the images in short-axis view with the ones taken in longitudinal axis view needed examinination of the synchronization of the short- and long-axis views data using the ECG signal. Therefore, the ECG signal was extracted from the echocardiography images using this signal in such images and color images processing. In order to extract this signal, the change in coordinates of the last colored pixel of the ECG signal in the images of a cardiac cycle was used. To obtain the coordinates of this pixel, all the images of a cycle were first limited to the range of the ECG signal and after separating the color channels of the images, the image of the channel with highest intensity was selected (here G). Coordinates of the last pixel were recorded using the number 1 in all the images, after the conversion of the main channel images to binary data. The ECG signal was reconstructed by transferring these values to the Excel software. Signals recorded in long and short-axis views were compared visually after the extraction of the ECG signal in both these views of echocardiography images. The differences were observed in at the end of the diastolic phase for most of the images. In images where such differences were high, the repeated frames in different phases of the cardiac cycle were removed due to inequality in the size of such differences for different phases of ECG signal in order to synchronize the data. The output data in this stage were used to calculate the short-axis, long-axis angles and angle of 3-dimensional trajectory.
Calculating angles
Considering the defined system of coordinates,  = (a⊥z, az) and
  = (b⊥z, bz) are position vectors in long-axis view. Thus, the rotation angle in long-axis view [χ(t)] is obtained from equation 5:
= (a⊥z, az) and = (b⊥z, bz) are position vectors in long-axis view. Thus, the rotation angle in long-axis view [χ(t)] is obtained from equation 5:
 = (ax, ay) and = (bx, by) are position vectors in short-axis view. Thus, the rotation angle in short-axis view [θ(t)] is obtained from equation 6:
 = (ax, ay, az) and = (bx, by, bz) are position vectors in short-axis view. Thus, the 3-dimensional angle of trajectory [Φ(t)] is obtained from equation 7:

The average of angle changes for three cardiac cycles was then extracted as the output of this stage. In order to perform statistical comparison of the results, the maximum angle of 3-dimensional trajectory (ΦM), and maximum angles of rotation in short-axis (θM) and long-axis (χM) were reported as the average ± standard deviation. Pearson's analysis of correlation with a significance level of less than 0.05 was used to study the correlation between θM, χM and ΦM. The sample size was estimated with a confidence level of 95% and power of test of 90% in each group. The statistical analysis was done using SPSS 16 software (SPSS Inc., Chicago, IL, USA).
Results
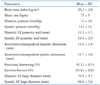
The demographic and echocardiographic measures of 19 men with an average age of 46 ± 5 years are given Table 1. The general parameters extracted from Table 1 shows the healthiness of heart in individuals of this study.
Recorded ECG signals in the short and long axis views images were visually compared for each individual, during three cardiac cycles. Due to the non-synchronization of three cardiac cycles in two recorded views, repeated data in different phases of the cardiac cycle were removed. Fig. 4A was drawn before synchronization, and Fig. 4B was drawn after synchronization of the images, in both short and longitudinal axes views.
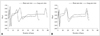
Fig. 5 shows the changes in location of the septum segment in base (Fig. 5A), mid (Fig. 5B), and apex (Fig. 5C), separately, for a sample individual, obtained by averaging the data of three cardiac cycles. The location of the septal wall is presented in three base, mid and apex levels, using x, y, and z coordinates relative to the origin, for the mid-level of the LV in pixels.
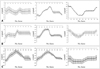
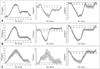
The changes of x, y coordinates in three base, mid and apex levels of the septal wall are consistent with ventricular contraction and relaxation. The changes in x are associated with big standard deviations due to small movements and tracking error. Changes of z coordinates in both base and mid-levels are consistent with systolic and diastolic ventricular phases but are opposite to the expected positive direction of z in the apex level. Changes of z coordinates in the three base, mid and apex levels suggest that the septal wall contracts during the cardiac cycle, while moving in the direction of negative z (the direction of the apex). The average rates of temporal changes of χ, θ and Φ during three cardiac cycles for the mid-ventricular septal wall of a healthy individual are presented in Fig. 5 for three base (Fig. 6A), mid (Fig. 6B), and apex (Fig. 6C) levels in degrees.
Considering the positivity contract of counter-clockwise direction forms the apex point of view for θ, and negativity contract form perpendicular to the plane (⊥Z, Z) point of view for χ, the counter-clockwise rotation of the apex and clockwise rotation of the base are in agreement with the results of previous studies.3)6)7)11)15) Due to the non-definition of a unique direction for Φ, its magnitude is shown.
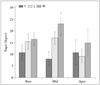
The averages and standard deviations of χM, θM, and ΦM during three cardiac cycles for the interventricularseptal wall in healthy individuals in this study are presented in Fig. 7, for the three base, mid and apex levels in degrees.
Considering Fig. 7, the bigger magnitude of ΦM in all three base, mid and apex levels compared to the other two angles is clearly obvious. θM is smaller than the other two angles in both base and mid-levels which suggests a large septal wall movement in the longitudinal direction, compared to the short-axis direction. θM was obtained bigger than the χM angle in the apex level, and considering its large standard deviation, it requires further investigation.
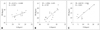
After studying the normality of data (Shapiro-Wilk test), the correlations between χM and ΦM, and also angle θM in the three base, mid and apex levels were analyzed, using Pearson's analysis of correlation (Fig. 8). A highly significant correlation was observed between the two θM and ΦM in the apex level (r = 0.82, p = 0.03). The results showed a significant correlation between χM and ΦM in the base level of the interventricularseptal wall (r = 0.57, p = 0.03) and in the mid-level of the interventricularseptal wall (r = 0.79, p = 0.01).
The regression function between θM and ΦM angles in the apex level was estimated as ΦM = 0.87 × θM + 5.57. The regression function between χM and ΦM angles was estimated as ΦM = 0.35 × χM + 11.09 in the base level of the interventricularseptal wall and as ΦM = 1.46 × χM - 1.62 in the mid-level of the interventricularseptal wall. There was no significant correlation between θM and ΦM angles, in both base and mid-levels. ΦM and χM angles had no significant correlation in apex level.
Discussion
Quantification of the LV motion were primarily based on simplified geometrics such as cylinder and truncated ellipsoid by considering the isotropic myofiber structure.21)22)23)24) The geometric model of ellipsoid with isotropic myofiber structure was used in the current study, which is the closest simple geometric model to the actual ventricular geometry. The LV's motion has been estimated by applying differential and area matching algorithms on sequential 2-dimensional echocardiography or MRI images.19) The rotation angles for different segments were estimated using short-axis view images in two dimensions, and the mean of angles was considered as the rotation angle, for each level. The torsion angle (difference of angles in two base and apex levels),11) is a general parameter and depends on the changes in the whole ventricle. Since ventricle motion takes place in circumferential, radial and longitudinal directions, and because of the possibility of change in pattern of the ventricle motion inonly a particular direction, the rotation and torsion angles may not be sensitive enough in different physiological conditions. In order to have a parameter that includes all three directions, and reflects their changes, ф was defined and estimated. A block matching algorithm was used. Factors such as changes in the shape of tissue, image noise, speckle non-correlation, off-the-screen motion, and artifacts caused by speckle motion, have restricted the use of block matching in ultrasonic images.25)
Results of correlation between фM with θM and χM showed a significant correlation between the фM and θM of apex level. Also фM and χM were significantly correlated in both base and mid-levels. The non-correlation between the фM and θM in both base and mid levels, and also the non-correlation between фM and χM in apex level could be due to specific orientation of fibers in those regions. According to Torrent-Gausp model, the fibers in base and mid regions of septum have longitudinal orientation and the fibers in its apex segment have circumferential orientation.4) Therefore, motion in base and mid levels of septal wall will be affected by longitudinal fibers and the χ has a bigger contribution in ф. The motion of septal wall is also affected by circumferential fibers in apex level; therefore θ has a bigger contribution in ф.
Gustafsson et al.11) reported the magnitude of θ as -8.8 ± 3.5° in the base, -2.3 ± 3.0° in the mid, and 11.1 ± 4.4° in the apex levels. θM of the interventricular septum in the current study was estimated as -10.61 ± 3.38° in the base, -7.78 ± 2.96° in the mid, and 10.37 ± 5.48° in the apex segments. The range and sign of angles in both base and apex levels are in agreement with Gustafsson et al.11) A great difference is observed in mid-level that isprobably associated with the lack of an accurate definition of mid-level. During the only study that was conducted in long-axis view, Arab-Baferani et al.16) estimated χM as 18.51 ± 3.41° in the base, and 14.74 ± 2.91° in the apex levels. χM of the interventricular septum was estimated as 15.11 ± 3.30° in the base, 16.72 ± 2.66° in the mid, and 8.79 ± 5.82° in the apex segments, respectively. It seems that the difference for apex level is associated with the lack of an accurate definition of this level, and tracking error, due to low quality of images. It should be noted that no standard value has yet been defined for χM and θM.
The magnitude of фM was estimated as 16.33 ± 3.01° in the base, 22.77 ± 4.95° in the mid, and 14.60 ± 5.81° in the apex levels. Urbano Moral et al.26) reported the average rotation in the base and apex levels as -2.6 ± 1.6° and +8.2 ± 3.6°, respectively using the speckle tracking of 3-dimensional echocardiography images. This study was carried out using an Artida 4D system (Toshiba Medical Systems, Tustin, CA, USA) that according to the instructions of its manufacturer, measures the rotation in two base and apex levels. Thus, the obtained results cannot be compared with the results of this study.
Due to the low temporal resolution of 3-dimensional images during echocardiography in the current study, and the impossibility of saving raw 3-dimensional images, the combination of 2-dimensional images was used. While having the advantage of high temporal resolution, this approach does however increase the error for finding the location of the desired segment in images of longitudinal view, and their corresponding segment in short-axis view, and suffers from imaging in two different times. Thus, using real-time 3-dimensional images can be an effective way to remove some of these factors. It is suggested that such angle is measured using real-time 3-dimensional images and the capability of ф to identify the physiological conditions of healthy and unhealthy hearts compared to the other two angles, will be examined.
In conclusion, due to the motion of the wall of the LV in three dimensions, and the non-isotropic structure of myofibers, it is possible that in different physiological conditions, any measurable change only happens during the motion of myocardial muscle in one of the longitudinal, circumferential or radialdirictions. Therefore, a parameter dependent on the motion in three directions can be helpful. So, ф for myocardial muscle was defined using the speckle tracking method of 2-dimensional echocardiography images in both short-axis and long-axis views and estimated in three base, mid and apex levels of the septal wall. The significant correlation between this angle and θ and Φ show that this angle can be used to study the behavior of the myocardial muscle in different pathological conditions.

 XML Download