

 PDF
PDF ePub
ePub Citation
 Print
Print


Introduction
Mitral regurgitation (MR) is one of the most prevalent valvular heart diseases. It is estimated that at least 2 million individuals in the USA are thought to have a moderate or severe degree of MR.1) Quantifying the severity of MR is important because it is related to the prognosis and guidance for the management of patients.2-5) Currently, the standard method to quantify MR is two-dimensional (2D) transthoracic echocardiography (TTE) using either the color Doppler by volumetric quantification method (VM) or the proximal isovelocity surface area (PISA) method.2)6) However, methods that utilize 2D TTE are limited by multiple assumptions which can introduce error in the quantification of MR severity.7)8) Because of this and the inherent complexity of regurgitation, current quantification methods with color Doppler require a multiple-step process, are user-dependent, and cannot be applied to multiple eccentric MR.
It is now possible to obtain three-dimensional (3D), full volume, continuous beat-to-beat color Doppler in real time. Additionally, commercially available algorithms are developed that can detect the endocardial border of the left ventricle (LV) in an automated manner. By utilizing and extending these algorithms, more accurate measurements of flow rate and volume are possible. Also, there is potential to minimize the geometric assumptions involved in these measurements in a practical manner.9-11) Thavendiranathan et al.12) automatically quantified mitral inflow and LV outflow (LVOT) stroke volumes (SV) by real time 3D full volume color Doppler echocardiography (FVCD) and compared these results with those from 2D pulsed-wave (PW) Doppler and cardiac magnetic resonance imaging (CMR). They showed that real time 3D-FVCD imaging with an automated quantification algorithm is feasible, accurate, and reproducible for measuring mitral inflow and LVOT SV and is superior to manual 2D TTE-based measurements.
In this study, we aimed to explore the feasibility and accuracy of automated quantification of MR by real time 3D-FVCD, comparing it with conventional 2D Doppler TTE and phase contrast CMR (PC-CMR).
Methods
Study population and protocols
Over the duration of study, 32 consecutive patients with more than a moderate degree of MR were prospectively enrolled. Severity of MR was defined by effective orifice area and/or amount of MR volume obtained by the 2D TTE PISA method, as described in the 2003 American Society of Echocardiography (ASE) recommendation.2) Patients with significant aortic regurgitation, abnormal intracardiac shunt, significant arrhythmia including ventricular arrhythmia and poorly controlled atrial fibrillation (heart rate > 100 beat per minute and/or beat to beat variability > 30 beat per minute), and contraindication to CMR were excluded. Organic MR was defined defined as MR related with intrinsic valvular abnormalities. Functional MR was defined as leaflet tethering or incomplete coaptation of leaflets in the presence of normal mitral valve anatomy and regional or global LV remodeling.13)
The MR volume in all participants was quantified by 2D TTE (both the VM and PISA method), 3D-FVCD, and PC-CMR. These measurements were all obtained within the same day in each patient. Informed consent was obtained from all study participants, and the study protocol was approved by the Ethics Committee of Severance Hospital.
Two-dimensional echocardiography acquisition
Two-dimensional TTE was performed according to the standards of the ASE on an ACUSON SC2000™ ultrasound system (Siemens Medical Solutions USA Inc., Mountain View, CA, USA) with a 4V1c phased-array transducer at a frequency of 4.5 MHz.14) MR volume (mL) was quantified by using the PISA method according to ASE guidelines.2) PISA was measured in the apical view, where the hemispheric morphology of flow convergence can be optimized and continuous Doppler signal can be well-aligned with the regurgitant jet. Doppler aliasing velocity was shifted to optimize the appearance of PISA (from 31.0 to 42.0 cm/sec, mean 36.2 ± 7.1 cm/sec). The VM method was also used to quantify the MR volume. The diameter of the mitral annulus (MA) was measured in the apical four chamber view at the base of the leaflets. LVOT diameter was measured in the parasternal long axis view just below the aortic annulus at the time of maximal valvular opening. The PW Doppler signal of MA inflow and LVOT outflow was achieved at the same anatomic location at which the MA and LVOT measurements were obtained in the apical four chamber view and the apical long axis view (APLAX), respectively. MR volume was calculated by subtracting LVOT SV from MA SV.15)16)
In case of atrial fibrillation, MR volume was quantified by both the PISA and VM methods when the preceding and pre-preceding R-R intervals differed less than 10%.
Real time 3D-FVCD acquisition
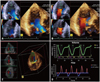
Using the ACUSON SC2000™ ultrasound system with a 4Z1c real-time volume imaging transducer (2.8 MHz), three consecutive beats of real time FVCD images with a clear electrocardiographic signal were acquired. In case of atrial fibrillation, image acquisition was performed when the R-R interval was regular, in which preceding and pre-preceding R-R intervals differed by less than 10%. The imaging plane was adjusted to clearly visualize the LVOT and MA in a single volume within the APLAX. System settings including depth and color Doppler region of interest (ROI) were optimized to maximize the color volume rates (lower depth and narrowing the focus on LV, mitral valve (MV) and aortic valve (AV) will increase color volume rates, typically > 15-25 volume per second), while ensuring that complete MV inflow and LVOT were captured without exclusion of any mitral or aortic annular color flow. Color Doppler frequency was adjusted at 2.0 MHz, and the color Doppler velocity scale was adjusted to minimize aliasing, unless significant aliasing was not detected in 2D TTE acquisition. During acquisition, two 2D reference planes focused on mitral and aortic valve were displayed at the left side of the screen to ensure the ROI is contained within the volume (Fig. 1A and B). Analysis of the acquired Digital Imaging and Communications in Medicine data was conducted offline using prototype software (Siemens Medical Solutions USA Inc., Mountain View, CA, USA) that has been previously validated.12)17)
Automated quantification of mitral regurgitant volume
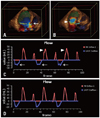
The following steps were performed in an automated manner for quantifying mitral regurgitant volume (RV) using prototype software: 1) automated anatomy detection of the LV endocardial border, MA, and the LVOT was performed utilizing knowledge-based anatomy recognition algorithms.18) 2) The algorithm tracked the 3D motion of the detected LV wall, MA, and the LVOT as estimated by fusing information from multiple cues, including optical flow, boundary detection, and motion prior. Optical flow is a method of image intensity displacement tracking between two frames, boundary detection identifies the learned 3D image features associated with the LV border, and motion prior is a learned statistical motion model of the LV border.12)17) 3) The software placed 3D hemispheric flow sampling planes in MA and LVOT. The locations of these planes were dynamically adjusted throughout the cardiac cycles. Three parallel sampling planes spaced 1 to 2 mm apart were placed at each location, and an average of the flow rates at these three planes was computed to minimize the impact of the variation in SV due to location.19) For a typical system setting of 14-17 cm in depth, a color ROI size covering both the aortic and mitral valves, and volume rates of 14-34 volumes/sec, the estimated color Doppler voxel dimension at the sampling plane was 4.5 × 5.0 × 0.6 mm in the azimuthal, elevational, and range directions. The final rendered voxel dimension of about 0.4 mm isotropic was obtained after interpolation and scan conversion per conventional ultrasound imaging methods (Fig. 1C). 4) The software detected the flow velocities at each voxel in the sampling plane and computed the flow volume by aggregating all the sample color flow values. A flow-time curve was derived from flow volume aggregated at each frame in the cardiac cycle, and a calculation of the mitral and aortic SVs was performed by temporal integration of this curve (Fig. 1D). 5) Based on the tracked LV endocardial boundaries, a de-aliasing factor was calculated as the ratio of the instantaneous LV volume change between two neighboring frames to the flow volume change at the MA (during diastole) or the LVOT (during systole) during the same two frames. This de-aliasing factor was then automatically applied to each frame if aliased flow was detected by the algorithm. 6) The de-aliased flows of three consecutive cardiac cycles were displayed as a flow-time curve and additional, optional operator-defined de-aliasing adjustments may have been performed if automated de-aliasing was incomplete, expressed as a notch in the flow-time curve (Fig. 2). 7) The software computed the flow volumes as areas under the curves of both the MA and LVOT flow in three cardiac cycles, and MR volume was calculated by subtracting LVOT SV from MA SV.
PC-CMR data acquisition and analysis
CMR was performed utilizing a 1.5-T magnet using a 12-channel phased-array coil (Philips, Andover, MA, USA). LV total SV was calculated in short axis cine images covering the LV by subtracting LV end systolic volume from LV end diastolic volume using manual contouring of the endocardial borders and Simpson's method. Typical repetition time was 3.1 ms, and echo time was 1.5 ms with slice thicknesses of 10 mm for 25 phases. Aortic SV was obtained by through-plane phase-contrast imaging with the imaging plane prescribed 2-3 cm above the aortic valve in an orthogonal orientation to the aortic root (typical repetition time: 4.7 ms, echo time: 2.8 ms, slice thickness: 8 mm; 50 frames/cardiac cycle; aliasing velocity: 200 cm/sec; number of excitations: 2). MR volume was calculated by subtracting aortic SV from LV total SV.
Reproducibility analysis
To determine intra-observer and inter-observer reproducibility, 2D- and 3D-FVCD image analysis was repeated by a second observer in 10 randomly selected patients at a different time point and as well as by the primary reader at least one month later. During all analyses, examiners were all blinded to the results of previous measurements.
Statistical analysis
Continuous variables are presented as the mean ± standard deviation. Mean mitral RV quantified by 2D-PISA, 2D-VM, 3D-FVCD, and PC-CMR were compared by one-way analysis of variance (ANOVA) and by the non-parametric Kruskal-Wallis test. Categorical variables are presented as absolute numbers or percentages. Linear regression analysis (Pearson correlation) was performed to evaluate the correlation between variables. Bland-Altman plots were used to evaluate differences in RV assessments between 2D TTE, 3D-FVCD, and PC-CMR. Mean differences and limits of agreement are reported. Intraclass correlation coefficient (ICC) was used to measure and compare agreement of RV between PC-CMR and other methods. To evaluate intra-observer and inter-observer reproducibility, ICC was calculated. Good correlation was defined as an ICC > 0.8. All analyses were performed using PAWS statistic version 18.0 (SPSS Inc., Chicago, IL, USA) and MedCalc version 12.3 (MedCalc Software, Mariakerke, Belgium). A p value < 0.05 was considered statistically significant.
Results
A total of 32 patients with more than a moderate degree of MR were initially assessed for inclusion. Two patients were excluded due to inadequate 2D and 3D color Doppler images. The MR volume of the remaining 30 could be assessed with 3D-FVCD and prototype software in an automated manner. The mean volume rate of 3D-FVCD images was 20.2 ± 4.6 volumes/second and ranged from 15-29 volumes/second.
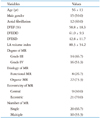
The study population consisted of 15 men and 15 women (mean age 56 ± 13 years). Population characteristics are shown in Table 1. Eighteen patients were in sinus rhythm, and 12 patients showed atrial fibrillation on the electrocardiogram. All the patients with atrial fibrillation showed low variability in heart rate (beat-to-beat variability < 30 bpm). Mean LV end-diastolic dimension and end-systolic dimension as measured with 2D-TTE were 61.0 ± 9.3 mm and 42.8 ± 11.7 mm, respectively. Mean left atrial volume index was 80.3 ± 54.2 mL, and mean LV ejection fraction was 58.8 ± 18.3%.
Severity and characteristics of MR are shown in Table 1. Based on the RV measurements by 2D-PISA, 14 (46.7%) patients had grade 3, and 16 (53.3%) patients had grade 4 MR. Functional MR was present in eight (26.7%) patients and organic MR in 22 (73.3%) patients. Central or eccentric mitral regurgitant jets were observed in nine (30.0%) and 21 (70.0%) patients, respectively. There were multiple regurgitant jets in ten (33.3%) patients and single jet in 20 (66.7%) patients, respectively.
Comparison of 2D-TTE and RT-FVCD
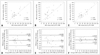
The mean RV quantified by 2D-PISA, 2D-VM, 3D-FVCD, and PC-CMR was 72.1 ± 27.7, 79.9 ± 36.9, 69.9 ± 31.5, and 64.2 ± 30.7 mL, respectively. No significant differences between groups was observed (p = 0.304 by one way ANOVA, and p = 0.160 by Kruskal-Wallis test). The correlation between RV-3D-FVCD and RV-PC-CMR; RV-2D-PISA and RV-PC-CMR; and RV-2D-VM and RV-PC-CMR are shown in Fig. 3A, B and C. There was a more excellent correlation between RV-PC-CMR and RV-3D-FVCD (r = 0.85, 95% CI 0.70-0.93, p < 0.001) than RV-PC-CMR and RV-2D methods (PISA r = 0.55, 95% CI 0.23-0.76, p = 0.002; VM r = 0.58, 95% CI 0.27-0.78, p = 0.001). The agreement between 2D-TTE and both 3D-FVCD and PC-CMR as evaluated by Bland-Altman analysis is illustrated in Fig. 3D, E and F. Compared with PC-CMR, Bland-Altman analysis for 3D-FVCD showed better limits of agreement and smaller bias [2 standard deviation (2SD): 34.3 mL; bias: -5.7 mL] than 2D-PISA and 2D-VM (2SD: 60.0 mL; bias: -7.9 mL, and 2SD: 62.8 mL; bias: -16.7 mL), respectively. The agreement between RV-PC-CMR and RV-3D-FVCD evaluated by ICC (0.85, 95% CI 0.71-0.93) was better than RV-PC-CMR and RV-2D TTE methods (0.54, 95% CI 0.23-0.75 within PC-CMR and 2D-PISA; and 0.57, 95% CI 0.27-0.77 within PC-CMR and 2D-VM).
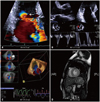
A representative case of MR volume comparison between respective modalities is demonstrated in Fig. 4.
Discussion
This study demonstrates the quantification of the MR volume using real time transthoracic 3D-FVCD and validates the accuracy by comparing it with CMR. It was feasible, reproducible, and accurate to quantify MR by 3D-FVCD with an automated quantification of MR volume.
Present standard methods for MR quantification are the PISA and volumetric methods using 2D TTE.2)6) Although 2D methods are well-validated and guidelines recommend using these methods for MR quantification, these methods have many innate limitations and assumptions.20)21) The PISA method assumes the hemispheric shape of the PISA. However, the shape of the PISA can vary depending on the shape of the regurgitant orifice and instrument settings, which may lead to a miscalculation of effective regurgitant orifice area and the MR volume.8) Direct measurement of the PISA using real time 3D color Doppler echocardiography can overcome this limitation.22) However, the inability of the PISA method to quantify eccentric and multiple MR cannot be overcome. Using the volumetric method (which measures mitral inflow and aortic SVs) to calculate the MR volume is an alternative as it is free from the assumptions and limitations of the PISA method. However, this 2D TTE flow quantification method also has limitations. The relative ovoid shape of the MA, which is assumed as circular, can introduce error when calculating MA cross-sectional area, and geometric variation in the cross-sectional valvular areas over the cardiac cycle is not accounted for. Small measurement errors of the LVOT or MA diameter may lead to large differences in SVs. In addition, since PW Doppler of LVOT flow and MA flow are obtained in a separate echocardiographic windows, the timing of the measurements are different and can introduce error.
CMR is often used as a reference method for MR quantification because it is 1) the most accurate non-invasive technique for quantifying the LV SV,23) and 2) the phase contrast velocity flow mapping of the aortic forward SV is also accurate and reproducible, which can be a more objective and consistent method for quantifying eccentric and multiple MR.
3D-FVCD uses a similar mechanism as PC-CMR for quantifying AV and MV stoke volume, and it quantifies the MR by subtracting AV SV from MV SV. By using this technique we can quantify the eccentric and multi-jet MRs more accurately than by 2D-PISA. Furthermore, unlike 2D VM, the 3D-FVCD method does not assume the geometric morphology of the MA and LVOT, but automatically detects the plane of the MA and LVOT and calculates the flow crossing this plane, which overcomes the limitation of 2D VM. Because of these merits, we found that the accuracy, agreement, and inter- and intra-observer variability of MR quantification by 3D-FVCD was better than the 2D methods, even though the proportion proportion of eccentric and multi-jet MR is high in our study. Moreover, feasibility is comparable with 2D TTE. Furthermore, the workflow of image acquisition, measurement, and analyzing of the MR volume by 3D-FVCD is a relatively simple and automated process, which can be easily applicable in clinical practice.
The most difficult problem to overcome in the 3D-FVCD method is "aliasing". Aliasing remains a limitation of ultrasound physics. In the previous study of quantifying the mitral inflow and aortic outflow SVs automatically by real time 3D-FVCD in normal population, the flow velocity across both the MA and LVOT planes usually did not exceed the limit of Nyquist.12) Therefore, aliasing of flow was not a major issue. Even in cases where there was aliasing of flow, automated de-aliasing was able to be performed properly. However, a certain proportion of subjects (32%) needed to be reassessed by using additional operator-defined, automated de-aliasing mechanisms.12) In our study, we maximized the color Doppler scale to avoid aliasing whenever possible. The aliasing of the flow in both annulus planes was common given the increased blood volume flow through these planes resulting from MR. As a result, additional operator-defined automated de-aliasing had to be performed in 26 patients (86.7%). After this de-aliasing, the MR volume quantified by 3D-FVCD showed an excellent correlation and agreement with reference method, CMR.
Clinical implication
By using the 3D-FVCD method, we expect to quantify the MR volume more accurately, especially in the subgroup of patients with eccentric and multi-jet MR. Also, we can extend the application of 3D-FVCD to quantifying right side heart flow, such as right ventricular SV, which can be used to calculate the amount of left to right shunt (Qp/Qs) and pulmonary vascular resistance in a patient with an intracardiac shunt or pulmonary hypertension. Other valvular regurgitations, such as tricuspid regurgitation, aortic regurgitation, and pulmonic regurgitation, can be quantified by a similar workflow.
Limitation
There were several limitations within our study. First, a relatively small number of patients were included. Second, although all the patients were enrolled consecutively, this study is a single-center prospective observational study and subject to intrinsic limitation. Third, PC-CMR, the reference method for MR volume quantification, also has several innate limitations. The PC-CMR method for directly quantifying MV inflow volume is technically difficult due to vigorous movement of MV plane. So, instead of using the phase-contrast method for directly quantifying the MV inflow volume, we obtained LV SV by manual contouring of the endocardial borders and Simpson's method. Also, aortic SV is obtained at a plane above the aortic valve, which was different from the LVOT plane used in the 3D-FVCD method. Due to these limitations, a direct comparison of MV and LVOT SV between 3D-FVCD and CMR could not be achieved. However, the CMR method is well-validated for quantifying the MR volume and widely used in clinical practice and research studies.23)24) Fourth, there was a relatively large number of patients with atrial fibrillation included in this study. Atrial fibrillation is more common in patients with MR, and this can reduce the accuracy of flow measurements not only by echocardiography but also by CMR. However, we only included those patients with atrial fibrillation who also had low heart rate variability (beat to beat variability < 30 beat per minute). In these patients, the MR volume quantified by CMR using the indirect method was not significantly different from the MR volume quantified by the direct method, which is independent from irregular rhythm.25) In addition, we acquired and quantified the MR volume by both 2D and 3D methods in the cardiac cycles of preceding and pre-preceding R-R intervals differing less than 10% to minimize any beat-to-beat variation.
 XML Download