

 PDF
PDF ePub
ePub Citation
 Print
Print


INTRODUCTION
Aortic stenosis (AS) is the most common degenerative valve disease. The prevalence of AS ranges from 2% to 9% of aged population over 65 years old, and it is increasingly diagnosed in the contemporary era of aging society.1) Given no established medical treatment to improve prognosis of AS patients, decision to proceed with corrective surgery is crucial. Progression of AS is usually longitudinally followed using transthoracic echocardiography, and the estimation of effective orifice area of aortic valve (EOAAV) is considered the most important parameter to monitor AS patients.2)
EOAAV is calculated by the transvalvular pressure gradient (TPG) and transvalvar flow, and TPG is associated with systemic vascular resistance (SVR).3) In the presence of systemic hypertension or peripheral arterial disease, SVR increases and this SVR alteration might possibly change the parameters that are frequently used to determine AS severity. This hypothesis is corroborated by notion that high left ventricular (LV) afterload can result in paradoxical low-flow, low-gradient severe AS, highlighting the notion that LV afterload should be considered in terms of assessing severe AS.4)
Furthermore, in contrast to traditional belief that blood pressure was thought to be decreased in case of severe AS, recent studies reported that hypertension is common even in severe AS patients and one of the important risk factors of significant AS.1) Therefore, consideration of hypertension is a commonly encountered clinical situation in estimating AS severity.5) The aim of this study was to investigate the impact of LV afterload on the assessment of AS severity.
METHODS
STUDY SUBJECTS
Patients diagnosed as moderate or severe AS (EOAAV calculated from continuity equation of less than 1.5 cm2) were consecutively enrolled from March 2008 to February 2009. All of the patients were in normal sinus rhythm. Exclusion criteria were as follows; patients with inadequate image quality due to poor echo window, any valvular regurgitation more than mild degree, any valvular stenosis other than aortic valve, severe systemic hypertension [systolic blood pressure (BP) of > 180 mmHg, and/or diastolic BP of > 110 mmHg], severe LV dysfunction defined as LV ejection fraction (EF) of less than 30%, and diagnosis of acute coronary syndrome within a month. Patients with peripheral artery disease with claudication were also excluded.
STUDY PROTOCOL
The study protocol was approved by the institutional review board of hospital. Transthoracic echocardiography was performed using commercially available echocardiography machine (Vivid 7, GE Medical Systems, Milwaukee, WI, USA). If the patient was confirmed to be eligible, baseline echocardiography was performed after 20 minutes of rest. Non-invasive BP and heart rate (HR) were measured just before echocardiography examination. Routine standard echocardiography examination included M-mode, 2D, and Doppler echocardiography. LV EF was calculated by the modified Simpson method. Peak early (E) and late (A) diastolic velocities of the mitral inflow were measured using a pulsed-wave Doppler at the tip of mitral valve leaflets, and peak early (E') and late (A') diastolic mitral annular velocities were acquired at the septal side in the apical 4 chamber view. Recording of aortic valve maximal systolic velocity (AV Vmax) was acquired from multiple views including suprasternal, right parasternal, apical and subcostal transducer positions with a continuous-wave Doppler echocardiographic technique, among which only the highest peak velocity was chosen for subsequent analyses. Pulsed-wave Doppler at LV outflow tract (LVOT) was also obtained at the apical 5-chamber view. LV end-systolic wall stress was calculated as follows;

(LV end-systolic wall stress is in g/cm2, Pes, which stands for LV end-systolic pressure plus maximal pressure gradient of aortic valve, is in mmHg, Des and Hes are in cm, and 0.34 is the factor for converting Pes from mmHg to g/cm2.)
Specially designed pneumatic trousers without the bladder for compression of the lower abdomen were put on the patients as previously described.6) After baseline echocardiography data acquisition, a specially designed compressor inflated the pneumatic trousers up to a pressure of 100 mmHg on both lower extremities and this pressure was maintained throughout the examination. Echocardiography was performed including Doppler parameters 3 minutes after pneumatic compression of the lower extremities (Pcom). BP and HR were again measured under Pcom.
ANALYSIS OF DOPPLER AND HEMODYNAMIC PARAMETERS
Doppler echocardiographic measurements were derived from the average of 3 consecutive cardiac cycles. Doppler measurements of AV Vmax, transvalvular peak and mean pressure gradient (AV peak PG and AV mean PG), and time-velocity integral of LV outflow tract (TVILVOT) and aortic valve (TVIAV) were also made. EOAAV was calculated by continuity equation as previously described.7) Doppler velocity index (TVILVOT/TVIAV) was calculated, as well. LVOT area (CSALVOT) was calculated from the diameter obtained at the level of the aortic annulus during systole with the assumption of a circular shape of LVOT. LV stroke volume was calculated by multiplying CSALVOT by TVILVOT as previously described.8) Cardiac output (CO) was calculated by multiplying SV and HR.
Systemic vascular resistance (SVR) was estimated as: SVR = 80 × mean BP / CO and systemic arterial compliance (SAC) was calculated as: SAC = SV / (SBP - DBP)
STATISTICAL ANALYSIS
Numerical data are expressed as means ± SD or median (interquartile range) where appropriate. Categorical data are expressed as numbers and percentages. Paired t-test was adopted for comparison of echocardiographic parameters between before and after application of Pcom. All statistical analyses were performed using PASW 18.0 (SPSS Inc., Chicago, IL, USA), and p-values of < 0.05 were considered statistically significant.
RESULTS
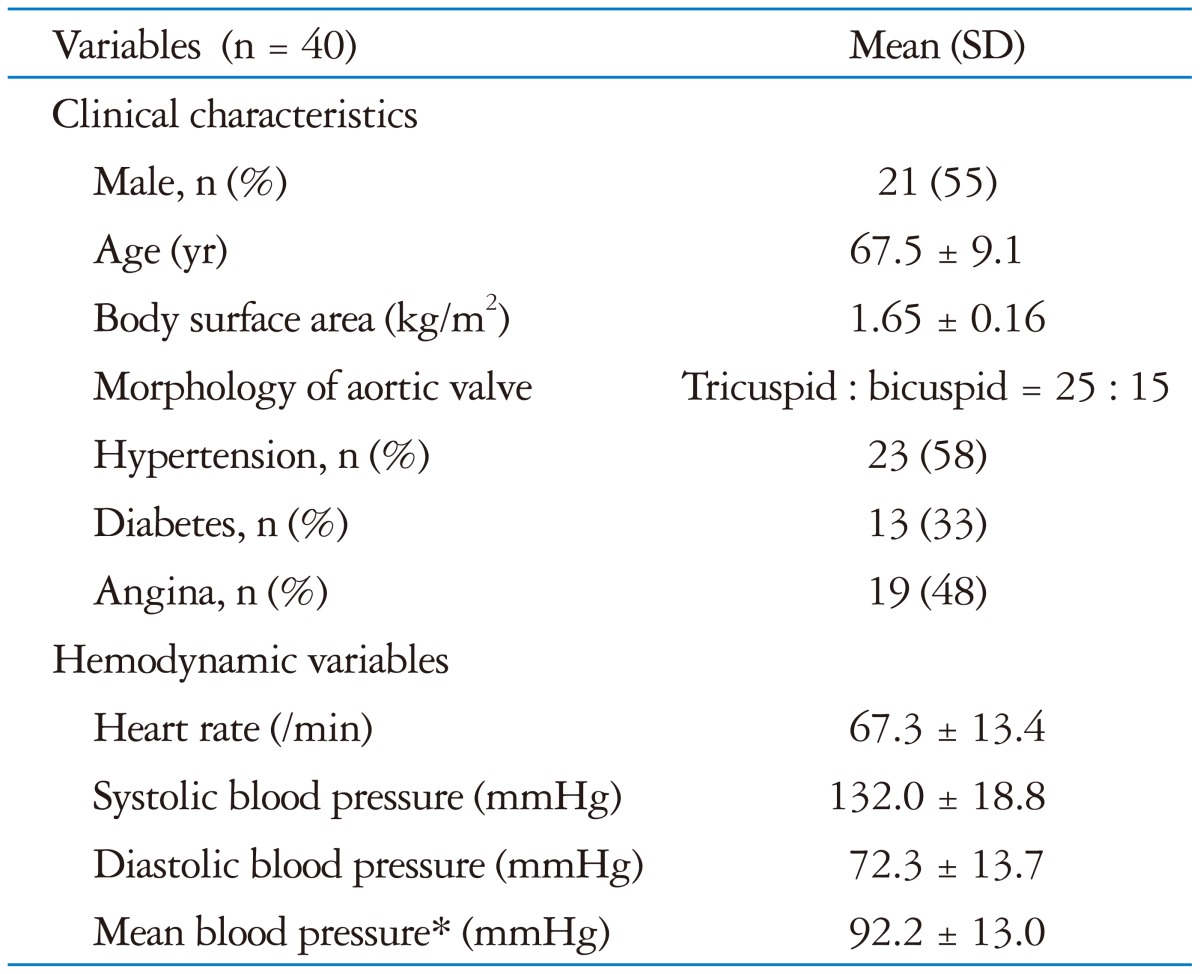
In all, 40 patients with moderate or severe AS were analyzed. Table 1 summarized the baseline clinical and hemodynamic data of the study participants.
HEMODYNAMIC CHANGES UNDER PCOM
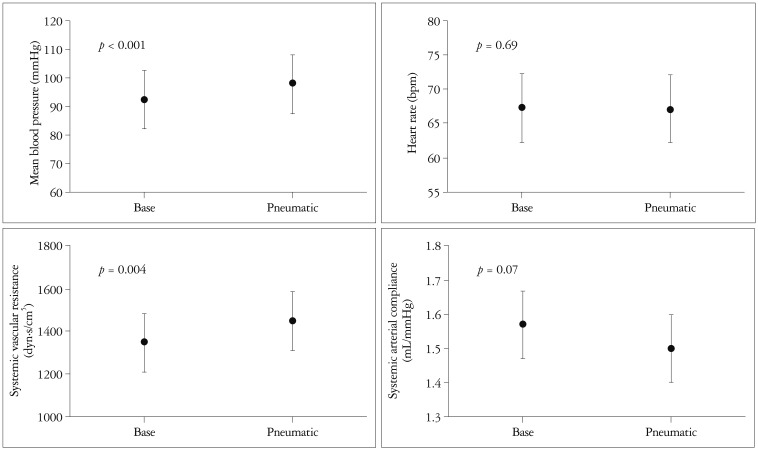
Mean BP was significantly increased from 92 ± 13 to 98 ± 14 mmHg (p < 0.001) (Fig. 1) under Pcom. With BP increment under Pcom, SVR significantly increased from 1351.0 ± 370.2 to 1450.3 ± 476.0 dyn·s/cm5 (p = 0.004) and accordingly, SAC was decreased from 1.57 ± 0.53 to 1.49 ± 0.55 mL/mmHg (p = 0.07). However, HR remained unchanged (67.23 ± 13.4 bpm at baseline vs. 67.1 ± 12.8 bpm under Pcom, p = 0.69).
CHANGES OF LV FUNCTIONAL PARAMETERS UNDER PCOM
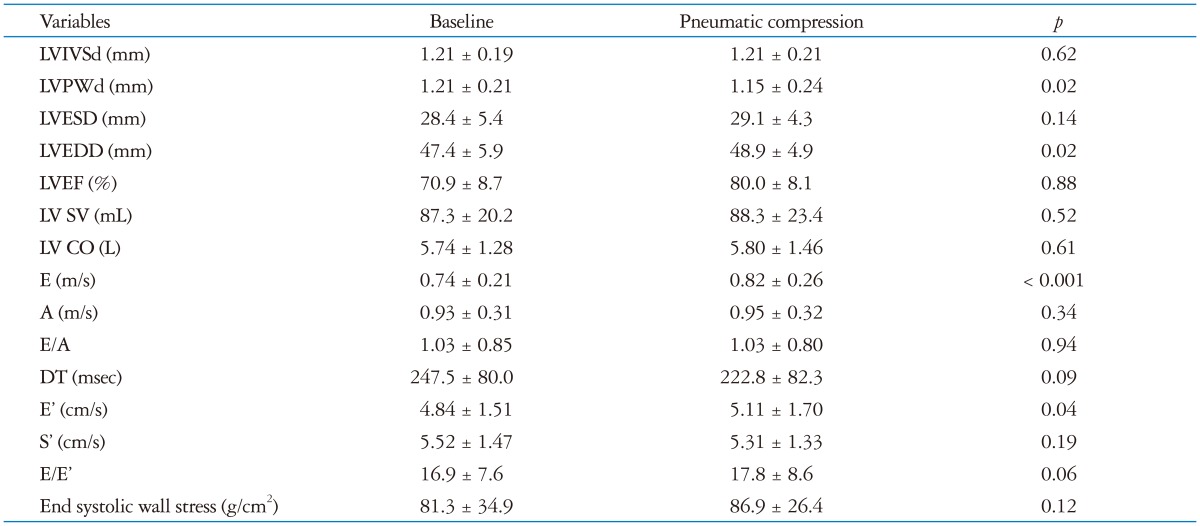
Pcom application exerted no significant effect on LV end-systolic dimension and LV EF (Table 2). Likewise, LV SV and CO under Pcom were comparable to those measured at baseline. In contrast, LV end-diastolic dimension was slightly increased under Pcom (47.4 ± 5.9 mm vs. 48.9 ± 4.9 mm, p < 0.02). E wave velocity was also significantly increased after pneumatic compression (0.74 ± 0.21 m/s vs. 0.82 ± 0.26 m/s, p < 0.001), and E/E' tended to be slightly increased with a borderline statistical significance (16.9 ± 7.6 vs. 17.8 ± 8.6, p = 0.06). E/A ratio and deceleration time showed no changes under Pcom. Neither S' nor calculated end-systolic wall stress under Pcom showed significant changes.
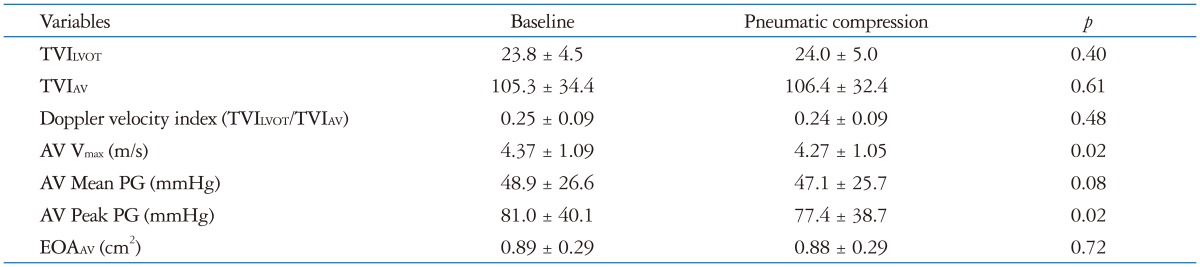
ASSESSMENT OF AS SEVERITY BEFORE AND AFTER PCOM APPLICATION
Doppler velocity index (TVILVOT/TVIAV) was not changed under Pcom (p = 0.48) (Table 3). However, AV Vmax and AV peak PG displayed a small, but significant decline under Pcom however absolute difference between the two different afterload status was only 0.10 ± 0.24 m/s and 1.73 ± 6.08 mmHg, respectively (Table 3). Changes in AV mean PG and EOAAV were insignificant under Pcom.
DISCUSSION
In the present study, we modulated LV afterload using specially designed pneumatic compression trousers without any significant effect on HR to evaluate the impact of LV afterload modification on the assessment of AS severity. Pcom successfully increased LV afterload, as evidenced by increased SVR as well as decreased SAC without any change of HR. Although TPG of aortic valve slightly decreased with LV afterload rise, this was not translated into significant changes in EOAAV and Doppler velocity index obtained with routine echocardiography.
Increased afterload may have a potential to affect the accuracy of assessment of AS severity. Increased afterload increases SVR, which subsequently elevates the ascending aortic pressure. In case of significant AS, the effect of increased systemic central BP on intraventricular pressure might be minimal, and thus, TPG between LV and ascending aorta might be decreased because of relatively increased central aortic pressure in comparison with intra-LV pressure. However, if the transmission of increased afterload into LV cavity per se were considerable, LV systolic wall stress would rise and lead to a decrease in LV systolic performance. In addition, increased LV afterload along with a decrease in SAC can attenuate LV CO,9) and finally result in a decrease in AV mean PG, AV Vmax, and AV peak PG.
It may be possible that aortic root expansion also can increase CSALVOT during systole, and subsequently lead to commissural separation and finally stretch the free edge of the aortic valve leaflets. Although the effect of aortic root expansion was previously reported in normal aortic valve,10)11) it appears to be unclear whether thickened and less mobile aortic valve and annulus can change their shape during LV afterload changes as normal aortic valve does.
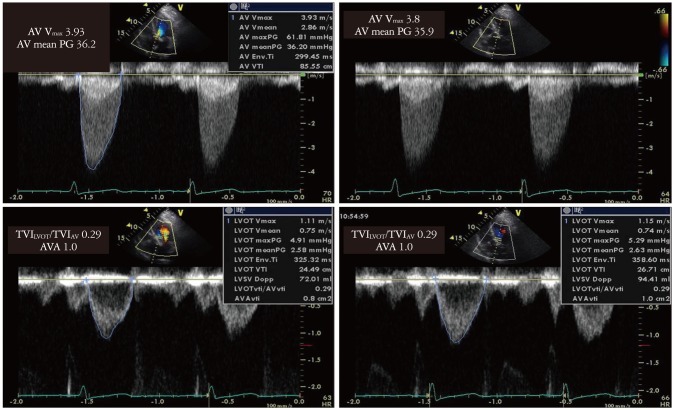
In this study, we found that LV EF, LV SV and CO did not change significantly with a maneuver leading to a rise in LV afterload. In order to achieve effective LV afterload increment without any influence of HR, we employed Pcom. Although we could did not directly measure intracardiac pressure, Pcom was considered very effective in modifying LV afterload, as demonstrated by a significant increase in SVR. As shown in our representative cases in Fig. 2, TPG of AV, as represented by 2 parameters of AV Vmax and AV peak PG, was decreased under Pcom, suggesting the fact that an increase of aortic pressure was even greater than an increase of intra-LV pressure during systolic phase in the setting of LV afterload increment. On the other hand, EOAAV and Doppler velocity index did not change, indirectly highlighting that increased afterload did not modulate aortic root size or commissural opening of stenotic aortic valve in this special AS population.
In this study, we used Pcom for experimental change in afterload. Pcom successfully increased LV afterload without a significant change in HR; however, Pcom possibly increases the venous return from lower extremities, which could explain, to some extent, increased E velocity, and slightly increased LV end-diastolic dimension. Increased preload can increase the stroke volume and possibly increase the AV Vmax of aortic valve. Our data showed no significant change of stroke volume, AV peak PG and AV Vmax before and after Pcom; thus the effects of Pcom on LV preload and stroke volume, and furthermore AS severity assessment appears negligible.
A previous study by Little et al.12) showed decreased AVA by acute BP elevation induced by phenylephrine infusion and hand grip exercise. They suggested that the impact of BP change is associated with transvalvular flow rate through aortic valve without relation to SVR or SAC. In this study, we adopted Pcom instead of hand grip exercise or phenylephrine infusion because these methods augment heart rate and induce a significant change in ejection time, as previously described. Because our study was free from changes in HR and LV ejection time under Pcom, an impact of LV afterload change on AVA assessment can be exclusively assessed, which is, we believe, a significant advantage of the current study.
LIMITATIONS
Pcom is a useful method to increase LV afterload without change of preload or HR when compared to other methods, such as hand grip exercise or phenylephrine infusion.12) However, Pcom possibly increases the venous return from lower extremities, which could explain, to some extent, increased E velocity, and slightly increased LV end-diastolic dimension. However, a previous study clearly demonstrated that the primary mechanism whereby Pcom induced changes in hemodynamics is through an acute increase in LV afterload.13) In addition, a change in LV CO was minimal, highlighting the impression that hemodynamic effect by venous return for cardiac performance was, if any, negligible. Simulation of arterial BP elevation by Pcom also has a limitation for SVR increase alone, and cannot increase aortic stiffness which is more important in essential hypertension in elderly patients. We also cannot directly measure LV systolic wall stress and central BP, because we did not perform invasive monitoring of intra-LV pressure and central BP, however, SVR and SAC that were employed in the current study were previously validated against invasively obtained hemodynamic data as indirect indexes for LV afterload.14)15)
CONCLUSIONS
Assessment of AS severity by routine transthoracic echocardiography was not significantly influenced by a change in LV afterload. AV Vmax could be slightly decreased when LV afterload rises, but these changes did not seem to exert a significant influence on clinical decision making in managing AS patients. EOAAV and Doppler velocity index is more stable method for evaluation of AS severity than AV Vmax, and therefore these 2 indexes should be used in the determination of AS severity, rather than AV Vmax or TPG of AV.
 XML Download