

 PDF
PDF ePub
ePub Citation
 Print
Print


Abstract
Background
It is still unknown whether increased cardiac adiposity is related to the risk factors of coronary artery disease (CAD). We measured epicaridal adopose tissue (EAT) and mediastinal adipose tissue (MAT) using echocardiography and examined their correlations with CAD and serum adiponectin.
Methods
One hundred fifty three patients who underwent elective coronary angiography for chest pain were measured cardiac adiposity by transthoracic echocardiography. The correlations of cardiac adipose tissue with the presence and severity of CAD and the serum adiponectin level were examined.
Results
EAT was thicker in patients with CAD (1.8±1.4 vs. 3.8±1.9 mm, p<0.001), but MAT was not different according to the presence of CAD (2.9±2.8 vs. 3.5±2.5 mm, p=0.121). EAT showed a significant positive correlation with age (r=0.225, p=0.005), homocystein (r=0.289, p=0.001), fasting glucose (r=0.167, p=0.042), and fibrinogen (r=0.218, p=0.009), and a significant negative correlation with serum adiponectin (r=-0.194, p=0.016). EAT thickness (OR 11.53, 95% CI; 3.61-36.84, p<0.001) and low serum adiponectin (OR 2.88, 95% CI; 1.02-8.15, p=0.046) were independent predictors of obstructive CAD. However, MAT thickness was not associated with CAD.
REFERENCES
1. Gorter PM, de Vos AM, van der Graaf Y, Stella PR, Doevendans PA, Meijs MF, Prokop M, Visseren FL. Relation of epicardial and pericoronary fat to coronary atherosclerosis and coronary artery calcium in patients undergoing coronary angiography. Am J Cardiol. 2008; 102:380–385.

2. Ahn SG, Lim HS, Joe DY, Kang SJ, Choi BJ, Choi SY, Yoon MH, Hwang GS, Tahk SJ, Shin JH. Relationship of epicardial adipose tissue by echocardiography to coronary artery disease. Heart. 2008; 94:e7.
3. Eroglu S, Sade LE, Yildirir A, Bal U, Ozbicer S, Ozgul AS, Bozbas H, Aydinalp A, Muderrisoglu H. Epicardial adipose tissue thickness by echocardiography is a marker for the presence and severity of coronary artery disease. Nutr Metab Cardiovasc Dis. 2009; 19:211–217.
4. Sarin S, Wenger C, Marwaha A, Qureshi A, Go BD, Woomert CA, Clark K, Nassef LA, Shirani J. Clinical significance of epicardial fat measured using cardiac multislice computed tomography. Am J Cardiol. 2008; 102:767–771.
5. Jeong JW, Jeong MH, Yun KH, Oh SK, Park EM, Kim YK, Rhee SJ, Lee EM, Lee J, Yoo NJ, Kim NH, Park JC. Echocardiographic epicardial fat thickness and coronary artery disease. Circ J. 2007; 71:536–539.
6. Djaberi R, Schuijf JD, van Werkhoven JM, Nucifora G, Jukema JW, Bax JJ. Relation of epicardial adipose tissue to coronary atherosclerosis. Am J Cardiol. 2008; 102:1602–1607.
7. Hwang JW, Choi UJ, Ahn SG, Lim HS, Kang SJ, Choi BJ, Choi SY, Yoon MH, Hwang GS, Tahk SJ, Shin JH, Kang DK. Echocardiographic plains reflecting total amount of epicardial adipose tissue as risk factor of coronary artery disease. J Cardiovasc Ultrasound. 2008; 16:17–22.
8. Mazurek T, Zhang L, Zalewski A, Mannion JD, Diehl JT, Arafat H, Sarov-Blat L, O\'Brien S, Keiper EA, Johnson AG, Martin J, Goldstein BJ, Shi Y. Human epicardial adipose tissue is a source of inflammatory mediators. Circulation. 2003; 108:2460–2466.
9. Iacobellis G, Pistilli D, Gucciardo M, Leonetti F, Miraldi F, Brancaccio G, Gallo P, di Gioia CR. Adiponectin expression in human epicardial adipose tissue in vivo is lower in patients with coronary artery disease. Cytokine. 2005; 29:251–255.
10. Iacobellis G, di Gioia CR, Cotesta D, Petramala L, Travaglini C, De Santis V, Vitale D, Tritapepe L, Letizia C. Epicardial adipose tissue adiponectin expression is related to intracoronary adiponectin levels. Horm Metab Res. 2009; 41:227–231.
11. Sironi AM, Gastaldelli A, Mari A, Ciociaro D, Positano V, Buzzigoli E, Ghione S, Turchi S, Lombardi M, Ferrannini E. Visceral fat in hypertension: influence on insulin resistance and beta-cell function. Hypertension. 2004; 44:127–133.
12. Taguchi R, Takasu J, Itani Y, Yamamoto R, Yokoyama K, Watanabe S, Masuda Y. Pericardial fat accumulation in men as a risk factor for coronary artery disease. Atherosclerosis. 2001; 157:203–209.
13. Iacobellis G, Assael F, Ribaudo MC, Zappaterreno A, Alessi G, Di Mario U, Leonetti F. Epicardial fat from echocardiography: a new method for visceral adipose tissue prediction. Obes Res. 2003; 11:304–310.
14. Iacobellis G, Ribaudo MC, Assael F, Vecci E, Tiberti C, Zappaterreno A, Di Mario U, Leonetti F. Echocardiographic epicardial adipose tissue is related to anthropometric and clinical parameters of metabolic syndrome: a new indicator of cardiovascular risk. J Clin Endocrinol Metab. 2003; 88:5163–5168.
15. Park EM, Choi JH, Shin IS, Yun KH, Yoo NJ, Oh SK, Kim NH, Jeong JW. Echocaridographic epicardial fat thickness on short term prognosis in patients with acute coronary sydrome. J Cardiovasc Ultrasound. 2008; 16:42–47.
16. Malavazos AE, Ermetici F, Cereda E, Coman C, Locati M, Morricone L, Corsi MM, Ambrosi B. Epicardial fat thickness: relationship with plasma visfatin and plasminogen activator inhibitor-1 levels in visceral obesity. Nutr Metab Cardiovasc Dis. 2008; 18:523–530.
17. Malavazos AE, Ermetici F, Coman C, Corsi MM, Morricone L, Ambrosi B. Influence of epicardial adipose tissue and adipocytokine levels on cardiac abnormalities in visceral obesity. Int J Cardiol. 2007; 121:132–134.
18. Sacks HS, Fain JN. Human epicardial adipose tissue: a review. Am Heart J. 2007; 153:907–917.
19. Iacobellis G, Willens HJ, Barbaro G, Sharma AM. Threshold values of high-risk echocardiographic epicardial fat thickness. Obesity (Silver Spring). 2008; 16:887–892.
Fig. 1.
Echocardiographic measurement of epicardial adipose tissue and mediastinal adipose tissue. EAT: epicardial adipose tissue, MAT: mediastinal adipose tissue.
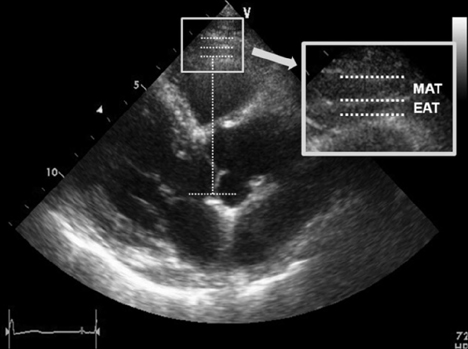
Fig. 2.
Correlation between serum adiponectin level and epicaridal adipose tissue according to gender. EAT: epicardial adipose tissue.
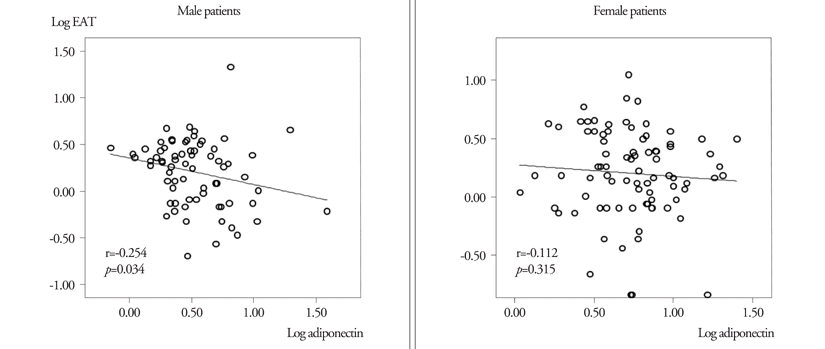
Fig. 3.
Cardiac adipose tissue and serum adiponectin level according to the severity of coronary artery disease. *p<0.05.
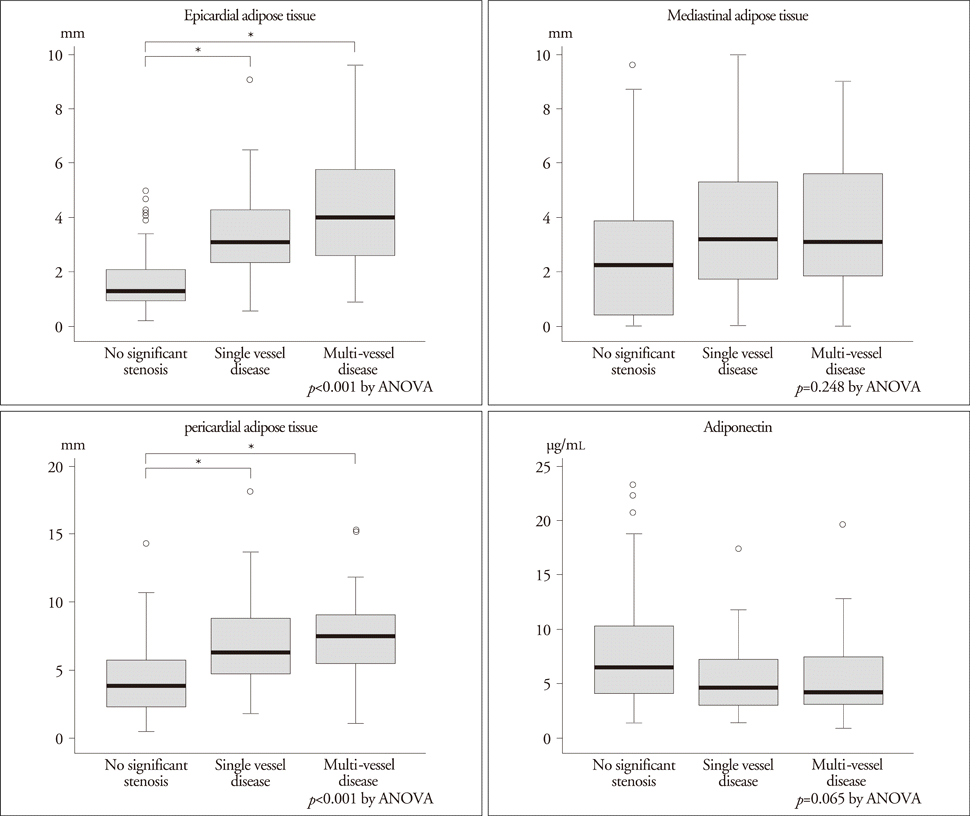
Table 1.
Baseline characteristics
Table 2.
Correlation between the cardiac adipose tissue thickness and clinical variables
| Variables |
Epicardial adipose tissue |
Mediastinal adipose tissue |
Pericardial adipose tissue |
|||
|---|---|---|---|---|---|---|
| r | p | r | p | r | p | |
| Age | 0.225 | 0.005* | 0.099 | 0.224 | 0.210 | 0.009* |
| BMI | 0.012 | 0.882 | 0.185 | 0.023† | 0.183 | 0.024† |
| baPWV | 0.045 | 0.502 | -0.044 | 0.634 | 0.003 | 0.975 |
| WBC count | 0.089 | 0.275 | -0.003 | 0.974 | 0.049 | 0.545 |
| Total cholesterol | 0.125 | 0.124 | 0.075 | 0.354 | 0.126 | 0.120 |
| HDL cholesterol | -0.146 | 0.072 | 0.066 | 0.417 | -0.024 | 0.769 |
| Homocysteine | 0.289 | 0.001* | 0.025 | 0.769 | 0.221 | 0.015† |
| Glucose | 0.167 | 0.042† | 0.011 | 0.895 | 0.112 | 0.172 |
| hsCRP | 0.115 | 0.160 | 0.020 | 0.809 | 0.111 | 0.171 |
| Fibrinogen | 0.218 | 0.009* | 0.057 | 0.497 | 0.203 | 0.015† |
| Adiponectin | -0.194 | 0.016† | 0.107 | 0.188 | -0.025 | 0.762 |
Table 3.
Multiple regression analysis for prediction of the presence of significant coronary artery disease
 XML Download