

 PDF
PDF ePub
ePub Citation
 Print
Print


Abstract
This study was designed to investigate the amount of free sugar according to each beverage category in coffee and beverage stores. The groups were categorized as 15 groups based on the kind of beverage material. The beverage groups contributing to total sugar per 100 mL were milk + syrup or powder, hot (12.9 g), ade (12.6 g), milk + syrup or powder + crushed ice (11.9 g), and espresso shot + milk + syrup + crushed ice (11.4 g). The beverage groups contributing to free sugar per 100 mL were ade (12.6 g), milk + syrup or powder + crushed ice (10.8 g), espresso shot + milk + syrup + crushed ice (10.3 g), and milk + syrup or powder, hot (9.7 g). The beverage groups contributing to total sugar (energy) per portion size were milk + syrup or powder + crushed ice 56.6 g (332.3 kcal), espresso shot + milk + syrup + crushed ice 49.3 g (333.4 kcal), milk + syrup or powder, hot 46.3 g (372.1 kcal), and milk + syrup or powder, ice 38.1 g (325.9 kcal). The beverage groups contributing to free sugar per portion size were milk + syrup or powder + crushed ice 51.2 g, espresso shot + milk + syrup + crushed ice 44.9 g, ade 37.1 g, milk + syrup or powder, hot 34.6 g, and milk + syrup or powder, ice 30.1 g. The percent of average free sugar per portion size of the WHO recommendation (free sugars <10% of total energy; <50 g/2,000 kcal) was milk + syrup or powder + crushed ice 102.4%, espresso shot + milk + syrup + crushed ice 89.8%, ade 74.1%, and milk + syrup or powder, hot 69.2%. The proportion of beverage in excess of WHO recommendation per portion size was 14.6% in espresso shot + milk + syrup + crushed ice, 22.7% in ade, and 10.9% in milk + syrup or powder, hot. Therefore, in coffee and beverage stores, menu development with reduced sugar content is needed, and nutrition information should be provided through sugar nutrition labeling.
Figures and Tables
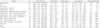
Fig. 1
Distribution of free sugar contents of beverages according to beverage stores within each beverage category. A: Espresso Shot + Milk + Syrup or power, Hot. B: Espresso Shot + Milk + Syrup or power, Ice. C: Espresso Shot + Milk + Syrup + Crushed ice. D: Milk + Syrup or power, Hot. E: Milk + Syrup or power, Ice. F: Milk + Syrup or power + Crushed ice. G: Ice tea.
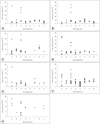
Fig. 2
The percent of mean free sugar amount of more than 50 g per portion size according to ingredients of beverages and being served hot or cold. E: Espresso Shot, T: Tea, T + M: Tea + Milk, E + M, H: Espresso Shot + Milk, Hot, E + M, I: Espresso Shot + Milk, Ice, E + W (IC): Espresso Shot + Whipped cream or Ice cream, E + M + S (P), H: Espresso Shot + Milk + Syrup or powder, Hot, E + M + S (P), I: Espresso Shot + Milk + Syrup or powder, Ice, E + M + S + CI: Espresso Shot + Milk + Syrup + Crushed ice, M + S(P), H: Milk + Syrup or powder, Hot, M + S (P), I: Milk + Syrup or powder, Ice, M + S (P) + CI: Milk + Syrup or powder + Crushed Ice, FJ: Fruit juice, A: Ade, IT: Ice tea.
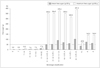
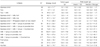
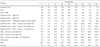
Table 3
The amount of energy, total sugar and free sugar per portion size of beverage
Total sugar: sum of monosaccharides and disaccharides. Free sugar: all monosaccharides and disaccharides added to foods by the manufacturer, cook or consumer, plus sugars naturally present in honey, syrups and fruit juices. 1) N: beverage number 2) Mean ± SD (Range) 3) The percent of mean free sugar amount of the recommendation for free sugars (<10% of total energy; 50 g/2,000 kcal) of the joint WHO/FAO Expert Consultation 4) The percent of maximum free sugar of the recommendation for free sugars (<10% of total energy; 50 g/2,000 kcal) of the joint WHO/FAO Expert Consultation
References
1. Jung YW. A study on the factors of customer satisfaction and customer loyalty in coffee houses. Korean J Culinary Res. 2006; 12(4):1–17.
2. Ministry of Health and Welfare, Korea Centers for Disease Control and Prevention. Korea Health Statistics 2011: Korea National Health and Nutrition Examination Survey (KNHANES V-2). Cheongwon: Korea Centers for Disease Control and Prevention;2012. p. 41. p. 279. p. 338.
3. Ministry of food and drug safety. The report of sugar intake 2008-2011. Cheongwon: 2013.
4. Nishida C, Uauy R, Kumanyika S, Shetty P. The joint WHO/FAO expert consultation on diet, nutrition and the prevention of chronic diseases: process, product and policy implications. Public Health Nutr. 2004; 7(1A):245–250.

5. Cho S, Kim WK. Sugar intakes and metabolic syndrome. Korean J Nutr. 2007; 40:Suppl. 39–49.
6. Havel PJ. Dietary fructose: implications for dysregulation of energy homeostasis and lipid/carbohydrate metabolism. Nutr Rev. 2005; 63(5):133–157.
7. Bray GA, Nielsen SJ, Popkin BM. Consumption of high-fructose corn syrup in beverages may play a role in the epidemic of obesity. Am J Clin Nutr. 2004; 79(4):537–543.
8. Schulze MB, Manson JE, Ludwig DS, Colditz GA, Stampfer MJ, Willett WC, Hu FB. Sugar-sweetened beverages, weight gain, and incidence of type 2 diabetes in young and middle-aged women. JAMA. 2004; 292(8):927–934.
9. Malik VS, Schulze MB, Hu FB. Intake of sugar-sweetened beverages and weight gain: a systematic review. Am J Clin Nutr. 2006; 84(2):274–288.
10. Chung CE. Association of total sugar intakes and metabolic syndrome from Korean National Health and Nutrition Examination Survey 2001-2002. Korean J Nutr. 2007; 40:Suppl. 29–38.
11. Bae YJ, Kim MH. A study evaluating nutrient intake and diet quality in female college students according to coffee consumption. J Korean Diet Assoc. 2009; 15(2):128–138.
12. Kim SH, Kim KY, Kim HJ, Lee SS, Kim SY. A survey on added sugar intakes from general snacks by adolescents in Daejeon and development of educational materials for guiding their optimal intakes of sugars. Korean J Hum Ecol. 2008; 11(1):5–19.
13. Chang NS, Kwon OR, Kim SH, Kim WK, Kim HY, Shin DS, Lee HS, Chang MJ, Chung HK. Nutrition and health for women. Paju: Kyomoonsa;2011. p. 127–135.
14. Lim YH, Kim SH. Survey on consumption of coffee beverages and energy contribution ratios of coffee beverages and accompanying snacks by college students in Daejeon city and Chungnam province in Korea. Korean J Food Cult. 2012; 27(3):240–250.
15. DiMeglio DP, Mattes RD. Liquid versus solid carbohydrate: effects on food intake and body weight. Int J Obes Relat Metab Disord. 2000; 24(6):794–800.
16. The Korean Nutrition Society. Dietary reference intakes for Koreans. 1st revision. Seoul: The Korean Nutrition Society;2010. p. 70.
17. U.S. Department of Agriculture, Agricultural Research Service. USDA National Nutrient Database for Standard Reference. Washington, D.C.: U.S. Department of Agriculture, Agricultural Research Service;2010. cited 2012 Aug 6. Available from: http://www.ars.usda.gov/nutrientdata.
18. Yeon JY, Bae YJ, Kim MH, Jo HK, Kim EY, Lee JS, Kim MH. Evaluation of nutrient intake and bone status of female college students according to the calorie consumption from coffee containing beverage. Korean J Food Nutr. 2009; 22(3):430–442.
19. Mosdøl A, Christensen B, Retterstøl L, Thelle DS. Induced changes in the consumption of coffee alter ad libitum dietary intake and physical activity level. Br J Nutr. 2002; 87(3):261–266.
20. Van Wymelbeke V, Béridot-Thérond ME, de La Guéronnière V, Fantino M. Influence of repeated consumption of beverages containing sucrose or intense sweeteners on food intake. Eur J Clin Nutr. 2004; 58(1):154–161.
21. Blum JW, Jacobsen DJ, Donnelly JE. Beverage consumption patterns in elementary school aged children across a two-year period. J Am Coll Nutr. 2005; 24(2):93–98.
22. Kim JH. The improvement plan and status on children's favorite foods such as carbonated drinks etc. Food Ind Nutr. 2006; 11(2):55–58.
 XML Download