

 PDF
PDF ePub
ePub Citation
 Print
Print


Introduction
According to The Korea National Health and Nutrition Examination Survey (KNHANES), the obesity rate among adult Korean was estimated at 36.8% for men and 24.8% for women [1]. Especially women, from ages 40 and above, have a rapid increase in obesity rate, 46% as well as simultaneously high rates of hypertension and dyslipidemia, which suggests that obesity is maybe associated with these aforementioned health problems [1].
Although obesity is related with the developments of chronic diseases such as cardiovascular diseases (CVD) and diabetes, not all obese people have obesity-related complications or diseases. Several studies reported that obese people with normal blood lipid profiles, glucose tolerance, or blood pressure, possess health risk that is as low as that of the normal weight people [2,3,4].
Dyslipidemia is defined as a condition of high blood cholesterol and triglycerides levels that can increase the risk of heart disease, stroke, and other health problems [8]. Obesity with dyslipidemia has been shown to increase the risk of developing CVD [5,6,7]. However, even after accounting for blood lipid profiles and blood pressure that results from dyslipidemia in obese subjects, studies reported significant association between body fat and CVDs.
In the past, adipose tissue was simply seen as a storage organ, but nowadays it has been revealed that adipose tissue not only serves as energy reserves but also as endocrine organ secreting important adipokines and cytokines [9]. Among adipokines, leptin and adiponectin are major plasma proteins secreted by adipocytes, and the plasma concentrations of leptin are markedly increased while adiponectin is decreased in obese population [9]. Several studies reported that adipokines, in addition to its angiogenic properties, increases the generation and accumulation of free radicals, playing an important role for developing atherosclerosis [10,11,12].
Oxidative stress is characterized by depleting antioxidant production in body, which plays a role in preventing chronic diseases in obese people [13]. Antioxidant system in body consists of antioxidant enzymes and antioxidant vitamins. Antioxidants enzymes include catalase, superoxide dismutase, and glutathione peroxidase which may directly/indirectly contributes to defense against the reactive oxygen species (ROS). Antioxidant vitamins, such as vitamin A, vitamin E, and vitamin C, are the non-enzymatic antioxidants that serve as scavengers of ROS [14].
Though oxidative/antioxidative status in obese people is identifiable no comparison about obesity with or without dyslipidemia and oxidative stress has been made. The aims of the present study were, 1) to determine whether overall health and dietary problems occur, and to what degree, at obesity with dyslipidemia and, 2) to assess the oxidative stress and antioxidants balance in the two group subjects.
SUBJECTS AND METHODS
Study design and subjects
Recruitment of subjects for this study, through the regional newspapers and hospital advertisements, was carried out at the university hospital in Korea. Subjects were selected from females who were in the age group of 20-55 years, and whose BMI was 23 or greater. None of the subjects were taking antioxidant vitamin supplements or lipid-lowering drugs. Subjects who had any chronic diseases, or who were pregnant, were excluded. The selected overweight and obese females (BMI ≥ 23) participated in the next phases of the study, such as anthropometry, biochemical test, and diet survey. This study (EMCIRB-11-116) was approved by the institutional review boards of the hospital (Seoul, Korea), in accordance with the Declaration of Helsinki. Written consent was obtained from all individuals after the purpose and nature of the study had been explained.
Anthropometric measurements
Height was measured by using a portable stadiometer to the nearest 0.1 cm by a nurse. While the subjects were standing, Waist and hip circumference were measured. Waist circumference (WC) was measured on the midway between rib cage and superior border of the iliac crest after complete expiration by using a measuring tape. Hip circumference (HC) was measured at the point yielding the maximum circumference over the hips using a measuring tape to the nearest 1 cm. Waist-hip ratio was calculated, dividing WC/HC to determine abdominal obesity. Body weight and body fat (%) were measured through the use of bioelectrical impedance analysis (In-body 3.0, Biospace, Seoul, Korea). BMI was also calculated by using weight and height data [15].
Biochemical tests
Participants were invited to attend the hospital after an overnight fast. Serum and plasma was obtained from blood samples after centrifugation (1,000 g for 10 min at 4℃). Cholesterol, triglyceride, LDL-cholesterol, and HDL-cholesterol were also determined by the instrument of automatic blood analysis (ADVIA2120, SIEMENS, Washington D.C. USA). Cholesterol/HDL-cholesterol, HDL-cholesterol/LDL-cholesterol was calculated by the known formulas [16]. General blood biochemical markers were also assayed. Hemoglobin, Albumin, Creatinine, BUN (blood urea nitrogen), GOT (glutamic oxalate transaminase), GPT (glutamic pyruvate transaminase), r-GTP (gamma-glutamyl transpeptidase), and glucose were determined by the automatic blood analyzer (ADVIA2120, SIEMENS, Washington D.C. USA). Plasma samples for oxidative stress and antioxidants measurements were kept at -20℃ before analysis.
Subjects, who met the criteria of BMI ≥ 23, total cholesterol ≥ 200 mg/dL, LDL cholesterol ≥ 130 mg/dL, and TG ≥ 110 mg/dL, were categorized as obese with dyslipidemia group, and in otherwise, categorized as the control group.
Dietary intake survey from 24 hour Dietary recall
Each subjects was required to report on all the foods and drinks consumed during the previous 24 hours for 2 days (1 weekday, 1 weekend), and recorded by a trained dietitian. In order to improve the amount of dietary intake, food models and photographic manual of food portion size were used. The dietary intake data was analyzed using the software (Can Pro 4.0) developed by Korean Nutrition Association. After calculating energy and nutrients intakes, average intake was compared to the dietary reference intakes for Korean (KDRIs) and expressed as a percent KDRIs.
Blood lipid peroxidation Assay
Lipid peroxide level in plasma was determined using thiobarbituic acid (TBA) as described previously [17]. Briefly, to 100 µL of plasma, 100 µL of 8.1% (w/v) sodium dodecylsulphate, 750 µL of 20% (v/v) acetic acid (pH 3.5), 750 µL of 0.8% TBA, and water were added to make a total volume of 2 mL. The mixture was boiled for 30 min in water bath and then cooled at room temperature. Five hundred µL of cold water and 2.5 mL of butanol and pyridine [15:1 (v/v)] were added, vortexed, and then centrifuged. After centrifugation, the supernatants were measured for absorbance at 532 nm using a spectrophotometer. Standard curve using various concentrations of 1,1,3,3 - tetra ethoxy propane (TEP) were used for calculation.
Blood total antioxidant capacity Assay
The total antioxidant capacity (TAC) was measured using an antioxidant assay kit (Sigma, St Louise, Mo, USA) [18]. Trolox was used as an antioxidant standard to calculate Trolox equivalent antioxidant capacity; absorbance readings were taken at 520 nm.
Blood antioxidative enzymes Assay
Unless otherwise mentioned, all the chemicals were of analytical grade and purchased through Sigma (St. Louis, MO, USA). Catalase activity was determined by measuring the amount of decrease in absorption at 240 nm in a reaction mixture containing phosphate buffer (0.1 mM, pH 7.0) and H2O2 (8.8 mM) according to the study of Aebi H [19]. Superoxide dismutase (SOD) was measured with a SOD determination kit (Sigma, MO, USA) [20]. GSH-Px activity with H2O2 as a substrate was measured according to Paglia and Valentine [21]. The enzyme reaction in a tube containing NADPH, reduced glutathione (GSH), sodium azide, and glutathione reductase was initiated by the addition of H2O2, and change in absorbance was monitored at 340 nm.
Blood antioxidative vitamins analysis
Reagents and Chemicals
Standards of retinol, α-tocopherol, β-carotene, lycopene, lutein, and tocopheryl acetate were purchased from Sigma (St. Louis, MO, USA). HPLC gradient grade methanol, ethanol, acetonitrile, metylene chloride, and n-hexane were obtained from Merck (Merck KGaA, Darmstadt, Germany).
Standards Preparation
Standard stock solutions of retinol (20 mg/L), α-tocopherol (1 g/L), and α-tocopheryl acetate (1 g/L) were prepared in ethanol. Tocopherol acetate was used as an internal standard. Stock solutions of β-carotene (20 mg/L), lycopene (20 mg/L), lutein (20 mg/L) were prepared in n-hexane. All stock solutions were stored at -20℃. Work solutions of individual vitamins and internal standards were prepared daily and the concentrations were verified spectrophotometrically using molar absorptions [22,23].
HPLC Instrumentation
The concentration of retinol, α-tocopherol, β-carotene, lycopene, and lutein were determined by using HPLC [22,23]. Chromatographic analysis was conducted using Waters HPLC (Milford, Massachusetts, USA) with a Waters 1,525 binary HPLC pump consisting of a Waters 2,487 dual absorbance detector. Reverse-phase HPLC equipped with SunFire C18 Column, 4.6 × 150 mm, 5 µM (Sigma, St. Louis, USA) was used for the analysis. The UV detector was set at 450 nm for carotenoids and 290 nm for retinol and α-tocopherol. The mobile phase for carotenoids consisted of acetnitrile: metylene chloride: methanol (7:2:1 by volume). The mobile phase for retinol and α-tocopherol were consisted of 100% methanol. Injection volume through HPLC was 20 µL and the flow rate was set at 1.5 mL/min. Data acquisition was completed in 30 minutes.
Sample analysis procedure
Briefly, 100 µL of the plasma sample, 10 µL of internal standard, 150 µL of ethanol were mixed and vortexed for 2 min. Hexane, 500 µL, was added, vortexed for 5 min, and then centrifuged (22,000 × g, 3 min, 4℃). This procedure was repeated twice and then the upper hexane layer was collected into 5 - mL amber glass tubes. Combined hexane extracts were dried under nitrogen. The dried residue was re-dissolved in 50 µL of mobile phase and vortexed for 60s. The sample was then filtered through a nylon filter (pore size 0.20 µM, 4 mm diameter, Supelco, Bellefonte, PA, USA) before injection.
Blood adiponectin and leptin
Adiponectin and leptin were determined separately by RayBio human enzyme immunoassay Kits (RayBiotech, Inc, Georgia. USA) [22].
Results
The anthropometric characteristics of the subjects
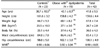
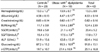
In table 1, the mean value of BMI in all subjects was 26.7 ± 2.8 and mean of body fat (%) was 36.0 ± 4.3 (%). There were no significant differences for age, BMI, and body fat (%) between two groups, although BMI and body fat (%) were a little higher in the obese with dyslipidemia than in the control group. The mean value of WHR was 0.90 ± 0.05, which is higher than normal level, WHR < 0.85. No differences were observed for waist size and WHR between two groups.
Blood lipid concentrations of the subjects
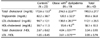
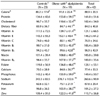
There were significantly higher levels of total cholesterol (P < 0.001), triglyceride (P < 0.05), and LDL-cholesterol (P < 0.001) in obese with dyslipidemia compared to those of the control group (Table 2). In obese with dyslipidemia, significantly high ratio of total cholesterol/HDL-cholesterol (P < 0.001) and LDL-cholesterol/HDL-Cholesterol (P < 0.001) were shown.
Blood biochemical analysis of the subjects
Table 3 describes the results of the blood biochemical analysis in subjects. The concentrations of plasma hemoglobin, albumin, and creatine between two groups were similar. Blood SGOT and SGPT level were higher in obese with dyslipidemia than in the control group, but no statistical significance was shown. Blood alkaline phosphatase (ALP) level was statistically different between the two groups; 63.8 ± 13.5 U/mL in obese with dyslipidemia and 51.9 ± 15.6 U/mL in the control group (P < 0.05). Obese with dyslipidemia also seemed to have higher levels of glucose and r-glutammyl transpeptidase (GTP), but the differences were not statistically significant.
Daily nutrient intakes of the subjects
Table 4 shows that all subjects were satisfied with the level of KDRIs for all nutrients with the exception of potassium. The mean sodium intake among the obese was twice percentage comparisons to the KDRI. Comparing the dietary consumptions between two groups, obese with dyslipidemia group consumed higher level of mean percentage comparisons to the KDRI in all nutrients surveyed, but the differences were not statistically significant. The obese with dyslipidemia seemed to have higher mean percentage comparisons to the KDRI of cholesterol, but no significant difference between two groups was shown.
Blood lipid peroxidation and antioxidative enzyme activities of the subjects
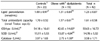
The oxidant and antioxidant status of subjects is shown at Table 5. Plasma thiobarbituric acid reactive substances (TBARS) concentration, as a marker of lipid peroxidation, was determined. A slightly higher concentration of TBARS, without statistical significance, was found in obese with dyslipidemia than in the control group. The plasma total antioxidant capacity (TAC) was lower in obese group with dyslipidemia, but the group difference was not statistically significant. Among the antioxidant enzymes, the concentrations of GSH-Px and catalase were significantly lower in obese group with dyslipidemia than in the control group; The GSH-Px activity (U/mL) was 54.18 ± 16.61 for obese group with dyslipidemia and 42.65 ± 14.60 for the control group (P < 0.05). The catalase activity (U/mL) was 2.73 ± 1.59 for obese group with dyslipidemia and 3.97 ± 1.65 for the control group (P < 0.05). There was no significant differences of the SOD activity between the two groups.
Blood antioxidatative vitamins concentration of the subjects
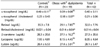
The concentrations of antioxidative vitamins in subjects are present in Table 6. The obese with dyslipidemia had lower levels of plasma α-tocopherol and retinol than the control group, but this was not statistically significant. However, when those values were adjusted with plasma total cholesterol, adjusted α-tocopherol level was significantly lower in obese with dyslipidemia than in the control group (P < 0.05). Adjusted retinol level of obese with dyslipidemia was also significantly lower than that of the control group (P < 0.05). No significant differences of plasma concentrations of β-carotene, lycopene, and lutein between two groups were found.
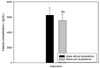
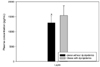
Blood Adiponectin and leptin concentration of the subjects
The plasma concentrations of adiponectin and leptin are described in Fig. 1 and Fig. 2 respectively. The plasma concentration of leptin was significantly higher in obese with dyslipidemia (15,406 ± 3,513 pg/mL) than in the control group (12,943 ± 1810 pg/mL) (P < 0.05). The levels of plasma adiponectin in obese with dyslipidemia (5,560.5 ± 741.3 ng/mL) was lower than that in the control group (6,256.2 ± 979.9 ng/mL), but the difference was not statistically significant.
Discussion
Excessive weight can result in many serious health problems. Lipid abnormalities have been reported in obese adults and even in obese children and adolescents [9,10,11]. However, not all obese people have blood lipid abnormalities. It is believed that adipocyte dysfunction occurs as a result of excess fat accumulation in the body, which cause abnormal secretion of adipokines, herby contributing to the pathogenesis of obesity metabolic abnormalities or diseases. Thus, we tried to compare the plasma adipokines and antioxidative systems expressed by adipokines between obese with dyslipidemia and obese without dyslipidemia.
Study subjects were characterized as the females whose BMI is 23 or greater. In Korea, overweight is defined as the BMI value between 23 and 24.9 and obese as the value of 25 or greater [24]. WHO Expert Consultation suggested lower BMIs cut-off point at 23 for overweight in Asian population, in comparison to western BMI cut-off points for overweight (BMI ≥ 23 kg/m2) [25]. A study reported that this lowered BMI as a cut-off point for overweight in Asian population was suitable because this BMI value is significantly associated with risks of chronic diseases [26].
The diagnosis of metabolic syndrome for Korean includes blood TG level of 150 mg/dL or higher, as one of several criteria [27]. The mean blood TG levels of this study subjects were 99 ± 56.8 mg/dL and only 5 of them (11%) were in the range of TG 150 mg/dL or higher. Nevertheless, the subjects with the TG value of 110 mg/dL or greater (45%) tended to have abnormal total cholesterol and LDL levels. Thus this study applied 110 mg/dL of blood TG levels as the cut-off point for determining dyslipidemia. KNHANS data showed that mean TG values were 100 mg/dL in adult female and 115 mg/dL in males respectively [1].
The measurements of LDL-C/HDL-C ratio and TC/HDL-C ratio are often used as markers of estimate CHD risk, especially ischemic heart disease (IHD) [32]. In this study, obese females with dyslipidemia showed significantly higher values of TC/HDL-C ratio (4.04 ± 0.91) than the control group (2.67 ± 0.62), which suggests that obese females with dyslipidemia have high risk of CHD risk. LDL/HDL ratio, as another index for CHD risk was also significantly higher in obese with dyslipidemia than in the control group, but ratio in both group were within the normal range. It has been suggested that atherogenic metabolic disturbances may not always be adequately reflected by the variation in the LDL-C/HDL-C ratio because VLDL contained more cholesterol and the relative cholesterol content of VLDL increased across TG quintiles [28,29]. Instead, TC/HDL-C ratio has been reported as a better indicator of the presence of atherogenic dyslipidemia [28].
Blood level of alkaline phosphatase (ALP) was significantly higher in obese with dyslipidemia than in the control group. ALP is a hydrolase enzyme responsible for removing phosphate groups and it is mainly derived from the liver, bones, intestines, kidneys, and leukocytes [30]. Several studies have suggested that high serum ALP levels increased vascular calcification and thus further increased risk of cardiovascular disease (CVD) [30,31]. The association between ALP and CVD may be linked with inflammation mechanism, due to the incapability of dephosphorylating potentially deleterious molecules [31]. Thus an increased ALP level in obesity with dyslipidemia may cause an increase in oxidative stress, and further inflammation, and so careful monitoring of ALP in obese population is maybe needed.
Regarding dietary recall data, all obese females in this study had high consumption of sodium but low consumption of potassium, compared to the mean percentage to the KDRIs of those nutrients. Overconsumption of sodium intake is more strongly associated with metabolic syndromes, especially hypertension, in obese people than normal weight people [32]. The consumption of potassium in the diet has been found to reduce the harmful effects of dietary salt in humans, lowering blood pressure and improving hypertension control [33,34]. Thus careful monitoring of sodium and potassium intake is especially necessary for obese people to reduce the health risk.
Free radicals are type of oxygen-related molecules with high levels of oxidizing power, damaging body tissues. Adipose tissue possesses relatively high levels of antioxidant defensive enzymes for managing high ROS production [7]. However, if the amount of oxygen-free radicals created in adipose tissue surpasses the amount of antioxidant capacities, oxidative stress increases. In this study, the antioxidant enzymes activities, such as GSH-Px and catalase were significantly less in the obese with dyslipidemia group. Studies have reported low levels of antioxidant enzymes in obese individuals [35,36,37]. Thus this result indicates that a decrease in antioxidant enzymes may lead to enhanced oxidative stress in the adipose tissue of obese subjects.
The blood retinol and tocopherol in obese with dyslipidemia, after adjusted with total blood cholesterol, were significantly lower than those in the control group. Mehmetoglu et al. [38] reported that only after vitamin A level adjusted with cholesterol level, blood retinol concentration in obese group was significantly lower than the healthy weight group. Vitamin A is especially emerging as a factor of interest in relation to cardiovascular disease [39,40]. A low plasma retinol was associated with about a three-time increase in the risk of cardiovascular-related diseases [40]. The supplementation with vitamin A in obesity has been found to be beneficial to a number of inflammatory conditions [41,42].
In contrast, leptin in this study was significantly higher in obese with dyslipidemia than in the control group. Researchers have found that leptin not only affects appetite, but also produces reactive oxygen species that induces functional damage in endothelial cells [43,44]. Animal studies suggested that increased leptin level in obese rat, through induction of iNOS and NADPH oxidase, caused the peroxynitrite-mediated oxidative stress [45]. Our study results of decreased antioxidants and the increased leptin support our hypothesis that obesity with dyslipidemia will cause lower antioxidant protection and increased oxidative stress than obesity without dyslipidemia.
This study showed no significant differences for age, BMI, and body fat (%) between two groups (Table 1), but significantly abnormal blood lipids profiles in obese with dyslipidemia group compared to the control group. In addition, there were no significant differences in dietary intakes between two groups, and thus the results antioxidants-study seem unlikely to be dietary effect. The results of this study are may possibly dependent on the status of dyslipidemia, not obesity degree. Our study is limited by the small size of the study population, and thus more studies with large sample size are needed to clear our findings. In addition, although it is enhanced by oxidant and several antioxidants measured, another limitation of this study is not having measured various markers of lipid peroxidation or inflammation. The present study however, provides some evidence suggesting that dyslipidermia in obesity are related with abnormal secretions of adipokines and depletion of antioxidative system, the two factors which are associated with increased CHD risk.
In conclusion, obese female with dyslipidemia in this study showed lower antioxidant capacities, such as depleted levels of GSH-PX and catalase, retinol, and tocopherol, and a higher concentration of blood leptin, than obese female who have normal lipid profiles. This imbalance between pro inflammatory adipocytokines and depleted antioxidant status are related with higher CHD risk in obese females with dyslipidemia. Thus to prevent such risks, it is most important to maintain a proper weight through a balanced diet, especially proper sodium and potassium intakes. In addition, proper intakes of antioxidant nutrients will be helpful in maintaining health in obese population with dyslipidemia.
 XML Download