

 PDF
PDF ePub
ePub Citation
 Print
Print


Introduction
Nuts and seeds are good sources of lipids and protein [1]. In addition, nuts and seeds are widely used for their oils as well as in butters and cookies, and they are consumed directly as food due to their characteristic flavors [2]. Nuts and seeds are lucrative and have anti-aging effects due to their abundance of in vitamins B and E [2,3]. Among the fatty acids commonly found in nuts and seeds, 70-80% are essential fatty acids, which are components of the plasma membrane and contain a lipoprotein found in brain cells known as lecithin. Therefore, nuts and seeds are excellent nutrients for growing children and good snacks for adults [2].
Recently, it was found that changes in dietary patterns and improvements in quality of life are associated with incidence of obesity, cardiovascular disease (CVD), diabetes, cancer, and other detrimental diseases [4,5]. These diseases are related to increased levels of plasma lipids, thrombosis, oxidation of LDL-cholesterol, and formation of free radicals [6]. Therefore, many studies have been conducted on the anti-thrombotic and anti-oxidant effects of food on LDL-cholesterol [7]. Results of studies on nuts and seeds have revealed that they contain polyphenols, which have anti-oxidant effects on lipids and LDL-cholesterol, inhibit platelet coagulation, and show preventive effects against atherosclerosis, hypertension, and CVD [7]. Nuts and seeds have also been shown to have anti-cancer, anti-inflammatory, anti-mutation, anti-virus, and anti-allergic effects [7-9].
Increase in population and urbanization along with the development of industry directly or indirectly impacts the environment via contamination by lead (Pb), mercury (Hg), cadmium (Cd), aluminium (Al), arsenic (As), and beryllium (Be), thereby leading to public health problems [10]. Pb, Hg, and Cd can indicate contamination [11], and they are useful for evaluating geographical differences since they are responsive to lifestyle, geographical conditions, and the natural ecosystem [12]. Accordingly, it is necessary to periodically study the contamination of nuts and seeds by these compounds to ensure there are no risks to public health.
The purpose of this study was to analyze and assess the stability of nutrients and heavy metals in nuts and seeds that are widely distributed and consumed.
Materials and Methods
Materials
The most popular nuts and seeds are almonds (India), walnuts (USA), cashew nuts (India), dried figs (Iran), sunflower seeds (China), pumpkin seeds (China), pine nuts (Korea), wheat nuts (USA), macadamia nuts (Australia), peanuts (Korea), and pistachio nuts (USA). These seeds were collected in Seoul, Korea from October, 2008 to June, 2010. All full-fat seeds were placed in the desired labeled containers, which were flushed several times with nitrogen gas; the lids were tightly placed on the containers, and the samples were stored at -20℃ until further use [3].
General ingredient analysis
Energy and Carbohydrates [13]: Energy and carbohydrates were calculated according to the methods described in the Food Code (2008) of Korea.
Moisture (AOAC Official Method 925.40) [3,14]: An accurately weighed sample (~1 g) was placed in an aluminum pan and then dried in a previously heated vacuum oven (Barnstead Lab-Line, Melrose Park, IL; model 3608-5; 95-100℃ and 25 in. of Hg) to a constant weight.
Protein (AOAC Official Method 950.48) [3,14]: The micro-Kjeldahl method was used to determine total protein contents. Briefly, 0.1 g of sample was placed in a micro-Kjeldahl flask. A catalyst (0.42 g of CuSO4 + 9.0 g of K2SO4), a few glass beads (to prevent sample bumping), and 15 ml of concentrated H2SO4 (36 N) were then added to each sample. Next, sample digestion was conducted at 410℃ for 45-75 min until a clear green solution was obtained, which ensured complete oxidation of all organic matter. The digest was then diluted with 50 ml of distilled water, after which a micro-Kjeldahl flask was attached to the distillation unit. Next, 45 ml of 15 N NaOH was added and sample distillation initiated. The released ammonia was collected into a boric acid solution containing methylene blue and methyl red as indicators. Borate anion (proportional to the amount of nitrogen) was then titrated with standardized 0.1 N H2SO4. A reagent blank was run simultaneously and the sample nitrogen content was calculated using the formula.
Protein (%) = total N (%) × appropriate factor for sample. The conversion factors used were 5.18 for almonds, 5.46 for peanuts, and 5.3 for all others.
Lipids (AOAC Official Method 948.22) [3,14]: A known weight of sample (~10 g/thimble) was defatted in a Soxhlet apparatus using petroleum ether (boiling point range = 38.2-54.3℃) as the solvent (flour-to-solvent ratio of 1:10 w/v) for 8 h. Defatted samples were dried overnight (~10-12 h) in a fume hood to remove residual traces of petroleum ether, after which the samples were weighed to calculate lipid content.
Defatted samples were homogenized using a Sorvall blender (speed setting at 6-8) and then stored in plastic screw-capped bottles at -20℃ until further analysis.
Ash (AOAC Official Method 923.03) [14]: Accurately weighed samples (~0.1 g) were placed in a ceramic crucible that had been previously heated and cooled until a constant weight was obtained. The samples were then subjected to ashing in a muffle furnace maintained at 550℃ until a constant final weight for ash was achieved.
Amino acid composition
Total amino acid composition was determined by HPLC (Young-Lin Inc., Korea) using a Waters AccQ-Tag kit. Briefly, accurately weighed samples were hydrolyzed in 200 mg of 6 N HCl 10 ml in the presence of nitrogen (20 h, 110℃). After filtering through a Millipore syringe filter (0.45 µm filter), the samples were concentrated using a rotary vacuum evaporator. Concentrated samples were then dissolved in 1.5 ml of 20 mM HCl and stored in an EP-tube (4℃) after filteration through a 0.2 µm syringe filter. Amino acids were then analyzed by HPLC using a Waters AccQ-Tag kit. The amino acid composition was reported as milligrams of amino acid per 100 g of protein.
Fatty acid composition
Total fatty acid composition was determined by gas chromatography (GC) using an HP-6890 gas chromatograph (Young-Lin, Acme 6000 GC, Korea) coupled with a flame ionization detector. Briefly, 0.1 g of Supelco 37 FAME mix (mixed-fat standard sample) was dissolved in isooctane to give a standard solution with a concentration of 100 mg/ml. Next, 20 mg of fat sample was placed in a 25 ml tube, 2 ml of 0.5 N NaOH/methanol was added, and the sample was boiled for 5 min at 100℃ using a heating block to induce hydrolysis. The sample was then allowed to cool to room temperature, 2 ml of BF3/methanol (14%) and 2 ml of isooctane were added, and the sample was boiled for 5 min. Next, 3 ml of saturated saline solution was added to the reaction mixture, after which the sample was shaken gently for 5 min. The octane layer was then removed and dehydrated by the addition of sodium sulfate anhydride. Finally, the sample was injected into the GC. The GC conditions were as follows:
All data were corrected for recoveries and expressed as a percentage.
Vitamin A and vitamin E composition
Vitamin A content was detected by HPLC according to the method described by Kim [15]. Briefly, total retinol was detected after saponification of retinyl ester. To accomplish this, 1.5 ml of potassium hydroxide (15% KOH in methanol; w/v) was mixed with 1ml of sample and then hydrolyzed at 75℃ for 25 min. Next, 2 ml of petroleum ether was added and the sample centrifuged. The supernatant was then collected, dehydrated with Na2SO4, and centrifuged. The supernatant was removed, washed with sea-sand and 2 ml of petroleum ether, and then evaporated under nitrogen gas. One milliliter of methanol: acetone (1:1; v/v) was added to the sample, after which it was filtered through a 0.45 µm Gelman membrane filter and then evaluated by HPLC (LC-6AD and LC-10AD, Shimadzu, Japan). A column packed with Capcell pack C18 was used to detect vitamin A. The mobile phase consisted of methanol applied at a rate of 1.5 ml/min. An SPD-AV detector at 325 and 450 nm was used to analyze retinol and β-carotene. The values of retinol and β-carotene (Sigma) were compared to a standard curve to determine the amount of vitamin A in the samples. Vitamin A content was calculated by the summation of retinol and β-carotene and expressed as "R.E."
Vitamin E was detected according to the method described by Lee and Lee [16]. Briefly, 0.3 g of sample was added to 25 ml flasks and then dissolved in 0.01% butylated hydroxytoluene (BHT)/hexane solution. This sample was then applied directly to HPLC using a solvent delivery pump (M930; Young-Lin Inc., Korea). The samples were detected using a LC305 detector (Thermo Separation Products Inc., CA, USA). The HPLC system consisted of a LiChrosphere® Diol 100 column (250 × 4 mm i.d., 5 µm) purchased from Merck (Darmstadt, Germany) and a JASCO 807-IT detector (Jasco International Co., Tokyo, Japan) [17]. The excitation wavelength was 290 nm and the emission wavelength was 330 nm. The mobil phase was 1.3% isopropanol in n-hexane, which was applied at 1.0 ml/min. The sample injection volume was 20 µl.
Essential elements and heavy toxic elements composition
In order to determine the concentration of heavy metals, 0.5 g of sediment was digested by microwave irradiation in Teflon vessels using 6 ml of supra-pure concentrated HNO3, 2 ml of H2O2 30% and 2 ml of concentrated HF; HF was removed by the addition of an excess amount of H3BO3 (U.S. EPA Method 3052, 1996). The solution was transferred into a polyethylene volumetric flask and diluted with milliQ water to 100 ml. One milliliter of the solution was then diluted to 10 ml by addition of HNO3. Heavy metal concentrations were measured by inductively coupled plasma mass spectrometry (Perkin Elmer 2100 DV; U.S. EPA Method 6020, 1996). All glass wares and plastic containers were washed with 10% nitric acid solution and rinsed thoroughly with milliQ water [18].
Statistical analysis
The composition values for heavy metal composition were expressed as means ± SD, which were determined using SPSS (version 13.0). One-way ANOVA was employed to compare the mean values of the different nuts and seeds, followed by Duncan's multiple range test when necessary. A P < 0.05 was considered to indicate significance.
Results
General ingredient analysis
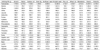
Proximate compositions of the 11 types of nuts and seeds evaluated in this study are shown in Table 1. Energy contents of the pine nuts, walnuts, macadamia nuts, and wheat nuts were 733 mg, 728 mg, 711 mg, and 669 mg per 100 g of sample, respectively. Moisture content ranged from 1.6 mg/100 g (macadamia nuts) to 18.3 mg/100 g (dried figs). Cabohydrate content of dried figs was 70.9 mg/100 g (highest), whereas almonds, cashew nuts, sunflower seeds, wheat nuts, macadamia nuts, and pistachios contained carbohydrate levels from 22.7 mg/100 g to 29.1 mg/100 g. The carbohydrate level of pine nuts was 8.8 mg/100 g (lowest). Protein content of peanuts was 30.5 mg/100 g (highest), whereas that of the dried figs was 4.9 mg/100 g (lowest). Generally, lipid contents of nuts and seeds ranged from 43.2 mg/100 g to 69.8 mg/100 g, whereas that of dried figs was 2.5 mg/100 g (lowest). Ash contents ranged from 1.2 mg/100 g (macadamia nuts) to 5.5 mg/100 g (pumpkin seeds).
Amino acid composition
The amino acid composition data are summarized in Table 2. Among the amino acids, glutamic acid, arginine, glycine, and leucine contents were generally high, whereas histidine and methionine contents were low. Specially, cysteine (1,419.8 mg/100 g) and threonine (708.5 mg/100 g) contents were high in sunflower seed, whereas, alanine (1,621.0 mg/100 g), valine (992.3 mg/100 g), leucine (824.8 mg/100 g), methionine (552.1 mg/100 g), and arginine (4,427.3 mg/100 g) contents were high in Pumpkin seed. In peanut, glycine (1,730.6 mg/100 g), leucine (1,414.0 mg/100 g), proline (1,199.3 mg/100 g), phenylalanine (1,298.2 mg/100 g), serine (1,537.9 mg/100 g), tyrosine (1,024.8 mg/100 g), aspartic acid (2,777.0 mg/100 g), glutamic acid (5,649.5 mg/100 g), lysine (828.6 mg/100 g), and histidine (525.7 mg/100 g) contents were higher.
Hydrophobic amino acids (alanine, glycine, valine, leucine, isoleucine, proline, cysteine, methionine, phenylalanine) dominated the protein compositions of nuts and seeds, ranging from 1,348.6 mg/100 g in dried figs to 10,284.6 mg/100 g in pumpkin seeds. Hydrophilic amino acids (serine, threonine, tyrosine) dominated seed protein compositions ranging from 341.1 mg/100 g in dried figs to 3,008.8 mg/100 g in pumpkin seeds. Acidic amino acids (aspartic acid, glutamic acid) were the next most prominent group of proteins, ranging from 956.1 mg/100 g in dried figs to 8,426.5 mg/100 g in peanuts. Finally, basic amino acids (lysine, arginine, histidine) ranged from 408.6 mg/100 g in dried figs to 4,915.1 mg/100 g in pumpkin seeds.
Fatty acid composition
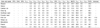
Fatty acid compositions (Table 3) of the 11 nuts and seeds evaluated in this study did not include eicosapentaenoic acid (EPA), docosahexaenoic acid (DHA), or docosapentaenic acid (DPA). The palmitic acid (C16:0) content of pumpkin seeds was 12.6%, which was the highest among the nuts and seeds evaluated in this study. Stearic acid (C18:0) content was highest in cashew nuts (9.3%). The saturated fatty acid (SFA) (C12:0 + C14:0 + C18:0 + C20:0 + C22:0 + C24:0) contents of peanuts, cashew nuts, macadamia nuts, wheat nuts, dried figs, pistachios, sunflower seeds, walnuts, and almonds were 19.7%, 19.2%, 16.7%, 16.3%, 13.4%, 12.7%, 10.9%, 9.1%, and 8.1%, respectively. With respect to palmitoleic acid (C16:1), the macadamia nuts were distinct in that they contained a higher amount (18.1%) than the other nuts and seeds, which contained 0.1% - 1.0% palmitoleic acid. Additionally, the oleic acid (C18:1) content of almonds was 67.1%, which was the highest among the nuts and seeds, whereas it was 60.9% in cashew and macadamia nuts. The highest content of linoleic acid (C18:2) was 69.8% in the sunflower seeds, whereas macademia nuts only contained 1.6% linoleic acid. The linolenic acid (C18:3) content of dried figs was 34.1%, whereas no linolenic acid was detected in almonds.
All seeds primarily contained monounsaturated fatty acids (MUFA) plus polyunsaturated fatty acids (PUFA) at levels ranging from 74.9% in pine nuts to 91.4% in almonds. The MUFA (C16:1 + C18:1 + C20:1) contents of macadamia nuts, almonds, cashew nuts, and pistachios were 81.3%, 67.7%, 61.4%, and 59.2%, respectively. The PUFA (C18:2 + C18:3 + C20:2) contents of walnuts, dried figs, sunflower seeds, and wheat nuts were 76.7%, 69.1%, 69.9%, and 60.2%, respectively. The oleic acid, linoleic acid, and palmitic acid contents of peanuts were 42.8%, 36.6%, and 11.3%, respectively.
Vitamin A and vitamin E compositions
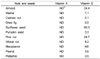
Vitamin A and E contents are shown in Table 4. Vitamin A was not detected in any of the samples evaluated in this study, and the macadamia nuts did not contain vitamin E. The vitamin E contents of sunflower seeds, pine nuts, almonds, and wheat nuts were 60.3 mg/kg, 24.7 mg/kg, 24.4 mg/kg, and 8.2 mg/kg, respectively. In addition, trace amounts of vitamin E were detected in cashew nuts (0.1 mg/kg).
Essential elements and heavy toxic elements composition
Fe, Zn, and Cu are essential elements while, Cd, and Pb are heavy toxic elements (Table 5). The Fe contents of pumpkin seeds (highest), pistachios, sunflower seeds, and cashew nuts (lowest) were 95.85 ± 33.01 ppm, 88.67 ± 6.49 ppm, 81.84 ± 9.82 ppm, and 38.26 ± 18.72 ppm, respectively (P < 0.05). The Zn content of pistachios (67.24 ± 30.25 ppm) was highest, whereas that of macadamia nuts (9.01 ± 7.64 ppm) was lowest (P < 0.05). The highest Cu content (25.45 ± 21.51 ppm) was observed in walnuts, whereas it ranged from 3.10-17.09 ppm in the remaining nuts and seeds.
Cd contents ranged from 0.43-0.57 ppm. Pb content was highest (25.49 ± 4.64 ppm) in wheat nuts (P < 0.05); however, the Pb contents of almonds, walnuts, cashew nuts, pine nuts, peanuts, and pistachios ranged from 0.73-18.62 ppm, and no Pb was detected in dried figs, sunflower seeds, pumpkin seeds, or macadamia nuts. The Pb and Cd contents of nuts and seeds seem to be associated with the use of chemical fertilizers and pesticides.
Discussion
For peanuts, lipid content was 49.7 mg/100 g, protein content was 30.5 mg/100 g, carbohydrate content was 14.9 mg/100 g, and ash content was 2.9 mg/100 g. These results are consistent with those of a previous study conducted by Cho [19], who reported that the lipid content of peanuts in Korea ranges from 44.25%-46.48%, protein content ranges from 22.54-25.42%, total sugars ranges from 12.05-12.20%, crude fiber ranges from 11.05-11.10%, moisture content ranges from 4.30-4.68%, and ash content ranges from 2.13-2.40%. Further, the lipid contents of walnuts and pine nuts ranges from 69.3 mg to 69.8 mg/100 g, protein content ranges from 14.4 mg to 17.3 mg/100 g and carbohydrate contents range from 8.8 to 11.7 mg/100 g. These findings are similar to the results of a study published by Lee et al. [20], who reported that the lipid contents of walnuts and pine nuts range from 67-70%, while protein contents are 15% and carbohydrate content are 5-12%.
The amino acid contents of peanuts can be stratified as follows. Glutamic acid > Arginine > Aspartic acid > Glycine > Serine > Alanine > Leucine > Phenylalanine > Proline > Tyrosine > Cystein. These findings are similar to those of a study conducted by Cho [19], who reported that amino acid contents of peanuts are as follows: Glu > Arg > Asp > Leu > Phe > Pro > Ala > Gly > Val > Ser > Lys. Based on the FAO/WHO recommended essential amino acid amounts for a 2- to 5-year-old child, lysine is the primary essential limiting amino acid in Brazil nuts, cashew nuts, hazelnuts, pine nuts, and walnuts, whereas sulfur amino acids (Met + Cys) are the primary limiting essential amino acids in almonds [3]. Tryptophan is the primary limiting amino acid in macadamia nuts, pecans, and pistachios, whereas threonine is the limiting essential amino acid in Virginia peanuts [3].
The SFA content was highest in peanuts. In a previous study [21], the SFA contents of macadamia nuts, peanuts, pistachios, walnuts, and almonds per 100 g of fat were 99 g, 61 g, 55 g, 50 g, and 45 g, respectively. These findings are consistent with the results of a study conducted by Venkatachalam and Sathe [3]. Moreover, the palmitoleic acid content observed in macadamia nuts in the current study is comparable to levels reported by Maguire et al. [22] (17.3%), Kris-Etherton et al. [23] (23.0%), and Kaijser et al. [24] (17-34%). Ruggeri et al. [25] reported that the oleic acid content of pine nuts is greater than 39.1. Additionally, Nanos et al. [26] reported that Ferragnes and Taxas almonds contained 74.7-80.8% and 72.7-74.8% oleic acid, respectively, which are much higher than the 60.93% value observed in the present study. The linoleic acid content of almonds in the present study was 24.2%, which is within the range of 8-39% reported in previously studies [3,25-27]. The linoleic acid content of pistachio lipids was 27.6% in the present study, whereas others have reported a level of 13.20% [28]. The fatty acid profile of walnuts was distinctly different from those of other nuts and seeds. Specifically, the linoleic acid content of walnuts was much higher (61.6%) compared to the other samples, which showed levels ranging from 1.6%-53.1%. In the present study, walnuts also contained a higher amount of linolenic acid (15.1%) than the other samples, which contained levels ranging from 0.0%-7.1%. The linolenic acid content of walnuts in the present study is consistent with the findings of other studies, including 9-13% in six Portuguese walnut cultivars [3,29], 11.2-13.5% in 10 walnut cultivars from New Zealand [30], and 11.58% in one sample from Ireland. Additionally, various studies [3] have reported intermediate amounts of linolenic acid ranging from 5.8-7.0%. The MUFA (C16:1 + C18:1 + C20:1) contents were highest in the macadamia nuts. These findings are consistent with the results of a previous study in which the MUFA contents of macadamia nuts and walnuts were 524 g/100 g and 128 g/100 g, respectively. Fraser [21] reported that the PUFA content of walnuts, almonds, and macadamia nuts are 352 g/100 g, 99 g/100 g, 12 g/100 g respectively. Conversely, Sabaté [31] reported that the MUFA contents of macadamia nuts, pistachios, and almonds are 82%, 72%, and 68%, respectively. In the present study, the PUFA contents of walnuts, pine nuts, peanuts, and almonds were 66%, 45%, 34%, and 22%, respectively. Berry et al. [32] previously applied almonds, olive oil, or avocados as a source of dietary fat, thus increasing MUFA contents, whereas walnuts, safflower, and soy were used to increase PUFA levels. In this study, the oleic acid, linoleic acid, and palmitic acid contents of peanuts were 42.8%, 36.6%, and 11.3%, respectively. These findings are consistent with the results of previous studies [17], in which oleic acid, linoleic acid, and palmitic acid contents were found to be 45.51%, 38.89%, and 11.22%, respectively.
Macadamia nuts did not contain any vitamin E, whereas sunflower seeds contained the highest level (60.3 mg/kg). In a previous study, Fraser [21] reported that the vitamin E contents of almonds, peanuts, pistachios, and walnuts are 16.1 mg, 6.3 mg, 4.5 mg, and 3.1 mg, respectively, whereas vitamin E is absent from macadamia nuts.
The highest Fe content was observed in pumpkin seeds (95.85 ± 33.01 ppm), the highest Zn level was observed in pistachios (67.24 ± 30.25 ppm), the highest Cu content was observed in walnuts (25.45 ± 21.51 ppm), and the highest Pb level was observed in wheat nuts (25.49 ± 4.64 ppm) (P < 0.05). In previous studies [18] that evaluated the mineral contents of nuts and seeds, Ca ranged from 1,010-1,600 ppm, Zn ranged from 62.8-45.2 ppm, Fe ranged from 12.8-10.4 ppm, and Pb ranged from 2.6-4.1 ppm. The Pb contents of nuts and seeds in the present study (cashew nuts 6.61 ± 0.68 ppm, wheat nuts 25.49 ± 4.64 ppm, peanuts 18.62 ± 2.25 ppm, and pistachio 11.62 ± 1.42 ppm) were higher than previously reported values (1-5 ppm) [18].
Generally, nuts and seeds are imported in Korea. Current imported commercial nuts and seeds in Korea have no problems related to nutritional contents. However, more precise analysis of Pb content is required to ensure the safety of imported products.


 XML Download