

 PDF
PDF ePub
ePub Citation
 Print
Print


Introduction
Oxidative stress refers to disturbances in the balance between antioxidant system activity and production of reactive oxygen species (ROS). ROS overproduction or reduced antioxidant levels may lead to oxidative stress, which damages cells and tissues [1]. High fat consumption is associated with an increased risk of obesity, which can accelerate the overproduction of ROS [2]. Obesity is attributed to activation of tissue oxidation and lipid peroxidation, resulting in oxidative stress-related diseases such as cancer, heart disease, diabetes, and Alzheimer's disease [3,4]
Antioxidant enzymes such as catalase, superoxide dismutase (SOD), and glutathione peroxidase (GSH-Px) neutralize ROS [5]. Antioxidant vitamins and carotenoids effectively scavenge ROS and upregulate the activities of antioxidant enzymes [6]. Carotenoids act as powerful antioxidants that protect cell membranes from lipid peroxidation and quench free radicals and other reactive species [7]. Carotenes (α-carotene, β-carotene, and lycopene) and xanthophylls (lutein and zeaxanthin) belong to the class of carotenoids. Among the carotenoids, lycopene has the highest antioxidant activity and is an effective free radical scavenger [8].
Lycopene is abundant in red fruits such as tomato and water melon. The protective effects of lycopene against many different types of cancer including prostate, breast, and skin cancer have been reported in many studies [9,10]. These anticancer effects seem to be influenced by the antioxidant properties of lycopene. Lycopene helps protect cells from free radical attack via scavenging of ROS and detoxifying lipid peroxide [11].
High fat diet increases body weight and fat storage that elevates oxidative stress through increasing ROS production from accumulated fats [12]. However, bioavailability of lycopene increased when lycopene was ingested with high fat [13]. Therefore, the interaction between elevated oxidative stress and lycopene bioavailability by high fat consumption is needed to study.
Rat and mice are widely used for the experimental animal model, but improper to study the biological activity of lycopene because they cannot metabolize a large amount of carotenoids. However, Mongolian gerbils are suitable for lycopene studies because carotenoid metabolism in gerbils is similar to that in humans [14,15]. Using the Mongolian gerbil as an experimental animal, we evaluated the effect of lycopene on the antioxidative system in obese gerbils induced by a high fat diet.
Materials and Methods
Experimental animals
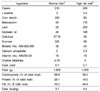
The experimental animals used in the present study were male Mongolian gerbils (15-16-weeks-of-age; SCL, Inc Shizuoka, Japan). Gerbils were housed individually in suspended stainless steel cages. The animals were maintained under standard condition (12/12 hour light/dark cycle at 21 ± 3℃ and a relative humidity of 40 ± 15%) and received chow diet and tap water ad libitum for 1 week before beginning of the experiment. After a 1 week acclimation, the gerbils were randomly divided into four groups of 10 gerbils each and were fed experimental diets for 6 weeks as follows: 1) normal diet (NC); 2) high fat diet (HF); 3) normal diet with lycopene (NL); and 4) high fat diet with lycopene (HFL) (Table 1). Feed consumption was measured every other day, and body weights were recorded weekly. Gerbils were handled in accordance with the Guidelines for the Care and Use of Laboratory Animals.
Experimental diet
The basal diet used in this experiment was the Teklad diet (Harlan Teklad Madison, WI, USA). The 20 gerbils in the NC and NL groups received a normal diet (Harlan Teklad TD.06416) in which approximately 10% of the total calories came from fat. The 20 gerbils in the HF and HFL groups received a high fat diet (Harlan Teklad TD.06415) in which approximately 45% of the total calories came from fat. The lycopene added to the experimental diet was supplied by LycoRed (Lyc-O-Mato Beads®, Natural Products Industries LTD., Beer-Sheva, Israel) which contains 5% lycopene extracted from tomatoes. Boileau et al. [16] indicated that lycopene concentration in liver and serum dose-dependently increased with increasing dietary lycopene beadlet level at 0 to 0.5 g/kg diet (10 g lycopene per 100 g beadlets). However, supplementation of lycopene beadlet at 0.5 to 5.0 g/kg diet did not increase tissue and serum lycopene concentration. In addition, Jain et al. [17] reported that oxidative stress was inhibited in rats fed a diet supplemented with lycopene at 10 ppm for 8 weeks. Therefore, CL and HFL diets were prepared to contain 0.5 g of Lyc-O-Mato Beads® per 1,000 g of basal diet.
Sample preparation
At the end of the experimental period, all gerbils were deprived of feed overnight, and then anesthetized with diethyl ether. Blood was drawn from the heart, and erythrocytes were obtained from the heparinized blood from the heart. Liver tissue was rapidly removed and rinsed with physiological saline. Liver tissues were collected and immediately quick-frozen in liquid nitrogen and stored at -70℃ until analysis. Mitochondria and cytosol in liver tissue were separated according to the method of Hogeboom [18]. Epididymal adipose tissue and mesenteric fat tissue were removed, rinsed in saline, and weighted on the microbalance.
Analysis of lycopene
Lycopene was quantified by high performance liquid chromatography (Shimadzu, Kyoto, Japan) equipped with a Waters µ-Bondapak C18 column (3.9 × 300 mm) using the method described by Miller et al. [19]. Liver tissue was homogenized in 10% KOH and ethanol (1:5, v/v) containing 0.1% butylated hydroxytoluene and incubated at 60℃ for 30 min. Lycopene was extracted from the liver and erythrocyte using hexane and distilled water. Each sample was centrifuged at 2,000 × g for 5 min, and the upper hexane layer was removed to another amber bottle. The hexane fractions were evaporated to dryness under nitrogen gas and the residue was redissolved in mixture of chloroform and methanol (2:1, v/v). Lycopene was measured with a UV-Vis detector at 470 nm with a mixture of acetonitrile: methanol: chloroform (47:47:6) as the mobile phase. Trans-β-Apo-8'-carotenal (Sigma, St. Louis, MO, USA) was used as the internal standard to determine extraction efficiency. An external lycopene standard (Wako Pure Chemical Co., Osaka, Japan) was used as the reference standard.
Lipid peroxide assay
Hepatic lipid peroxides were assayed by thiobarbituric acid reacting substances (TBARS) as described by Ohkawa et al. [20]. TBARS absorbance was measured at 532 nm using a spectrophotometer (Hitachi, Tokyo, Japan). Erythrocyte lipid peroxide concentration was measured by the method of Stocks and Dormandy (1971). Erythrocyte was mixed with 5% trichloroacetic acid (TCA) and 0.06 M thiobarbituric acid (TBA). The mixture was incubated at 80℃ for 90 min and centrifuged at 1,000 × g for 15 min. The supernatant was collected and determined spectrophotometrically at 535 nm. The TBARS concentration was calculated using 1,1,3,3-tetraethoxypropane (Sigma) as the external standard.
Total antioxidant status assay
Total antioxidant status (TAS) was analyzed using a TAS kit (Randox Laboratories Ltd., Crumlin, UK), based on a Trolox equivalent antioxidant capacity assay. Plasma or erythrocyte sample was mixed with chromogen and incubated at 37℃ and then substrate was added. Absorbance was read using a microplate reader (Perkin Elmer, Turku, Finland) at 600 nm.
Glutathione content assay
Hepatic levels of total glutathione and the ratio of reduced glutathione (GSH) to oxidized glutathione (GSSG) were analyzed with a glutathione kit (Biovision Research Products, Mountain View, CA, USA). Liver tissue was homogenized in glutathione buffer and sulfosalicylic acid was added and then centrifuged at 8,000 × g for 10 min. The total glutathione was determined using the reaction mixture including a NADPH generating mixture, glutathione reductase (GR), and glutathione reaction buffer. The assay mixture excluding GR for total glutathione was used for the GSH assay. Absorbance was read at 405 nm using a microplate reader (Perkin Elmer, Waltham, MA, USA). The glutathione concentration in the sample was determined using a standard glutathione calibration curve.
Antioxidant enzyme activity assay in liver and erythrocyte
Catalase activity was determined at 25℃ with hydrogen peroxide as the substrate using the method of Aebi [21]. The mitochondrial fraction, diluted with 50 mM phosphate buffer (pH 7.0), was added to 20 mM H2O2, and catalase activity was determined from UV absorption (Hitachi) at 240 nm. One unit of catalase activity was defined as the amount consuming one µmol of hydrogen peroxide per min. The cytosolic activity of SOD was determined using the method of Marklund and Marklund [22]. One unit of SOD activity was defined as the amount of enzyme that inhibits the autoxidation of pyrogallol by 50%. Liver mitochondria GSH-Px activity was measured by the modified method of Paglia and Valentine [23]. GSH-Px activity was recorded at 342 nm for 300 sec and expressed as nmol of reduced NADPH/min. GR in the cytosol was determined according to Pinto and Bartley [24] with a slight modification. GR activity was recorded at 340 nm for 5 min. One unit of GR activity was defined as the amount reducing 1.0 µmole of oxidized glutathione per min and per mg of protein at 25℃. Glutathione-S-transferase (GST) activity in the cytosol was determined in hepatic tissue by the method of Habig et al. [25] using 10 mM CDNB as the substrate. Enzyme activity was expressed using an extinction coefficient of 9.6 mM cm-1 and expressed as nmole of conjugated CDNB per min and per mg of protein.
Statistical analysis
The data analysis was performed using SPSS ver. 18.0, (SPSS Inc., Chicago, IL, USA). Results are presented as mean ± standard deviation (SD). Data were analyzed by two-way analysis of variance, and mean differences between the experimental groups were evaluated by Duncan's multiple-range test. A difference was considered significant at P < 0.05.
Results
Body fat weight
Epididymal adipose tissue weight significantly increased in gerbils fed the high fat diet compared with normal diet groups but it was not affected by dietary supplementation of lycopene (Table 2). Mesenteric fat tissue in the high fat diet groups was significantly higher than that in the normal diet groups, but it was significantly reduced by lycopene supplementation.
Hepatic lycopene concentration
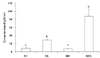
Hepatic lycopene concentration is represented in Fig. 1. After 6 weeks of lycopene supplementation, the hepatic level of lycopene in the NL group increased compared with that in the NC group (P < 0.05). The liver concentration of lycopene in the HFL group was significantly higher than that in the other experimental groups (P < 0.05).
Lipid peroxide level
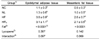
Table 3 presents lipid peroxide levels in the liver and erythrocytes of gerbils. The hepatic level of lipid peroxide increased in the HF group but decreased following dietary supplementation with lycopene (P < 0.05). Lipid peroxide levels were similar in erythrocytes to the changes in the liver. The erythrocyte lipid peroxide level in the HF group increased significantly compared to that in the NC group (P < 0.05). Lipid peroxide level in erythrocytes of the HFL group was significantly lower than that in the HF group (P < 0.05).
Glutathione content
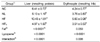
Total glutathione content and the ratio of GSH and GSSG are summarized in Table 4. Total glutathione content in the NL group increased significantly compared with that in the NC group (P < 0.05). However, no significant difference was observed between the HF and HFL groups. The ratio of GSH to GSSG in hepatic tissue tended to decrease in the HF group compared with that in the NC group. The ratio of GSH to GSSG in the NL and HFL groups tended to be higher than that in the NC and HF groups, but the difference was not significant.
Total antioxidant status
TAS in the experimental groups is depicted in Table 4. Plasma TAS decreased in the NC group, and this decrease was alleviated by lycopene feeding (P < 0.05). Feeding of lycopene elevated TAS in erythrocyte in NL group than in NC group and it tended to decrease erythrocyte TAS compared with that in the HF group (P < 0.05).
Erythrocyte and hepatic antioxidant enzyme activity
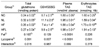
Table 5 presents erythrocyte antioxidant enzyme activity. Catalase activity in erythrocytes was not significantly different among the groups. Lycopene supplementation significantly increased SOD activity when compared to that in the NC group (P < 0.05). GSH-Px activity increased in the NL group (P < 0.05) compared with that in the NC group, but no significant difference was observed between the HF and HFL groups.
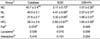
Hepatic antioxidant enzyme activities are shown in Table 6. Hepatic catalase activity increased following lycopene supplementation compared with that in the NL group (P < 0.05). Although hepatic SOD and GSH-Px activities were not significantly different, a tendency towards an increase in SOD and GSH-Px activities was observed in the lycopene groups compared with that in the NC and HF groups. GR activity in the NL group was significantly higher than that in the NL group (P < 0.05) and tended to increase following lycopene supplementation compared with that of HF group. GST activity was significantly higher in the NL group than in NC groups (P < 0.05) and it showed that a slight increase in the HFL group when compared with the HF group.
Discussion
Consuming tomato and tomato products lowers the risk of diabetes and coronary heart diseases [26]. The beneficial health effects of tomato are mainly attributed to lycopene, as the lycopene in tomato has an antioxidant role as a free radical scavenger [27]. A higher dose of lycopene leads to the prevention of prostate cancer by decreasing oxidative stress [28]. The aim of the present study was to determine the effect of lycopene supplementation with high fat on body lycopene content and to investigate the protective effects of lycopene against oxidative stress in Mongolian gerbils fed a high fat diet.
Many studies [29,30] have suggested that lycopene is not detectable in the liver of animals consuming a normal diet without lycopene supplementation. However, lycopene supplementation causes a dose-dependent accumulation of lycopene in liver tissue, which was similar to our results. Although a small amount of lycopene was detected in the NC and HF groups, dietary lycopene supplementation increased hepatic lycopene concentrations in the gerbils. Gitenay et al. [31] showed that liver concentration of lycopene (7.4 nmol/g) increased in rat fed lycopene beadlets at 50 mg/kg diet for 6 weeks. In this study, lycopene group showed a significantly higher liver level of lycopene (28.8 nmol/g) than normal diet group. Mongolian gerbils have been known as an effective accumulator of lycopene [17]. Therefore, gerbil is useful for researches to evaluate the effect of lycopene.
The amount and type of dietary fat influence lycopene absorption [32]. Several studies [33,34] have found a significant increase in hepatic lycopene concentration after animals have consumed lycopene with lipids such as sunflower oil, olive oil, and avocado lipids, principally by stimulating bile production. In this study, lycopene concentration was about four times higher in gerbils fed a high fat diet with lycopene than that in gerbils fed a normal diet with lycopene. These results show that high dietary fat induced the promotive effect on lycopene absorption in the HFL group.
Lipid peroxide donates the oxidative degradation of lipids and serves as a biomarker of general oxidative stress [35]. Our data show that lipid peroxide levels increased significantly in gerbils fed a high fat diet compared with those in the normal diet group. Unlike a normal diet, the high fat diet increased epididymal and mesenteric fat tissue weight that may be considered obesity induced by high fat feeding. Lipid metabolism by gerbils in response to feeding fat is similar to that in humans [36], allowing investigations into oxidative stress levels in high fat diet-induced obese gerbils. This result suggests that a high fat diet affects oxidative stress status and can be considered an increased risk of oxidative stress-related diseases. Furukawa et al. [12] reported that fat accumulation leads to elevated systemic oxidative stress by ROS production and causes abnormal adipocytokine expression and insulin resistance. Fat accumulation may lead to oxidative stress by increasing lipid peroxidation, which causes diabetes mellitus and hyperinsulinemic hypoglycemia by insulin resistance.
Our results showed that a lycopene diet remarkably reduced lipid peroxidation in the liver and erythrocytes in the high fat diet groups. Bahcecioglu et al. [37] reported that lipid peroxide levels in a high fat diet group were significantly higher than those in normal diet groups, but that lycopene supplementation inhibits lipid peroxidation. Therefore, it appears that lycopene supplementation leads to reduced oxidative stress by inhibiting lipid peroxidation in Mongolian gerbils.
Glutathione is important for protecting cells against peroxidation by free radicals and ROS [38]. Glutathione exists in a reduced form (GSH) and oxidized form (GSSG) in biological systems. GSH donates electrons or hydrogens to other unstable molecules such as free radicals [39]. Thus, the glutathione level is an important factor related to protection against lipid peroxidation. Hsu and Yen [40] showed that GSH level decreases and GSSG level increases in obese rats induced by a high fat diet. In our study, the ratio of GSH to GSSG decreased in obese gerbils induced by a high fat diet. Previous studies have shown that total glutathione level is significantly lower but that GSSG level is higher in high fat diet groups, suggesting that greater oxidative stress occurs in dietary fat supplemented groups than that in normal diet groups [41].
Lycopene feeding appears to promote the level of total glutathione in response to toxicity induced by the T-2 toxin in rats [42]. Moreira et al. [43] found that glutathione content increased after tomato powder supplementation, and that serum lycopene level increased at the same time. Moreover, dietary lycopene supplementation restores the glutathione system, which leads to the removal of oxygen free-radicals [44]. Our results show that the ratio of GSH to GSSG tended to increase following lycopene supplementation, suggesting that lycopene may act as an antioxidant to decrease oxidative stress induced by a high fat diet.
Obese rats induced by a high fat diet show a significant reduction in antioxidant enzyme activities. GSH-Px, GR, and GST activities showed decreases of 35, 57, and 40%, respectively, in a high fat diet group compared to those in a normal diet group [45]. Lee et al. [46] also suggested that high dietary fat decreases antioxidant enzyme activities in the liver. In the present study, hepatic SOD and GSH-Px activities tended to decrease in gerbils fed a high fat diet compared to those in gerbils fed a normal diet. Therefore, a high fat diet seems to degrade antioxidant enzyme defenses, thereby increasing oxidative stress.
Hepatic antioxidant enzyme activities increased in gerbils treated with lycopene in this study, which was similar to the study of Moreira et al. [43] who reported that hepatic GSH-Px and GST activities increased following tomato powder supplementation. Atessahin et al. [47] suggested that decreased catalase activity following cisplatin treatment significantly increases preand post-treatments with lycopene. SOD, GSH-Px and GR can neutralize the toxic effects of ROS and GST is effective in protecting against lipid oxidation [6]. These results reveal that oxidative stress induced by a high fat diet might be diminished by feeding lycopene through enhancing antioxidant enzyme activities.
In this study, hepatic GSH content, and plasma and erythrocyte TAS were significantly higher in the lycopene-supplemented groups than those in the normal diet group. In addition, erythrocyte SOD and GSH-Px, hepatic catalase, GR, and GST activities were enhanced in gerbils fed lycopene compared with normal diet group. Therefore, lycopene supplementation might have activated antioxidant system by increasing antioxidant enzymes even when additional oxidative stress has not been given.
In conclusion, the present results show that gerbils fed a high fat diet might be more susceptible to peroxidative tissue damage due to increased lipid peroxidation and decreased antioxidant enzyme activities. However, lycopene supplementation enhanced antioxidant enzyme activities and lowered lipid peroxidation induced by a high fat diet. These results suggest that lycopene supplementation is efficient for alleviating oxidative stress by modulating the antioxidant system in a high fat diet.

 XML Download