

 PDF
PDF Citation
 Print
Print


INTRODUCTION
Previous research has shown that there are differences in the perceptual attention given to various cues used during speech perception. Individual listeners give different perceptual weights to acoustic cues, and the weighting strategies of children are significantly different from those of adults [1,2,3]. One hypothesis to explain the differences between adults and children regarding cue weights is the developmental weighting shift (DWS) hypothesis [4,5]. According to the DWS hypothesis, young children attend more to formant transition cues, which specify changes in the vocal tract. Younger children weight formant transition cues more heavily than static consonantal cues such as frication steady-state or noise bursts. Children learn to weight segments in an adult-like manner as they gain more language experience, learning to pay more attention to cues specifying consonant constrictions.
A second explanation for the differences in cue weighting between adults and children is the auditory sensitivity hypothesis [6,7]. According to this hypothesis, auditory sensitivity to acoustic parameters influences linguistic decisions. The immature cortical auditory areas of younger children results in different cue weighting patterns from adults, with the children relying more on cues that are either louder or of longer duration [7,8], or which contain more extensive spectral information [9,10]. Results from one study showed that children weight longer and louder cues (such as steady-state cues) more than dynamic cues (such as transition cues) when perceiving vowels [8]. Other evidence, however, would suggest it is the dynamic structure of the vowel that is attended to by both children and adults [11].
An explanation of cue perception may be important for understanding how normal-hearing children (NHC) learn the phonetics of language. Our own understanding of this process is vital for enabling children with hearing loss to learn language. Children with hearing impairment have limited audibility, less language experience, and distorted audition caused by the hearing loss [12]. As a result they may have different speech cue weighting strategies than NHC. Children with moderate to severe sensorineural hearing loss may use listening strategies that differ from those of NHC in the same age group.
There have been few studies of the speech perceptual development of children with hearing loss pertaining to cue perception [13,14,15]. Investigators in these studies used various consonant-vowel (CV) and vowel-consonant (VC) combinations to study what cues children with hearing loss were using to distinguish between consonant sounds. Two studies in particular show remarkably similar results. Results from one study showed that all children and adults weighted fricative spectrum cues more than transition cues regardless of hearing sensitivity, and there were no significant differences between children and adults [13]. Another showed that NHC and children wearing cochlear implants (CI) weighted fricative spectrum cues more than transition cues [14]. It is surprising that similar weighting patterns were found across these two studies in that they employed different stimuli: one used live-voice and VC syllables, and the other used synthetic CV stimuli [13,14]. The third study mentioned above did not compare relative weighting of the two cues within groups, and used hybrid CV stimuli [15]. The statistical methods used to explore cue weighting were different in the three studies. In one study, cue weights were calculated using correlation coefficients [13], another analyzed cue weighting with phonemic boundaries and slopes of labeling function [15], and another used an analysis of variance (ANOVA) model [14,16].
One way to test whether younger children with hearing loss may attend more to static or dynamic cues of syllables would be to compare static and dynamic cues weights across different contrasts in the same children. This methodology was previously used to study perceptual responses in children and adults with normal hearing [17]. In fricative consonants, fricative noise cues (static cues) are longer than transition cues (dynamic cues). Conversely, in voiceless stop consonants, transition cues are relatively longer than their accompanying burst (static) cues. By testing both a fricative contrast and a voiceless stop contrast across the same children, it would be possible to observe how two cuesstatic and transition may be weighted differently due to changes in context and length. The earlier study using this similar methodology [17] found that cue weighting may vary from one consonant contrast to another, and within the same consonant for different segmental contexts. Therefore, we are looking at how children wearing a CI may have potentially different weighting strategies from that of adults or NHC. It may be that children wearing a CI require more information via a longer cue [7,8] than more information via spectral change represented by a formant transition.
The purpose of the current study was to determine how normal-hearing adults (NHA), NHC, and children wearing CI differ in the perceptual weight given cues for fricative consonants (having a comparatively long static cue and short transition cue) versus stop consonants (having a comparatively short static cue and long transition cue). By testing both a fricative contrast and a stop consonant contrast across listeners of adults and children, we can test how the temporal length affects perceptual weighting.
MATERIALS AND METHODS
Subjects
All adult listeners were recruited from undergraduate and graduate students of the Department of Audiology and Speech Pathology at the University of Tennessee. All NHC were recruited from the children of faculty and students of the Department of Audiology and Speech Pathology and children wearing CI were recruited from the Child Hearing Service (CHS) and the Audiology Clinic at the University of Tennessee. There were no children of adults who were recruited in this study.
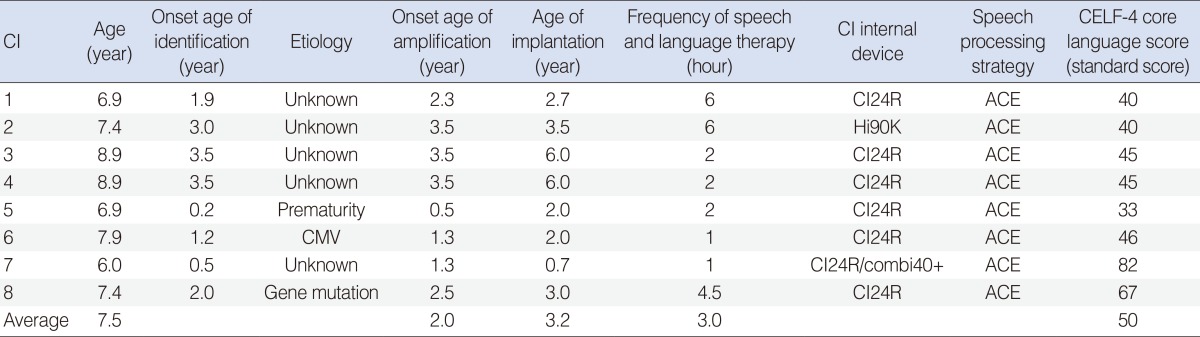
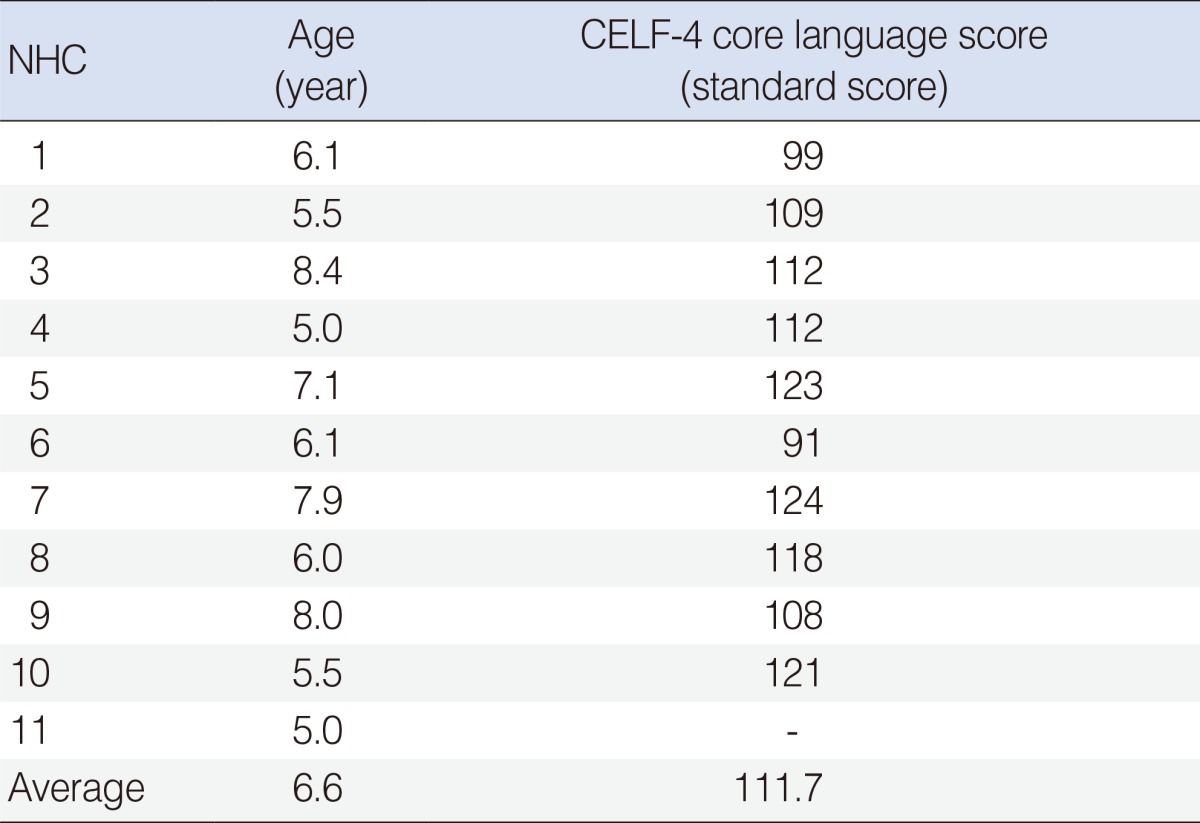
Three groups participated in this study: 10 NHA (5 female), 11 NHC (5 female), and 8 children wearing CI (8 female). The mean age of the NHA group was 24.5±2 years old, the NHC was 6.5±1.2 years old, and the CI was 7.5±1.0 years. All participants were native speakers of American English. Audiologic testing was performed by a GSI 61 (Grason-Stadler, Eden Prairie, MN, USA) using headphones (TDH-50P; Telephonics, New York, NY, USA) for normal-hearing listeners. The sound field test was assessed through a speaker (JBL proIII; JBL Incorporated, Northridge, CA, USA) for children wearing CI. All listeners with normal hearing had hearing sensitivity in both ears of 20 dB HL or better for octave frequencies from 250 to 4,000 Hz [18] and no history of otologic pathology. Children wearing CI had electrical hearing sensitivity of 30 dB HL or better for octave frequencies from 250 to 4,000 Hz. The children wearing CI had no history of cognitive problems. One child with CI (CI7) wore bilateral cochlear implants. Table 1 shows further data regarding the children wearing CI and core language scores (Clinical Evaluation of Language Fundamentals [CELF] 4) [19] for the children wearing CI. Core language scores include expressive and receptive language scores. All NHC also had CELF-4 screening tests and showed normal language development. The individual core language standard scores are shown in Table 2. The study was approved by the Institutional Review Board of the University of Tennessee (#UTK: IORG0000071).
Stimuli
Synthetic CV stimuli were constructed via a Klatt software cascade/parallel formant synthesizer [20] using a sampling rate for stimulus generation was 10 kHz with low-pass filtering at 4.8 kHz, same as that of earlier studies [15]. Continua corresponding to /su/-/∫u/ and /pu/-/tu/ contrasts were constructed. Combinations of ideal frication/burst and formant transition onset frequency were used to create 9 stimuli for each contrast.
Experiment I: fricative consonant perception
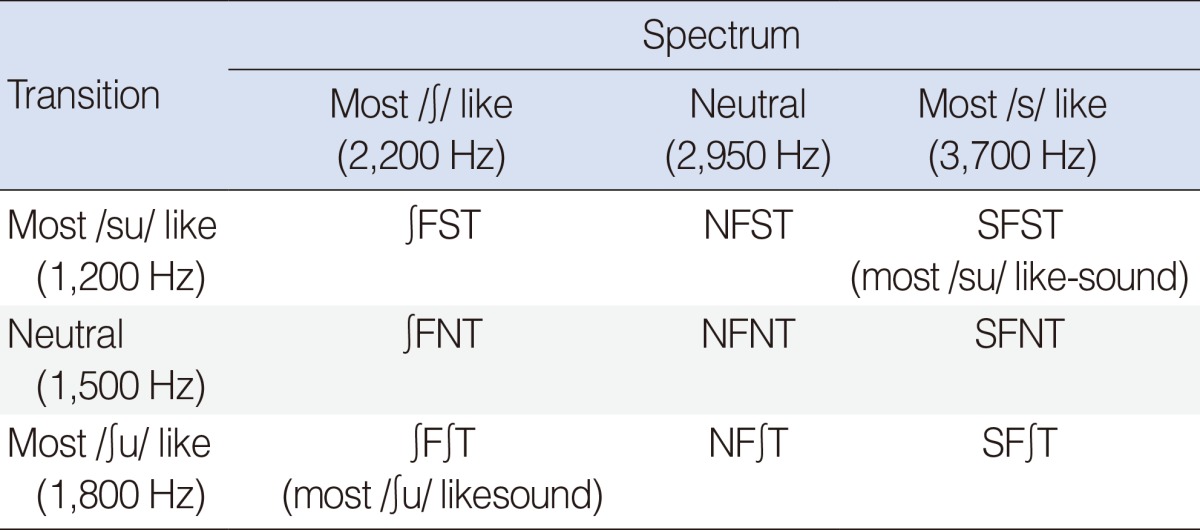
The initial step in constructing the /su/-/∫u/ contrast was the making of the /u/ vowel. The vowel was 240 ms in duration, with an initial fundamental frequency of 130 Hz which declined to 100 Hz at the end of the vowel. The formant frequency steady-state values were F1=350 Hz, F2=900 Hz, F3=2,200 Hz, and F4=3,300 Hz. Bandwidths for the vowel formants were F1=65 Hz, F2=110 Hz, and F3=140 Hz. The next step was to make a /s/ spectrum using the AF synthesis parameter, with energy in the 3,700 Hz frequency region. Energy in this frequency region was shown in a previous study to convey a /s/ percept [14]. The total duration of the frication spectrum was 240 ms, making for a total CV syllable duration of 480 ms. This fricative was then combined with F2 formant transition onset frequencies appropriate for /s/ (F2 onset=1,200 Hz), for /∫/ (F2 onset=1,800 Hz), or neutral (F2 onset=1,500 Hz). The F2 transition duration occurred during the first 65 ms of vowel onset. This made three stimuli. A /∫/ spectrum was then made with energy in approximately the F3 frequency region (2,200 Hz). This frication was combined with the three formant transition values to yield three more stimuli. Finally, a frication spectrum neutral for the /s/-/∫/ contrast was created, with an energy peak at 2,950 Hz. This neutral spectrum was combined with the formant transition values to yield the final three stimuli. Fricative amplitude was equated for pairs of stimuli having the same fricative pole but different formant transition onset values. There were a total of nine stimuli. Table 3 showed description of stimuli for Experiment I.
Experiment II: voiceless stop consonant perception
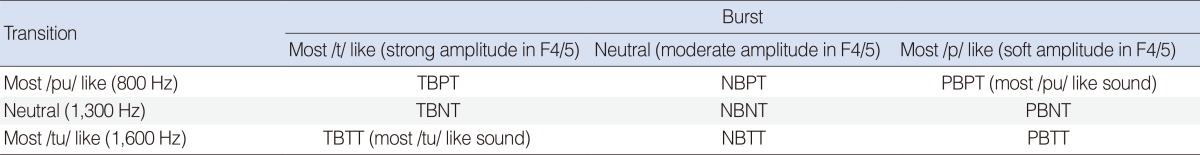
To make the stimuli of the /pu/-/tu/ contrast, a stop burst appropriate for /p/ was created, having a relatively flat frequency spectrum, and attached with the /u/ vowel used for the frication stimuli. The burst duration was 20 ms, and aspiration noise was initiated during the burst and remained on slightly after the voicing onset of the vowel 40 ms later, making for a 60 ms consonantal portion. This made the total CV stimulus duration 300 ms. This /p/ burst was then combined with F2 formant transition onset frequencies corresponding to either /p/ (F2 onset=800 Hz), /t/ (F2 onset=1,600 Hz), or neutral (F2 onset=1,300 Hz). The duration of the F2 formant transition was 40 ms. This yielded three stimuli. Then, a /t/ burst was created by increasing the energy in the F4/F5 frequency region of the burst, and this burst was then combined with the three F2 formant transition onset frequencies to yield three more stimuli. Finally, a neutral burst was created by inserting energy values in the F4/F5 frequency region (3,300-4,200 Hz) that were intermediate of the /p/ and /t/ burst values. This neutral burst was then combined with the three F2 formant transition onset frequencies to yield 3 more stimuli. Thus, the /pu/-/tu/ contrast consisted of 9 stimuli. Table 4 showed description of stimuli for Experiment II.
Experiment protocol
Experiment I: fricative consonant perception
Practice items were presented to all listeners before data collection began. A picture of a shoe served as the prompt for the stimulus /∫/, and a picture of a girl served as the prompt for the /s/ stimulus. First, the investigator helped the listener identify the pictures as "Sue" and "shoe" using live voice. Then participants listened to the end point experimental stimuli (most /su/ like and most /∫u/ like sounds) via loudspeaker (JBL proIII). Practice items were administered 5 times for each sound for a total of 10 times. If the participant did not get all 5 correct of each sound, their data were not included. Participants listened to a total of 18 stimuli presented 10 times each, for a total of 180 responses. The stimuli were presented in random order.
Experiment II: stop consonant perception
The procedure for Experiment II was the exactly same as for Experiment I except for the pictures shown on the computer screen. A picture of "Winnie the Pooh" served as the prompt for the stimulus /pu/, and a picture of "2" served as the prompt for the /tu/ stimulus. The rest of procedures were same as in Experiment I.
Data analysis
We used the SPSS ver. 14.0 (SPSS Inc., Chicago, IL, USA) for statistical analysis. The following analyses were performed on the data: (1) a three-way ANOVA to determine group differences, and (2) a determination of relative cue weights within groups using the ANOVA model [14,16]. The responses were arcsine-transformed, and then entered as the dependent variables in the three-way ANOVA. The within factors for this analysis were the two cues (frication spectrum and transition) and the between factor was listener group. Individual cue weights can be determined using an ANOVA model [21]. Coefficients of determination can be computed from the ANOVA sum of squares. The coefficient for a given cue is calculated by dividing the sum of squares for that cue by the total sum of squares. The coefficients show what proportion of variance, or weighting, in listener responses is accounted for by each cue. By using synthetic stimuli with a fixed number of cues, the cues can be fully crossed and mutually orthogonal, and thus appropriate for analysis using coefficients of determination.
RESULTS
Experiment I: fricative consonant perception
NHA and NHC
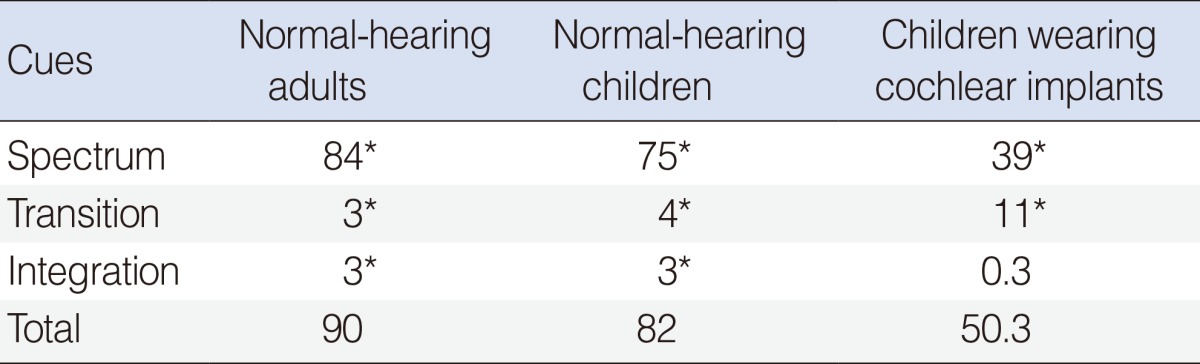
The proportion of variance accounted for by each cue for each group is illustrated in Table 5 for the fricative continua. For both children and adults the greater degree of weighting is on the frication spectrum cues than transition cues. Results suggested that there was a developmental pattern in fricative spectrum cue perception between adults and children groups. Indeed, there was a significant spectrum by group interaction (P<0.001) using Huynh-Feldt corrections. This suggests there was a significant developmental pattern in fricative spectrum perception between the NHA and NHC groups. Transition cues and cue interaction were similarly weighted between groups. The proportion of weight placed on the transition cues and the interaction of cues was relatively minor in comparison to the spectrum cue weighting. The total variance accounted for appeared to be slightly greater for the NHA responses than for the NHC responses (90% vs. 82%).
NHC and children wearing CI
The proportion of variance accounted for by each cue for each group is illustrated in Table 5. The fricative spectrum cue accounted for 75% of the variance of the NHC group responses but only 39% for the CI group responses. This difference was corroborated by a significant frication by group interaction (P<0.001) using Huynh-Feldt corrections. Transition cues accounted for 4% for NHC group responses and 11% for CI group responses. This was not a significant difference between groups, however, because there was not a transition × group interaction in the overall ANOVA results. The total proportion of variance accounted for by all cues was 82% for the NHC group and 50.3% for the CI group. Interaction of cues was not significant in the CI group.
Experiment II: voiceless stop consonant perception
NHA and NHC
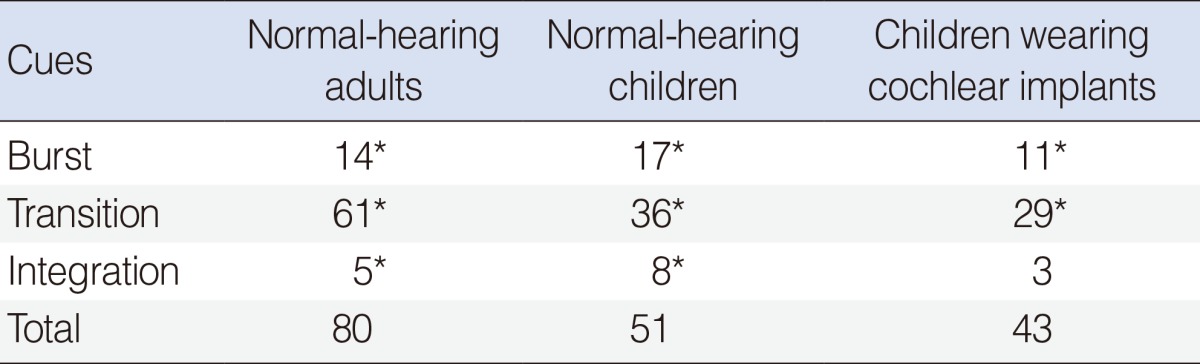
Perceptual weights are presented in Table 6 and listed as the proportion of variance accounted for by the cue. There was a greater degree of weighting on the transition cues than burst cues in the NHA and NHC groups. The proportions of weight placed on the burst cues were similar to one another (14% for NHA vs. 17% for NHC). The proportions of weighting placed on the transition cues, however, were significantly different between the two groups, with the NHA group showing 61%, and the NHC group 36%. This difference was also shown by a significant transition by group interaction (P<0.001). These results suggest a developmental pattern in the use of transition cue for voiceless stop consonant perception. Results also showed relatively small but significant proportions of variance accounted for by interaction of cues by the two groups (5% for NHA vs. 7% for NHC).
NHC and children wearing CI
The proportion of variance accounted for by each cue for each group is shown in Table 6. For both groups a greater degree of weighting was placed on the transition cues than on the burst cues. There were no significant differences between the NHC and CI groups. The cue interaction value for the CI group, however, was not significant. Total variance accounted for by the model was slightly greater for the NHC group than the CI group (51% vs. 43%).
DISCUSSION
The main finding in the current study is that all three groups (NHA, NHC, CI) placed the most perceptual weight on the longest-duration cue. For the fricative contrast, the longer-duration cue was the frication spectrum cue, and for the voiceless stop contrast, the longer-duration cue was the formant transition cue. These results suggest that listeners, irrespective of developmental changes that occur between the ages of 5.5 years and young adulthood, or wearing a CI, simply focus on the most temporally-salient acoustic cue available. These results are consistent with an earlier study [14], and would partially support claims from earlier research that children rely more on speech cues that are either louder or of longer duration [7,8], or which contain more extensive spectral information [9,10].
Results from the current study do not imply, however, that there are no developmental shifts or refinements that are occurring regarding perception of cues. For both the fricative and voiceless stop contrasts, there was a significant statistical interaction between the NHA and NHC groups and the longer duration cue-and for each contrast, there was more variance accounted for by the longer cue for the NHA group than for the NHC group. These results would suggest that the developmental refinements made by children from 5.5 years of age to young adulthood are not one of changing from dynamic to static cues, but rather refinements in processing, in differing cue weighting strategies, in phoneme template formation, or in attending to the longer-duration cues. Results from the current study cannot determine which of these processes is occurring, or occurring developmentally.
The results of the ANOVA model showed significant proportions of variance explained by the interaction of the burst and formant transition cues in both adults and children in voiceless stop consonants continua. The interaction can be defined as the perception of one cue depending on the value of another cue, and thus may provide a crude estimate of cue integration. The proportion of variance accounted for by the integration of cues was similar for NHA and NHC. These results provide evidence that cue integration is important for perception of consonants [22,23]. Cue interaction or integration for the children wearing CI was not significant for either the frication or stop consonant contrasts. Previous studies have shown that adult listeners with hearing impairment have reduced cue integration for fricatives [24,25] and stop consonants [21]. Hearing loss may affect how well listeners with hearing impairment may combine information across different time slices, and this may affect their phonemic perception.
In this study, the language abilities of the children were evaluated using the CELF-4. The core language scores are reported in Tables 1, 2. The core language includes receptive language and expressive language subtests. The average standard score was 111 for the NHC, and 50 in the CI group. Almost all CI children were in the <1 percentile range. Previous report [15] found significantly different cue weighting strategies and language assessment scores between non-mainstreamed children with hearing impairment and mainstreamed children with hearing impairment. These results suggest that experience with auditory signals or other language experiences influence the ability to use appropriate cues for making phonemic decisions.
In conclusion, findings from the current study indicated that adults and NHC, and children wearing CI all showed preference for the longer-duration consonantal cue for labeling a fricative contrast and a voiceless stop contrast. Developmental changes were suggested in that NHC gave less perceptual weight to the dominant cue than did adults. These developmental changes may possibly arise from refinements in processing, in cue weighting strategies, phoneme template formation, or in the ability to attend to longer-duration cues. Results from the current study cannot determine which of these processes is occurring developmentally. Children wearing CI did show less weight given the dominant cue than NHC for the fricative and the stop consonant contrasts. Children wearing a CI and NHC used similar perceptual cue weighting strategies, even though the language abilities of each group were different. The integration of cues was not significant for children wearing CI for either consonant contrast.
 XML Download