

 PDF
PDF ePub
ePub Citation
 Print
Print


Since its first introduction into clinical practice in the early 1990s, endovascular stent graft repair of abdominal aortic aneurysm (AAA) has rapidly progressed following an improved understanding of the strengths and limitations of the various devices that are used for this procedure and the properly selected patient populations (1-4). Application of this technology is still limited to the patients with suitable proximal and distal sealing zones. A short proximal neck remains a challenge for conventional infrarenal or suprarenal endovascular repair, and this problem has been addressed by the development of the fenestrated endovascular grafts (5-7).
The fenestration involves creating an opening in the graft fabric to accommodate the orifice of the vessel that's targeted for preservation. In most of the situations, fixation of the fenestration to the renal arteries and the other visceral arteries can be done by implanting bare or covered stents across the graft-artery ostia interfaces. However, there are concerns about the loss of the target vessel as a result of the fenestrated technique. Moreover, as the stents are normally flared with the angioplasty balloon to secure the fenestration to the aortic orifice, there exists the possibility that distortion or deformity of the implanted stents could occur. Therefore, understanding the 3D relationship of the fenestrated vessels and the intraluminal stents following fenestration will aid endovascular specialists to accurately evaluate how the fenestrated vessel stents are situated within the aorta. In this pictorial review, we present our preliminary experience with utilizing multislice CT (MSCT) angiography, and specifically 3D visualizations, for assessing the fenestrated endovascular grafts in 14 patients who were diagnosed with AAAs. We are particularly interested in investigating the potential of 2D and 3D visualizations for following up fenestrated endovascular grafts. This is because the diagnostic value of MSCT angiography for conducting the pre-operative planning is similar to that for planning the infrarenal and suprarenal fixation of stent grafts, and the latter has been previously reported on (8).
Patient Data and the Multislice CT Scanning Protocol
Fourteen patients (13 males and 1 female, mean age: 75 years, age range: 63-86 years) who were diagnosed with AAA that was unsuitable for conventional endovascular repair received fenestrated endovascular grafts, and these patients were included in this study. All the imaging data was obtained with using 16- or 64-slice CT scanners (Light-Speed scanner, GE Medical Systems, Milwaukee, WI). The tube voltage and current were between 120-140 kV and 250-500 mAs, respectively. The section thickness was 0.625 mm in eight patients and this was 1.25 mm in the remaining six patients. The pitch value ranged from 0.6-1.0, and the reconstruction interval was 0.4 mm for a section thickness of 0.625 mm and the reconstruction interval was 0.625 mm for a section thickness of 1.25 mm. All of the MSCT angiography scans were performed with an intravenous injection of 100-120 ml of non-ionic contrast media (Ultravist® 300, Schering, Berlin, Germany), followed by a 40-60 ml saline chaser at a flow rate of 3-4 ml/sec. The scan was started using a bolus tracking technique with a threshold of 150 HU over baseline. Planning of the fenestrated procedures was performed by a group of physicians and medical specialists who used Terarecon software; this software was installed at Cook R & D, Western Australia. The original DICOM (Digital Imaging and Communications in Medicine) data was transferred to a separate workstation equipped with a Analyze V 7.0 (AnalyzeDirect, Inc., Lexana, KS) for generating the 3D reconstructed images, including the multiplanar reformation, the shaded surface display, the maximum-intensity projection, the volume rendering and the virtual intravascular endoscopy. Analysis of the images was focused on visualizing the fenestrated vessel stents in terms of the appearances (both the intraluminal and extraluminal) and the protrusion of the stents into the abdominal aorta.
Type of Fenestrated Stent Grafts
The types of fenestration used in our study include the scallop (standard and double width scallop) fenestration and the large and small fenestrations. The fenestrations were constructed to match the aortic ostial diameter and to maximize the sealing zone. The small fenestration had a width of 6 mm and a height between 6 and 8 mm. The ostia for the small fenestrations were placed between the stent struts of the aortic device to allow unrestrained access into the visceral artery. The large fenestrations had greater diameters between 8 and 10 mm, with a strut crossing the fenestration. The standard scallop fenestrations had a minimum width of 10 mm and a height that ranged from 6 to 12 mm, while the double width scallop fenestrations were 20×20 mm in dimension. Figure 1 illustrates the design options for the types of fenestrations employed in this study.
Fenestrated endovascular grafts were deployed in 45 arterial branches: scallop fenestrations were placed in nine aortic branches (5 in the celiac axis and 4 in the superior mesenteric artery), large fenestrations were placed in 10 aortic branches (1 in the celiac axis and 9 in the superior mesenteric artery) and small fenestrations were placed in 26 arterial branches (all bilateral renal arteries). The width and height for the scallop fenestration was 10×12 mm for seven vessels and 20×20 mm and 20×12 mm (double width scallop fenestration) for the other two vessels, respectively. The large fenestrations were 10×10 mm for three of the vessels and 8×8 mm for the other seven vessels. The small fenestrations measured 6×8 mm for all the vessels. Thirty-six stents were inserted into the fenestrated vessels with the majority being placed in the renal arteries.
2D/3D Reconstructed Visualizations
2D Axial Images
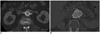
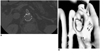
The conventional 2D axial imaging is used for the routine image visualization during the follow-up of endovascular repair for an AAA, whether it is infrarenal fixation, suprarenal fixation or fenestrated endovascular repair. The axial images are useful to demonstrate the fenestrated vessels and the patency of the stents inserted into the fenestrated vessels, as well as the protrusion of the stents into the aortic lumen (Fig. 2). However, it is difficult to appreciate the 3D relationship between the stent grafts and the aortic branches on 2D axial images, and this is the main limitation of this 2D type of visualization. Thus, the 2D or 3D reconstructed visualizations are required to complement the 2D imaging to obtain additional information.
Multiplanar Reformation
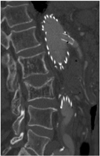
The multiplanar reformation (MPR) images are most commonly generated to demonstrate the relationship between the fenestrated vessel stents and the aortic branches by providing different views (Fig. 3), and especially the views in patients with tortuous aneurysms. Moreover, the MPR visualization enables assessing the intraluminal portion of the fenestrated vessel stents with regard to the length of the stent protrusion. However, similar to the 2D axial images, MPR fails to provide information about the intraluminal appearance of the stent wires, which is a one of the limitations of this visualization technique. Another limitation of MPR is that a number of reconstructed views are required to demonstrate the entire aortic aneurysm and the vessel branches (8). Despite these limitations, MPR is still a very valuable visualization tool for following up fenestrated stent grafting.
Surface-Shaded Display
Surface-shaded display (SSD) provides a 3D demonstration of the fenestrated stent grafts and the aortic branches; however, as described previously (8, 9), the SSD image quality is significantly affected by the high density stents, and so reliable visualization of the fenestrated vessel stents is limited to a great extent (Fig. 4). Although it allows the reader to appreciate the 3D relationship between the fenestrated stent grafts and arterial branches, SSD has only a small role to play for following up fenestrated repair of an AAA.
Maximum-Intensity Projection
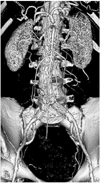
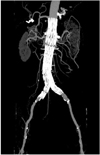
Maximum-intensity projection (MIP) has been widely recognized as one of the most useful visualizations for imaging endovascular repair of an AAA as it allows visualization of the stent grafts in relation to the aortic branches, and it additionally allows confirming the presence of endoleaks and stent migration (10). The fenestrated vessels and stents can be clearly demonstrated on MIP images (Fig. 5), yet the intraluminal portion of stents can't be accurately visualized due to overlapping of the vessel stents with the main body of the stent grafts (Fig. 5). Moreover, high density structures such as calcification or bones can overlap the metal components of the fenestrated stents, and so manual or semi-automatic editing is required to remove these unwanted structures.
Volume Rendering
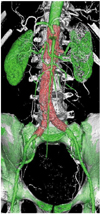
In contrast to SSD and MIP, volume rendering (VR) uses all of the information contained inside a volume dataset, and this allows production of more meaningful images. By assigning a specific color and opacity value of every attenuation value of the CT data, groups of voxels are selected for display. As shown in Figure 6, the aortic branches and the fenestrated vessel stents are marked with different colors with VR visualization, and this visualization is believed to enhance the readers' understanding of the fenestrated stent grafts in relation to the arterial branches. However, the image quality of VR is determined by the original 2D source images.
Virtual Intravascular Endoscopy
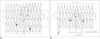
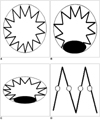
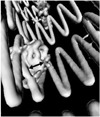
Previous studies have demonstrated the usefulness of virtual intravascular endoscopy (VIE) for following up the transrenal fixation of an AAA (8, 10-13). The appearance of fenestrated stent wires was characterized into four types, based on our early results (14) (Fig. 7). These four types include type I with a circular appearance (Fig. 7A), type II has a circular appearance with a balloon flaring effect at the inferior portion of the stent wires (Fig. 7B), type III has an elliptical appearance with a flaring effect at the inferior portion of the stent wires (Fig. 7C) and type IV shows no intraluminal appearance of the stent wires into the aortic lumen with only markers displayed (Fig. 7D). Type IV was commonly seen for the type of scallop fenestrations (both standard and double width scallops) as the scallops are not stented. According to our preliminary experience, VIE was found to be useful for demonstrating the intraluminal appearance of fenestrated vessel stents (Fig. 8) and the protrusion of stents into the aortic lumen (Fig. 9). With the aid of VIE, any post-procedural abnormality resulting from the fenestrated procedure could be identified (Fig. 10), although this needs further validation in a large study.
Virtual intravascular endoscopy is considered to be a promising technique for viewing fenestrated stent grafting as it provides a unique demonstration of the intraluminal views of fenestrated stents and the aortic ostium. Although there is no direction relationship between the characterization of the fenestrated stent appearance and clinical impact, we think that VIE visualization is valuable for endovascular specialists to identify any distortion or deformity of the fenestrated stents that's caused by the fenestration procedures. Yet the blooming or windmill artifacts arising from the metal stents interfere with accurate evaluation of intraluminal stents in terms of the stent's protrusion and configuration.
Factors Affecting the Multislice CT Image Quality
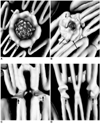
The image quality of the 2D and 3D visualizations is mainly determined by the section thickness selected for the MSCT scanning. A wide section thickness results in typical windmill artifacts that affect the visualization of the fenestrated vessel stents. Figure 11 shows an example of MSCT angiography that was acquired with a section thickness of 2.5 mm, and apparent windmill artifacts are present in the superior mesenteric artery stents on the axial images. The corresponding VIE images of the fenestrated renal and superior mesenteric stents were also affected, as is shown in Figure 12. The methods to minimize the artifacts involve choosing the appropriate MSCT scanning protocols with a thinner section thickness or using postprocessing techniques to reduce the degree of the artifacts.
DISCUSSION
The short to mid-term outcomes of fenestrated endovascular grafts are currently satisfactory, yet the long-term results are not fully understood (15, 16). Our previous studies provided our initial experience with 3D visualizations (8-15), and especially VIE, for the endovascular repair of AAA, yet the detailed description of the various visualization tools used for fenestrated repair has not been previously published. In the current study, we presented a comprehensive overview of the various 2D and 3D visualizations in a group of patients who were treated with fenestrated stent grafts. It is expected that these visualizations will assist endovascular specialists to accurately evaluate the treatment outcomes of fenestrated stent grafting by making judicious use of these visualization tools or by optimizing their follow-up procedures. While the 2D axial images are always reviewed first during routine follow-up, we think some kind of 3D reconstructions should be included as they provide additional information to endovascular specialists. Specifically, the MPR and VIE visualizations are recommended for inclusion into the imaging follow-up of fenestrated endovascular grafts with the aim of identifying the appearance of the fenestrated vessel stents in relation to the aortic artery branches. SSD has a very small role to play in this aspect as the image quality is affected by the high density of stents to a great extent. The MIP and VR visualizations have demonstrated their potential to be applied in particular areas of the follow-up of fenestrated endovascular grafts when compared to the 2D axial images. MIP could be used as an additional visualization tool in patients who are suspected of presenting with stent graft migration, as an early study reported the usefulness of this technique for viewing suprarenal fixation of stent grafts (10), while VR is superior to the other visualization tools for demonstrating the 3D relationship between stent grafts and the aortic branches.
Technical improvements such as the MSCT scanning protocols or the image postprocessing algorithms are necessary to minimize the artifacts caused by the stent wires and to ensure the image quality of the 3D reconstructed images. This is also important for generating images with the stent wires' thickness being similar to the actual diameter as the stent wires were overestimated as being 1.5 to 2.0 mm in our study. Due to the protrusion of certain length of stents into the aortic lumen, any interference with the renal blood flow by the fenestrated vessel stents deserves to be investigated.
In conclusion, based on our experience, 3D reconstructions offer additional information when compared to the 2D axial images for assessing post-fenestrated stent grafting. Reliably recognizing the diagnostic value of each reconstruction is of paramount importance for endovascular specialists to effectively utilize MSCT angiography as some of the postprocessing is time-consuming. While the 2D axial and MPR images are routinely used in clinical practice, 3D reconstructions are recommended for the follow-up of fenestrated endovascular grafts. This includes the VIE visualization for accurately assessing the treatment outcomes of fenestrated vessel stents in terms of the intraluminal appearances and stent protrusion, and using MIP and VR for demonstrating the 3D relationship of the vessel stents and the aortic branches. Based on our research findings, we recommend the following visualization protocols for following up patients who are treated with fenestrated stent grafts. It is expected that these recommendations will improve the current follow-up procedures with the inclusion of various visualization tools.


 XML Download