

 PDF
PDF ePub
ePub Citation
 Print
Print


INTRODUCTION
Retaining skeletal muscle mass is one of the important health issues for proper physical function and metabolic balance in the elderly [12]. Even in young populations, skeletal muscle mass is related to disease susceptibility and affects metabolic responses to medical or diet therapies under disease conditions [345678]. Bone and skeletal muscle mass and strength peak in early adulthood before declining in elderly [910]. Thus, skeletal muscle mass needs to be preserved by both attenuating loss and gaining mass in early adulthood. Hence, assessing changes in skeletal muscle mass, rather than the prevalence of sarcopenia, a substantial loss of skeletal muscle, is a more practical approach to ascertain the factors affecting skeletal muscle mass.
Diet is a major factor affecting skeletal muscle mass [2611]. However, interpreting the relationship between nutrient intake and skeletal muscle mass is somewhat complex because most studies involve subjects with metabolic dysfunction, which confounds changes in nutritional status or skeletal muscle mass. For example, the prevalence of sarcopenia was higher in overweight or obese subjects whose average body mass index (BMI) was up to 37 kg/m2, and was positively correlated to changes in fat-free mass [121314]. High protein intake increased lean body mass and reduced insulin resistance [15]; however, other study showed an association between high protein intake and an increased prevalence of diabetes [16], leading to the disintegration of skeletal muscle. Our recent study reported a positive correlation between skeletal muscle mass and energy consumption. However, the composition of single macronutrients had a very weak or no association with skeletal muscle mass [17].
Conducting studies of single foods or nutrients in relation to disease prevalence has been problematic due to the high degree of correlation among dietary constituents. In this situation, isolating the particular effects of a single food or nutrient becomes a serious methodological problem. Moreover, foods and nutrients are more likely to act in synergy rather than in a simple additive fashion [1819] and they often have interactive and cumulative effects as part of a whole diet. Thus, it is relevant to investigate overall dietary patterns to explain the effects of nutrition on health. In recent decades, many studies have utilized dietary pattern analysis to investigate the relationship with health outcomes [202122]. Of many approaches to explore dietary patterns, factor analysis is a variable-merging method used to reduce the number of variables on food intake data to describe the major sources of variation in the diets of study populations. For instance, energy-dense and nutrient-poor diets were inversely associated with bone health [23] while vegetable and fruit consumption was associated with cancer incidence [2024]. Though the importance of adequate muscle mass in health outcome is relatively well-established, the association of diet pattern with skeletal muscle mass has been rarely reported [2526]. Also, the accumulation trend of skeletal muscle mass and anthropometric condition differs between sexes [272829]. Several recent studies demonstrated a sex difference in factors affecting skeletal muscle mass [1730]; therefore, changes in skeletal muscle mass in response to certain dietary patterns will differ by sex.
Therefore, we performed factor analysis to identify dietary patterns in Korea National Health and Nutrition Examination Surveys (KNHANES) participants. We then investigated if certain dietary patterns are related to changes in skeletal muscle mass and if this relationship differs by sex.
MATERIALS AND METHODS
Study subjects
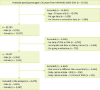
Data were extracted from the KNHANES, a nationwide survey directed by the Korean Centers for Disease Control and Prevention (KCDC) in the Ministry of Health and Welfare to investigate the health status of the Korean population. By combining data of four years from the KNHANES 2008, 2009, 2010, and 2011, a total of 37,753 subjects were identified. At the first screening, 22,793 subjects aged 30 years or older and had complete demographic data were selected (Figure 1). Subjects aged between 20 to 30 years were excluded to avoid changes in muscle mass of subjects who were still in the growth period. Subjects were excluded for missing dual-energy X-ray absorptiometry (DXA) (n = 6,617), BMI (n = 135), biochemical parameters (n = 749), or dietary record (n = 1,720) data. In addition, subjects with on-going medication (n = 735), whose dietary record differed from that of a usual diet as reported on the questionnaire (n = 2,646), and whose total energy intake was lower than the resting energy expenditure (n = 206) or higher (> 1.5-fold) than recommended dietary allowance set by Korean dietary reference intake [31] (n = 913) were excluded. This study finally analyzed data from 9,072 subjects, consisting of 3,805 men and 5,267 women. The protocols conducted by the KNHANES were permitted by the Institutional Review Board (IRB) of the KCDC (IRB No. 2008-04EXP-01-C, 2009-01CON-03-2C, 2010-02CON-21, and 2011-02CON-06-C).
Assessment of lean body mass and calculation of skeletal muscle index
To assess lean body mass, whole-body DXA scans were performed using a fan-beam densitometer (Discovery-W; Hologic Inc., Bedford, MA, USA). The accuracy of the DXA calibration in the KNHANES was reported in earlier studies [3032]. Appendicular lean body mass (ALM) was determined by combining the lean body masses of both arms and legs. In this study, we used the skeletal muscle mass index (SMI) to estimate the skeletal muscle mass relative to BMI. The calculation of SMI complied with the Foundation for the National Institutes of Health, as previously reported [1733]. Briefly, the equation for calculating SMI was as follows:
Collection of diet records and data preparation for factor analysis
Dietary data were collected by a 24-hour recall to assess food and nutrient intake. To identify dietary patterns by factor analysis, the recorded food items were categorized into 21 food groups based on secondary food variables according to the KNHANES guidelines [32]. Grain products were divided into rice and whole grains. The vegetable group was divided into vegetables including mushrooms and kimchi (traditional fermented salted vegetables). Kimchi was presented as a single group because this traditional side dish is frequently eaten by Koreans but has high sodium levels, unlike other vegetables. The fish group included squid and shellfish such as clams and shrimp. Meat was divided into processed or red meat, beverages were divided into alcoholic or non-alcoholic, and the oil was divided into animal fat and plant oil. The frequency of alcohol consumption was categorized according to the number of servings per day; high (≥ 2 servings/day for men and ≥ 1.5 servings/day for women) or low (< 2 servings/day for men and < 1.5 servings/day for women). Energy intake from alcohol was calculated as previously reported [17].
Measurement and assessment of other covariates
Household income was reported as quartile of average household monthly net income in the KNHANES as low, low-middle, middle-high, or high. Education was categorized as less than or above high school. Smoking status was incorporated in the analysis and participants who reported to have ever smoked more than five packs of cigarettes during their lifetime were classified “smoker,” while those who reported no history of smoking were coded as “non-smoker.” Physical activity was classified and ‘active’ or ‘non-active.’ Participants who met the criteria for mild strength physical activity for a minimum of 30 minutes at a time for more than five days per week were considered “active”; otherwise, participants were classified as “non-active.” The biochemical variables reported in this study, including total cholesterol, total triglyceride, and fasting plasma glucose levels, were obtained through a chemistry analyzer (Hitachi 7600; Hitachi, Tokyo, Japan) and the accuracy of measurement was reported by the KCDC [32].
Statistical analysis
SAS version 9.4 (SAS Institute Inc., Cary, NC, USA) was used for all statistical analysis in this study. Dietary patterns were identified by principal component analysis, one of the main approaches in factor analysis [2034]. The number of dietary patterns was determined based on Eigenvalues > 1.0, a breakpoint of the scree plot, and interpretability of the principal components. The Varimax rotation function was used to obtain a simpler correlation matrix. The factor scores for each dietary pattern were then computed by summing the amount of food a subject consumed and the standardized factor scores for each designated food group. Items were loaded on a factor when the absolute value of the correlation was higher than 0.20. Inter-item reliability for each factor was assessed by Cronbach's alpha coefficients. Labeling of each factor followed the combination of food groups where the highest value was obtained in Cronbach's coefficient alpha within the factor. The SMI values of all subjects were log-transformed for regression analysis. The data of continuous variables were presented as means with standard errors and categorical variables as frequencies with percentages.
Multivariable linear regression analyses were performed to investigate the relationship between dietary patterns and SMI. After initial screening of the valid dietary patterns that were significantly associated with SMI after adjusting for age and BMI, the factor scores of the selected dietary patterns were stratified by quartile scales. The subjects were then categorized and compared according to the quartiles of factor scores. Analysis of variance (ANOVA) was performed to estimate the differences in continuous variables among the quartiles of factor scores. Differences in the frequencies of the categorical variables were assessed by Rao-Scott chi-square tests without adjustment. Weighting was performed for all analyses and subgroups of interest were analyzed within assigned domain codes. Then the first multivariable linear regression model was further adjusted. Before adjusting for the variables in the regression model, the collinearity among variables was tested as previously described [17]. Using the linear regression model beta coefficient, the 95% confidence intervals (CIs) for SMI according to the quartiles of dietary pattern factor scores were estimated by setting the lowest quartile as reference. All analyses were performed separately by sex. The significance of the data was defined as p < 0.05.
RESULTS
Dietary patterns identified by principal components factor analysis
The general characteristics of all study subjects are described in Supplementary Table 1. From all study subjects, three primary dietary patterns were identified by factor analysis (Table 1). These three factors explained 21.0% of the total variance in food intake amount. The first factor demonstrated the highest factor loadings for vegetables, fish, and seasonings. This dietary pattern was the first factor, with similar factor loadings even in the separate analyses for men and women (Supplementary Tables 2 and 3). The main food groups in the second factor were flour, eggs, and meat. The third factor was mainly comprised of rice and kimchi. We defined the first factor as “Vegetables and Fish (VF)”; the second as “Flour, Eggs, and Meat (FEM)”; and the third as “Rice and Kimchi (RK).” The variances explained by these factors were 9.0%, 6.0% and 6.0% for VF, FEM, and RK, respectively. While the VF pattern showed positive factor loadings for the main food groups, the FEM and RK patterns both demonstrated large (less than −0.3) negative factor loadings for the whole-grain and potato groups and FEM further revealed negative factor loadings for the milk, flour, and fruit groups (Table 1).
Table 1
Dietary patterns with factor loadings* derived from the amount of food intake
Screening of regression coefficients for dietary pattern scores on skeletal muscle mass
Table 2 shows the degrees of simple linear associations between the dietary pattern scores and skeletal muscle mass as SMI values. In both men and women, all three dietary pattern scores were significantly associated with skeletal muscle mass. However, the associations of skeletal muscle mass with the FEM or RK patterns disappeared after adjustment of the regression model for age and BMI in both men and women. The association between VF pattern and skeletal muscle mass remained after adjusting for age and BMI in both men (β = 0.5224; 95% CI, 0.3533–0.6915) and women (β = 0.2799; 95% CI, 0.0856–0.4743).
Table 2
Regression coefficients for dietary pattern scores on skeletal muscle mass

Justification of the VF pattern by the amount of food intake
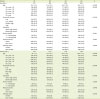
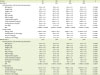
Since the VF pattern was the only pattern common in both sexes and the VF pattern scores derived from food intake was significantly associated with skeletal muscle mass, we further categorized the study subjects by the quartile scale of the VF pattern scores derived from the amount of food intake. As shown in Table 3, we initially justified the VF pattern by assessing the intake amount of each food group according to VF quartiles. As expected, the intake amount of vegetables and fish (VF) increased up to 4.3- and 6.7-fold in men and 5.2- and 5.7-fold in women, respectively, with increasing VF quartile, indicating that those main food groups were well-fitted to the VF pattern. The intake amounts of other minor food groups in the VF pattern including white rice, whole grains, potatoes, beans, nuts, kimchi, seaweed, fruits, plant oil, and seasonings gradually increased while those of the flour group gradually decreased with increasing VF quartile in men and women (p < 0.0001). These data suggest that subjects with high scores in the VF pattern tended to have healthy diets. However, except for seasonings, the fold-changes of intake amounts of those food groups were not as high as those for vegetable or fish intake. When the intake amounts of these foods were computed as percent energy intake, the change in the intake amounts of the main food groups of the VF pattern was proportional to the increase in VF quartile (Supplementary Table 4). These data suggest that the VF pattern derived from food intake amount is a valid dietary pattern for the subjects in this study and that the VF pattern scores acted in accordance with the percent energy intake as well as the food intake amount of the subjects.
Table 3
Average intake amount (g) of each food group according to the quartile of vegetables and fish pattern scores
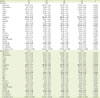
Values are presented as mean ± standard error. For men, Q1: factor score < −0.0135, Q2: −0.0135 ≤ factor score < 0.0009, Q3: 0.0009 ≤ factor score < 0.0187, and Q4: 0.0187 ≤ factor score; for women, Q1: factor score < −0.0199, Q2: −0.0199 ≤ factor score < −0.0093, Q3: −0.0093 ≤ factor score < 0.0052, and −Q4: 0.0052 ≤ factor score. The p values are from analysis of variance for assessing the trend of difference among quartiles. Bold letters: Intake amount of foods which compose main food groups in VF pattern.
VF, vegetables and fish.
Characteristics of subjects by quartiles of VF pattern scores
We further categorized the health-related parameters of the subjects according to VF quartiles. As shown in Table 4, the mean age of the study subjects decreased as with increasing VF quartile in both men and women. Many aged subjects were in the lowest VF quartile and the proportion of aged subjects (≥ 50 years) declined as the VF quartile increased (p < 0.0001). Men and women with high VF pattern scores had higher household incomes and were more likely to have a higher education status (p < 0.0001). The distribution of physically active subjects did not differ among the VF quartiles in both men and women. The ratio of smokers in each quartile did not differ significantly among quartiles in men; however, women in the lowest VF quartile tended to be current smokers (p < 0.0001). The ratios of subjects who drank more than 1–2 servings of alcohol per day did not differ significantly across the quartiles of SMI in both men and women.
Table 4
Characteristics of demographic and life style variables according to the quartile of vegetables and fish pattern scores
Values are presented as mean ± standard error or number of frequency (%). For men Q1: factor score < −0.0135, Q2: −0.0135 ≤ factor score < 0.0009, Q3: 0.0009 ≤ factor score < 0.0187, and Q4: 0.0187 ≤ factor score; for women, Q1: factor score < -0.0199, Q2: −0.0199 ≤ factor score < −0.0093, Q3: −0.0093 ≤ factor score < 0.0052, and Q4: 0.0052 ≤ factor score. The p values are from analysis of variance for continuous variables and Rao-Scott chi-square test for categorical variables for assessing the trend of difference among quartiles.
*A serving size of alcohol intake: one cup (50 cc) of soju or one glass of beer (200 cc), “≥ 1–2 serving/d” corresponds to ≥ 2 serving/day for men and ≥ 1.5 servings/day for women, “< 1–2 serving/d” corresponds to < 2 serving/day for men and < 1.5 servings/day for women.
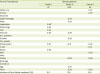
Anthropometric and biochemical indicators according to VF quartile are shown in Table 5. Both men and women in the higher VF quartile had higher body weight, height, and ALM values than those in the lowest VF quartile. BMI increased with increasing VF pattern score in men (p = 0.0089) but the change in BMI by VF quartile did not reach statistical significance in women (p = 0.0769). In women, the change in waist circumference among VF quartiles appeared to be significant but the mean value of waist circumference was not parallel to the order of VF quartiles. While systolic blood pressure tended to decrease at lower VF quartiles in both men (p = 0.0080) and women (p < 0.0001), diastolic blood pressure did not differ across VF quartiles in all subjects. Women in the higher VF quartile tended to have lower total blood triglyceride (p = 0.0033) and cholesterol (p = 0.0352) levels. In contrast, the mean total triglyceride and cholesterol values did not differ significantly across the quartiles. The change in fasting blood glucose did not differ significantly among VF quartiles in all subjects.
Table 5
Anthropometric and biochemical indicators and energy intake according to the quartiles of vegetables and fish pattern scores
Values are presented as mean ± standard error. Percent intake from total energy intake, for men, Q1: factor score < −0.0135, Q2: −0.0135 ≤ factor score < 0.0009, Q3: 0.0009 ≤ factor score < 0.0187, and Q4: 0.0187 ≤ factor score; for women, Q1: factor score < -0.0199, Q2: −0.0199 ≤ factor score < −0.0093, Q3: −0.0093 ≤ factor score < 0.0052, and Q4: 0.0052 ≤ factor score. The p values are from analysis of variance for assessing the trend of difference among quartiles.
WC, waist circumference; SBP, systolic blood pressure; DBP, diastolic blood pressure; ALM, appendicular lean body mass; SMI, skeletal muscle index.
Total energy intake increased with increasing VF quartile (Table 5). As expected, the values of energy-producing nutrient, carbohydrates, fat, and protein intake paralleled the amount of total energy intake throughout the quartiles (data not shown). The intake ratio of energy from carbohydrates to total energy at the lowest VF quartile in men and women were 68.6% and 72.2%, respectively but decreased to 64.4% and 69.9% at the highest quartile (p < 0.0001). The highest VF quartile had a higher intake ratio of fat to total energy compared to that of the lower quartiles (p < 0.0001). The intake ratios of protein to the total energy in Q1 were 12.3% and 12.4% for men and women, respectively, and increased to 15.9% and 15.5%, respectively, in the highest VF quartile.
Estimation of change in skeletal muscle mass according to the dietary pattern score
We examined the association of VF pattern score with the sarcopenia index by incorporating age and BMI as covariates in the linear regression model. The subjects in the highest VF quartiles had a higher SMI than those in the reference group (the lowest VF quartile) (p < 0.0001) (Table 6). When total energy intake was further adjusted in the regression model, the change in skeletal muscle compared to the reference group gradually increased with increasing quartile. We also designed sex-specific models by adjusting for household income, education, and systolic blood pressure for men and further adjusting for smoking status, waist circumference, total triglycerides, and total cholesterol for women based on the characteristics of subjects according to the quartile of dietary pattern scores. No significant change in skeletal muscle was observed in women while the coefficient of change in SMI increased up to 4-fold with increasing VF quartile in men. Analysis of the main food groups belonging to the VF pattern showed that neither vegetables nor fish was significantly associated with the change of skeletal muscle (data not shown).
Table 6
Estimated change of skeletal muscle mass according to the quartile of dietary pattern scores
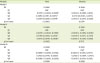
Beta coefficient with 95% confidence interval was shown. Model I: adjusted for age and body mass index, Model II: Model I + energy intake, Model III: Model II + household income, education, systolic blood pressure for men, Model II + household income, education, systolic blood pressure, waist circumference, total blood triglyceride, total cholesterol for women. For men, Q1: factor score < −0.0135, Q2: −0.0135 ≤ factor score < 0.0009, Q3: 0.0009 ≤ factor score < 0.0187, and Q4: 0.0187 ≤ factor score; for women, Q1: factor score < −0.0199, Q2: −0.0199 ≤ factor score < −0.0093, Q3: −0.0093 ≤ factor score < 0.0052, and Q4: 0.0052 ≤ factor score.
*p < 0.05, †p < 0.01, ‡p < 0.001 compared to reference quartile (Q1) within same sex.
DISCUSSION
This study identified three dietary patterns, VF, FEM, and RK, by factor analysis. Of these patterns, VF was the main factor in factor analysis for all subjects and in factor analyses for men and women separately. The VF pattern was associated with increased skeletal muscle mass only in men. This association remained after adjusting for confounders including age, household income, education, BMI, total energy intake, and systolic blood pressure, indicating that the association was independent of these covariates. The VF pattern was not significantly associated with skeletal muscle mass in women, suggesting the presence of sex differences in changes in skeletal muscle mass in relation to diet.
The foods which belonged to the VF pattern with positive loadings included vegetables, fish, whole grains, potatoes, nuts, and fruits. In contrast, meats and alcohols had negative loadings in this pattern (data not shown). The amount of consumption of the food groups with positive factor loadings increased according to increasing VF quartile. Therefore, the main food composition of the VF pattern in this study was like that of other diets which have been reported as healthy [2435363738]. For example, the Mediterranean diet, mainly composed of vegetables, fruits, and plant oils with moderate intake of fish and low intake of animal foods including meat, saturated fat, and dairy, has shown several health benefits [363738]. In addition, the diet approach to stop hypertension contains many plant-based foods with low consumption of red meats and animal fat [39]. In line with these findings, the average systolic blood pressure value decreased with increasing VF pattern score in both men and women in the present study. Although the Cronbach's alpha coefficient was low (data not shown), the high factor loadings of seasonings in the VF pattern was likely due to the fact that vegetables are often consumed with sauces or dressing rather than as a raw food without seasoning. Seasonings made from soybean or herbs may have bioactive nutrients and synergistic effects with vegetables on health outcome. In addition, subjects with high VF pattern scores tended to comply with ideal diet patterns with proper energy distributions (carbohydrate: protein: fat), which might contribute to the beneficial relationship between VF pattern and skeletal muscle mass in this study.
Based on the many health benefits of plant-based diets and fish consumption, recent studies showed that a diet containing VF or related food items was positively associated with skeletal muscle health [25262740]. A healthy diet pattern composed of vegetables, legumes, and whole grain was positively associated with lower limb muscle strength in Australian women aged 60 years and older [40]. Fish consumption was associated with increased grip strength in UK women aged 59 to 73 years [27]. Mediterranean diet scores were positively associated with fat-free mass in UK women [25], but the study did not find any significant association between a single food group (vegetables, fish, or fruits) and skeletal muscle mass or strength. The effects of diets mainly composed of VF on skeletal muscle in previous studies are similar to the results of the present study that the VF pattern was positively associated with skeletal muscle in men but a single food item which belonged to the VF pattern was not associated with skeletal muscle mass (data not shown). Our recent study also reported a significant association between total energy intake and increased skeletal muscle mass in Korean men but no association between a single major nutrient and skeletal muscle mass [17]. Taken together, the VF pattern, as a combined approach for a healthy diet rather than its individual food or single nutrient, had a positive effect on skeletal muscle mass.
Although our findings are concordant with those of previous studies showing a positive relationship between the VF pattern and skeletal muscle mass, the lack of association between the dietary pattern and skeletal muscle mass in women in our study differs from previous findings. A study including Iranian subjects found no association between the Mediterranean diet pattern and skeletal muscle mass or the prevalence of sarcopenia in either men or women [36]. Other previous studies including women demonstrated a positive effect of vegetable-oriented diets on skeletal muscle health [252740]. Our previous study showed an association between skeletal muscle mass and total energy intake in both men and women, but the association was more pronounced in men than that in women [17] and a study including Chinese adults reported more favorable beneficial effects of a Mediterranean diet on skeletal muscle mass in men than those in women [26]. Except for two studies conducted on Korea [17] and China [26], most studies on the relationship between diet pattern and skeletal muscle health included only subjects at least 59 years of age. Because age and body mass are strong determinants of skeletal muscle mass, the younger subjects in the present study had ethnically different anthropometric conditions compared to those of previous studies [252740], which may reveal different results. Another explanation for the differences is that the carbohydrate consumption of the subjects in this study was greater than 65% of the total energy intake even at the highest VF quartile and women tended to have a higher energy intake from carbohydrates compared to that in men. Carbohydrate intake is closely related to the risk of metabolic dysfunction such as dyslipidemia, diabetes, and obesity, which are significant confounders for skeletal muscle mass [344142]. In the present study, the changes in metabolic parameters such as waist circumference, total triglyceride, and cholesterol by VF quartile were larger in women than those in men, which may explain the lack of association between the VF pattern and skeletal muscle mass in women. Furthermore, studies on the relationship between diet patterns and health outcome have consistently reported heterogeneous health behaviors and diets of women when defining women-specific dietary pattern [2024]. Also, fruit was not included in the VF patterns in this study. Therefore, isolating the distinctive effect of VF pattern on skeletal muscle mass may be challenging in women.
To our knowledge, this is the first study to use a nationwide survey to investigate the associations between dietary patterns and skeletal muscle mass in Koreans including both younger (30s and 40s) and older (50 years and older) adults, while previous studies mostly focused on older adults [11017]. Previous studies have assessed the relationship between nutrition or diet and changes in skeletal muscle mass by comparing the prevalence of an extreme status such as a substantial loss of muscle mass which has already occurred [4736]. Especially in healthy populations, sarcopenia is usually a gradual process and the gain or loss of skeletal muscle mass may take a few months to years [129]. Hence, assessing changes in skeletal muscle mass rather than the ratio of sarcopenia or non-sarcopenia is a reliable method to identify factors affecting skeletal muscle health. Moreover, our findings have clinical relevance as the scale of association of the VF pattern with skeletal muscle was up to 4.6-fold higher the loss of skeletal muscle per year after accounting for covariates (data not shown). Subjects with higher adherence to the VF pattern may also have a healthy lifestyle; although lifestyle factors were adjusted, residual confounders cannot be ruled out, especially with 24-hour recall data. Therefore, these findings require replication in a different pattern analysis such as index or cluster analysis [20]. The health benefits of vegetable-oriented diets engage various mechanisms such as anti-inflammatory and anti-oxidative properties and microbiome changes [194344]; however, those mechanisms are rarely evaluated in population-based studies. Thus, markers that can explain the specific mechanisms for the association between diet and skeletal muscle health require further investigation.
The dietary patterns identified by factor analysis were positively associated with skeletal muscle mass in Korean men but not women. The results of this study suggest that a healthier dietary pattern focused on VF intake may help to increase skeletal muscle mass in men. These findings can be used to develop diet guidelines for public health perspectives and to plan dietary intervention trials for skeletal muscle health.
CONCLUSION
This study performed diet pattern analysis to investigate the effect of certain diets on skeletal muscle mass. Three dietary patterns, VF, FEM, and RK were identified and the VF pattern commonly appeared in factor analyses for men and women separately. The level of skeletal muscle mass increased with increasing the quartile of VF scores in Korean men after adjusting for age, household income, education status, BMI, total energy intake, and systolic blood pressure. However, no association was found between VF quartiles and skeletal muscle mass in women. These results highlight that the healthy diet pattern characterized by VF is beneficial for increasing skeletal muscle mass independent of body size and total energy intake. Though the results require validation in different types of pattern analyses, separate consideration for men and women is warranted to assess the relationship between diet and skeletal muscle mass.
 XML Download