

 PDF
PDF ePub
ePub Citation
 Print
Print


Introduction
Malnutrition is found in 43% to 88% of critically ill patients [1,2] and is known to increase the length of hospital stay as well as infection and mortality rates [3]. Therefore, it is very important to evaluate their nutritional status based on the use of proper validated methods. Traditionally, the nutritional assessment in critically ill patients has been evaluated using biochemical indicators such as serum albumin, total lymphocyte count (TLC) and serum pre-albumin. Recently, however, objections have been raised against using these indicators for nutritional assessment, as such markers can be influenced by acute inflammation [4,5,6].
Bioelectrical impedance analysis (BIA) is a simple and noninvasive method which indirectly estimates body composition by sending a weak electric current throughout the body [7,8]. It has been shown that it can reliably reflect body composition and associate with patient's nutritional statuses or clinical outcomes.
Phase angle (PhA) in particular, one of the parameters of BIA that is related to cell size or integrity of the cell membrane [9], may be a suitable marker of nutritional assessment [10]. Kyle et al. demonstrated that PhA was shown to decrease with increased nutritional risk estimated by Nutritional Risk Screening 2002 or Subjective Global Assessment [9]. PhA is also useful indicator of prognosis and survival rate for patients with diseases such as human immunodeficiency virus infection [11,12], chronic renal failure [13], and liver cirrhosis [14], as well as for patients on hemodialysis [15] or peritoneal dialysis [16]. Extracellular water/total body water (ECW/TBW) is also a suitable prognostic factor for critically ill patients. Monitoring it via BIA has been shown to lower re-hospitalization and mortality rates of patients hospitalized for acute heart failure [17]. Malnutrition refers to the loss of intracellular or body cell mass and expansion of extracellular mass [18,19]. Therefore, ECW/TBW as edema index or PhA as an index of healthy body cell mass could be useful indicators for nutritional assessment.
Few studies to date have used BIA in the nutrition assessment of critically ill patients. This is because such patients are typically overhydrated and often have other common conditions that might cause errors in BIA [20]. Guidelines published by the European Society of Parenteral and Enteral Nutrition (ESPEN) suggest that this problem could be overcome to some extent by using segmental BIA or multifrequency BIA [8]. Furthermore, among BIA variables, PhA was reported to be less influenced by overhydration while being a good indicator of clinical outcome [12,21,22].
We hypothesized that BIA with high accessibility, convenience, and utility may effectively reflect the nutritional status of critically ill patients and help to meaningfully predict clinical outcomes. Hence, we compared conventional indicators of nutritional status such as serum albumin level, body mass index (BMI), and clinical outcomes with BIA results to verify their relevance in nutritional assessment and prediction of prognosis.
Materials and Methods
Patients
This study was conducted between October 2012 and February 2013 and recruited 69 patients aged 18 years and older hospitalized in an intensive care unit (ICU) at Gangnam Severance Hospital, Korea, and underwent BIA within 7 days after the admission. Based on the ESPEN guidelines [8], the following criteria were used to exclude subjects: patients with a pacemaker or implanted cardiac defibrillator; patients with a BMI > 34 kg/m2 or < 16 kg/m2; patients with any amputation; patients with abnormal physical structure; patients with ascites and/or noticeable edema; patients with skin damage on the area where the electrodes of the BIA instrument were attached; patients who underwent dialysis 20 to 30 minutes before BIA; patients who had agreed to suspension of life-sustaining treatment before BIA; and lastly, patients with serious errors in their BIA results. Among 69 enrolled patients 3 patients were excluded because one of their BIA results appeared serious error or they consented to withdrawing life-sustaining treatment before BIA measurement. Finally, 66 patients were included in this study. The need for informed consent was waived by the Ewha Woman's University Institutional Review Board because of the following reasons: the BIA results and electronic medical records at the time of measurement did not include personal identifiable information (such as name, resident registration number, and hospital registration number); the research would not have caused any harm to the subjects; and the data were analyzed retrospectively.
Demographic, anthropometric, clinical and biochemical data
Electronic hospital medical records were reviewed to collect data for each patient, including age, diagnosis, height, weight, Acute Physiology Chronic Health Evaluation II score (APACHE II score), length of stay in hospital, length of stay in ICU, duration of mechanical ventilation, and other notable characteristics. BMI was calculated as the body weight in kilograms divided by height in square meters. Serum albumin level, TLC, and hemoglobin level on the day each patient's BIA was performed were also collected from the electronic medical records.
Classification of nutritional status
Nutritional status was classified based on serum albumin level and TLC using criteria established in a previous study [23]. Patients whose serum albumin level was ≥ 3.5 g/dL and TLC was ≥ 1,400 cells/mm3 were classified into the well-nourished group, those whose serum albumin level was < 2.8 g/dL and TLC was < 1,000 cells/mm3 were classified into the severely malnourished group, and the remaining patients were classified into the moderately malnourished group.
BIA data
Inbody S10 (Biospace, Seoul, South Korea) was originally used for the measurements of medical purpose. To be prepared for the measurement, patients were in supine position as the manual of the machine. Their arms were separated from trunk and both legs were separated each other, for 30 to 45 degrees. BIA was performed with 8 surface electrodes placed on patient's thumbs and middle fingers and two sides of ankles. The BIA data gathered included intracellular water (ICW), ECW, TBW, ECW/TBW, %TBW/fat free mass (FFM), protein, minerals, soft lean mass (SLM), FFM, fat mass (FM), %body fat (%BF), skeletal muscle mass (SMM), body cell mass (BCM), and bone mineral content (BMC). PhA was calculated by using the sum of impedance and reactance of the right arm, trunk, and right leg and based on the following equation, PhA(°) = (Reactance/Resistance) × (180°/Π) [24]. The Inbody S10 device calculates various reactance and resistance values for different areas and frequencies.
Statistical analysis
Statistical analysis was performed using SPSS 20.0 for Windows (SPSS Inc., Chicago, IL, USA), with statistical significance set at p < 0.05. Results are expressed as mean ± standard deviation. Continuous variables were compared and analyzed based on the independent sample t-test and analysis of variance. Correlations were analyzed using partial Pearson's correlation analysis using age and APACHE II score as covariates. Non-survivors were excluded from the analyses related to clinical data, and any patients without exact clinical data due to transfer to/from another hospital were also excluded from the analysis of the relevant variable.
Results
The average age of the patients was 63.1, and 63.6% of them were male. Main diagnoses included cardiovascular disease (22.7%) and neurological disease (21.2%), which accounted for almost half of the patients. More than half of the patients (59.1%) used mechanical ventilation. Non-survivors accounted for 12.1% of the entire subjects. At the time of hospitalization, APACHEII score of the subjects, which is an indicator of disease severity, was 16.0 ± 7.3 point; the average length of stay in hospital 24.6 ± 18.1 days, and length of stay in ICU and duration of mechanical ventilation 8.2 ± 9.0 days and 7.7 ± 6.0 days, respectively. In terms of patients' nutritional status, the moderately malnourished group accounted for 68.2% of the patients, and the severely malnourished group accounted for 18.2% (Table 1).
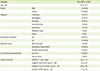
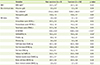
Table 2 provides a comparison of the anthropometric, biochemical, and BIA data according to the three different nutritional statuses. There were no significant differences in height and weight among the three groups. All biochemical test results were poorer in the group with lower nutritional status. Among the BIA data, variables with statistical significance (p < 0.05) were PhA, ECW, and ECW/TBW. PhA significantly decreased with poorer nutritional status, while ECW/TBW, a known indicator of edema, increased by 0.01 with poorer nutritional status. Meanwhile, ECW was significantly higher in the moderately malnourished group than in the other two groups. Other body water indicators such as ICW, TBW, and %TBW/FFM, and body composition indicators such as protein, SLM, FFM, SMM, BCM, mineral, and BMC were the highest in the moderately malnourished group, followed by the severely malnourished group and then the well-nourished group. However, none of these results were significantly different. By contrast, FM was the lowest in the moderately malnourished group, followed by the severely malnourished group and then the well-nourished group, which also did not show any significant difference. There were no significant differences in APACHEII score and length of stay in ICU or hospital. Duration of mechanical ventilation reached at a significant difference and it was the highest in the well-nourished group, followed by the severely malnourished group and moderately malnourished group.
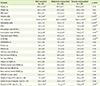
Table 3 shows the correlations between the BIA results and the common indicators of nutritional assessment, i.e., BMI, albumin level, TLC, and hemoglobin level. Considering that these indicators can be influenced by age and critical illness, age and APACHE II score were included as covariates in the analysis. BIA variables that showed a significant positive correlation with BMI included PhA, FM, %BF, and BCM, whilst the only indicator that showed a negative correlation was ECW/TBW. Among the biochemical indicators measured, significant positive correlations were found between serum albumin and PhA, and TLC and FM and %BF, as well as for hemoglobin and FM and %BF. By contrast, a negative correlation was found between albumin and ECW/TBW, and between hemoglobin and ECW and ECW/TBW. Overall, the BIA variables that showed a consistent correlation with two or more biochemical parameters and BMI were PhA, ECW/TBW, FM, and %BF.
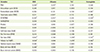
Table 4 shows the correlations between the BIA results and length of ICU stay, length of hospital stay, and duration of mechanical ventilation. The analyses were also adjusted for age and APACHE II score. A significant positive correlation was found between the length of hospital stay and FM, and a negative correlation was found between duration of mechanical ventilation and ECW/TBW. The length of ICU stay did not have a significant correlation with any indicators.
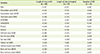
Table 5 shows the comparison of BMI, biochemical test results, and BIA results between the patients who died during hospitalization and those who survived. The number of patients who died during hospitalization was 8, which was not high; however, statistical significance was observed for many variables. There was no significant difference in BMI, serum albumin level, or hemoglobin levels, but the TLC was significantly lower among non-survivors than survivors. Among the BIA results, the PhA of non-survivors was significantly lower than that of survivors, and ECW/TBW and %TBW/FFM, which are indicators of fluid retention, were significantly higher (p < 0.05) among non-survivors than survivors. No significant difference was found in FFM, FM, or mineral, which represent de facto body composition.
Discussion
In nutritional assessment, "reduction of lean body mass" and "functional disability" have emerged as new assessment factors [25]. Given that many critically ill patients undergo a rapid change in body composition due to the occurrence of the disease itself and hypermetabolism, monitoring body composition in the ICU can be very useful for nutritional and medical intervention. Previous research suggests that changes in body composition as measured by BIA have a significant correlation with energy and protein intake. It implies the possibility of using BIA as part of an extensive nutrition care process for critically ill patients from nutritional assessment to intervention and monitoring [26].
The basic principle of BIA assumes human body as a uniform cylinder with constant conductivity. In this hypothesis, the resistance is proportional to its length and inversely proportional to its cross sectional area. Using this principle, an empirical relationship that estimates body water or body composition can be established [7].
In this study, PhA and ECW/TBW, both of which are variables commonly evaluated in many BIA-related studies [7,8,9,10,17], were found as meaningful factors for nutrition assessment or prediction of clinical outcomes.
PhA is calculated from resistance and reactance as (Reactance/Resistance) × (180°/Π) [24]. Reactance means the capacitance behavior of tissues and is associated with cellularity, cell size and integrity of the cell membrane. On the other hand, resistance means pure resistive behavior of tissue and is dependent on lean tissue mass and tissue hydration. This supports the idea that PhA is a measure of cell mass and nutritional risk [9]. The results of this study showed that PhA clearly decreased to 4.1° in moderate malnutrition and decreased to 3.1° in severe malnutrition, which was lower than the PhA cutoff for estimating nutritional status proposed in previous research (5° for male patients and 4.6° for female patients) [10].
PhA also showed a significant positive correlation with albumin. Besides, ECW/TBW, which is an index of edema, had a significant negative correlation with albumin and hemoglobin level and consistently increased with poorer nutritional status. Considering that acute inflammation or hypoalbuminemia caused by malnutrition is known to cause edema and that low PhA indicates malnutrition [9], this result proves the utility of BIA in the nutritional assessment of critically ill patients.
In previous studies, ECW/TBW has been also found to be a good prognostic factor for different diseases such as acute heart failure [17], renal disease [27], and liver disease [28]. In this study, ECW/TBW showed a significant negative correlation with duration of mechanical ventilation. Research has shown that excessive accumulation of fluid is correlated with a lower survival rate and longer duration of mechanical ventilation [29], whereas a decrease in ECW and diuresis has been seen as signs of improvement [30].
In critical patients, there are number of influences on mortality including age and disease status. Nevertheless, PhA and ECW/TBW, known survival and prognostic factors on the basis of previous researches [8,10,11,12,13,14,15,16,17,30], have shown its potential for predicting survival. Especially the average level of PhA was significantly different between non-survivors (2.89°) and survivors (4.11°), both of which were much lower than 5.3°, which is the PhA cutoff score proposed in previous research for significant survival prediction of lung cancer patients [31]. Although much research has been conducted on the PhA cutoff for estimating survival rate of various diseases [22,31,32], there was no precise comparison criteria in this study. Moreover, the number of non-survivors was too small to develop a PhA cutoff score.
Meanwhile, ECW also showed statistical significance according to nutritional status; however, the change according to nutritional status was not consistent. ECW is an indicator of absolute water content that can be largely influenced by sex and the physique of individual subjects, and, therefore, is probably limited in its ability to reflect edema as caused by malnutrition.
FM and %BF showed a significant positive correlation with TLC and hemoglobin level. However, significant or nonsignificant positive correlations were also found for some of the clinical outcome indicators with them. According to metaanalysis studies based on a large number of papers, although obesity in critically ill patients acted as a protective factor against mortality, it increased length of ICU stay and duration of mechanical ventilation. As potential causes, it was suggested that non-obese patients died in a relatively short period after admission because they were already losing weight due to malnutrition and disease even prior to hospitalization. Obese patients have low mortality rates because of preserved nutrition. However, apart from mortality, the duration of mechanical ventilation could have been prolonged owing to airway resistance and deteriorated efficiency of respiratory muscles [33,34].
Most of the clinical outcomes did not show any significant difference or consistent change according to nutritional status. These results could be due to uneven patient distribution or the fact that sample sizes of some groups were very small. There was significant difference in duration mechanical ventilation, but it was not shown in post hoc analysis.
Overall, this study was not without its strengths and limitation. The strengths of this study are that it evaluated the utility of BIA as a noninvasive method of nutritional assessment for critically ill patients. Moreover, the results of this study are valuable because there has been very little research to date that has examined the role of BIA in the clinical care of critically ill patients, as well as evaluated the significance of many other BIA variables, particularly that of body water or PhA instead of the usual markers of just FM or FFM. Having said that, however, the analysis was limited owing to the small sample size and the fact that it was based in a single center, at one point in time without comparison, whilst sex differences were not taken into account for BMI and BIA data. Furthermore, many previous BIA studies select their subjects based on their disease state [11,12,13,14,15,16,17,24,27,28,31,32], which the guidelines recommend [8]; however, it was not possible to classify subjects according to disease in this study owing to the small sample size. Although no substantial one-to-one correlation was found among the individual variables owing to these limitations, it may have been better to compare BIA results with various indicators and monitor them over several days in a clinical field wherein various indicators are observed together to aid clinical decision. This study showed some potential utility of BIA for nutritional assessment in ICU. Though, to be more certain about effectiveness of BIA, various further studies are needed.
Conclusion
BIA is a useful method in the nutritional assessment and prognosis of critically ill patients. Low PhA and high ECW/TBW can significantly imply malnutrition; these variables also showed significant correlations with biochemical data, which are conventional nutritional assessment indicators. High ECW/TBW was correlated with long duration of mechanical ventilation. PhA was also lower and ECW/TBW higher among nonsurvivors than survivors, which implies utility of BIA for predicting survival rate.
 XML Download