

 PDF
PDF ePub
ePub Citation
 Print
Print


Introduction
Increasing environmental pollution in modern society has given rise to concern about the accumulation of heavy metals in humans. Major heavy metals that threaten health include lead (Pb), cadmium (Cd), and mercury (Hg). The main route of exposure to these metals is ingestion; however, in an urban environment, atmospheric particulate originating from automobile exhaust and industries may make a significant contribution. The toxic effects of heavy metals on humans have been known for centuries. More specifically, acute Pb poisoning can result in headache, unstable emotion, abdominal pain, and various symptoms related to the nerves, and chronic exposure to lead further develops renal tubule damages [1]. It has been reported that elevation of blood Cd level, by increasing systolic blood pressure as well as diastolic blood pressure, increases the risk of hypertension [2]. One of the major poisonings by heavy metals is Minamata disease by Hg. It is caused by an excess ingestion of fishes that have accumulated Hg biologically [3].
Osteoporosis is a major public health problem in Korea. Heavy metals are proposed risk factors of osteoporosis, while adequate nutrient intake is necessary to prevent it. Especially, Pb is transported by blood to the soft tissues, where it remains for short periods and is finally deposited in bone. More than 90% of the Pb present in the body is stored in bones, where it may remain for decades [4]. It has been also reported that bone mineral density (BMD) is related with previous renal dysfunction caused by Cd exposure [5]. However, still the association among heavy metals, dietary factors, and BMD has never been assessed.
Adequate nutrition is an essential factor for bone health and for preventing heavy metal poisoning as well. It has been reported that poor nutrition status impairs the defense system against exposure to heavy metals, eventually causing heavy metal poisoning [6]. On the other hand, calcium (Ca) is an essential nutrient for bone density, and Ca also competes with Pb for binding and transport sites [7,8], so Ca intake may affect the level of Pb absorption. Therefore, it is needed to investigate the relationship between food and nutrient intake status and heavy metal exposure status with different BMD status.
The purpose of this study was to investigate the association among heavy metal exposure, nutrient intake status, and BMD by comparing heavy metals in serum according to status of BMD (in normal, osteopenic, and osteoporotic subjects) and to elucidate their relation with intakes of food and nutrients.
Materials and Methods
Subjects
Study participants agreed to provide their personal information regarding the purpose and the procedures of the project. Study groups of normal, osteopenia, and osteoporosis were divided by T score and Z score measured using a dual energy X-ray absoptiometry (DEXA). There was no significant difference in gender distribution among the three groups: a normal group (male 38.1%, female 61.9%), osteopenia group (male 58.6%, female 41.4%) and osteoporosis group (male 28.6%, female 71.4%). This study was approved by the College of Medicine, Dankook University Institutional Review Board (IRB), and written informed consent was obtained from each subject.
BMD and anthropometric measurements
Height was measured by a height measurement instrument and weight was measured by InBody (Biospace, Seoul, Korea) while subjects wore light clothes. Blood pressure was measured by a mercury sphygmomanometer while subjects were in a stable sitting position. Measurements were taken twice and the mean values were calculated. BMD of spine (L2-L4) was measured as T score and Z score using Hologic Discovery W Bone Densitometry (Block Imaging International Inc., USA). Subjects were assigned to one of three study groups based on the T-score of BMD: a normal group (n = 21, T-score > -1), osteopenia group (n = 29, -2.5 < T-score ≤ -1) and osteoporosis group (n = 14, T-score ≤ -2.5).
Collection and analysis of blood
Fifteen ml venous blood was collected by using vacuum blood collection tubes in a fasting state the day after the dietary intake survey. From the blood collected in vacuum blood collection tubes, serum was separated by centrifugation at 400 g for 15 minutes. Serum was kept until the test was conducted at -20℃. Pb, Cd, and Hg in serum were analyzed by using an atomic absorption spectrometer (AAS) (Perkin Elmer AAS-3300, USA).
Dietary intake survey
As for the dietary survey, a 24-hour recall method currently used in the Korean National Health and Nutrition Examination Survey (NHANES) was used and trained researchers conducted dietary intake surveys for 3 consecutive days including 2 week days and 1 weekend through personal interviews. In other words, all the food consumed for breakfast, lunch, dinner, and snacks from rising in the morning till bedtime the day before the survey and the types of food materials and the amount of food consumed were surveyed. Researchers helped the subjects to remember the amount of the food they had consumed, showing them the food models and pictures. The nutrient intake was analyzed by using Can-Pro 3.0 (The Korean Nutrition Society, Seoul, Korea).
Statistical analysis
The mean values and the standard deviations of all the findings in this experiment were calculated by using the SAS program (version 9.2; SAS Institute Inc, Cary, NC, USA). As for the comparison of general characteristics among the three groups, theirs significance was verified through ANOVA test. When ANOVA indicated significant differences among the means, those differences were further evaluated using Duncan's test. In the case of intakes of nutrient and food, and serum heavy metal levels, theirs significance among the groups was verified through ANCOVA test adjusted for age. The significance of the correlations between factors was verified by Spearman's partial correlation coefficient controlling for age, sex, BMI, and BMI status. Age and BMI were adjusted as continuous variables, and sex and BMI status were adjusted as categorical variables. All statistical analyses were considered significant at the level of α = 0.05.
Results
General characteristics of the subjects
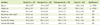
General characteristics of the subjects are shown in Table 1. The average age of the subjects was 42.1 for the normal group, 51.4 for the osteopenia group, and 64.4 for the osteoporosis group, showing a significant difference (p < 0.001). Average height of the osteoporosis group was significantly lower than that of the other two groups (p < 0.001); however, there was no significant difference in body weight, BMI, body fat, and blood pressure among the three groups.
Heavy metals in serum of the subjects
Table 2 shows heavy metal levels in the serum of the subjects. Serum heavy metals of total subjects were 2.9 µg/dL for Pb, 1.5 µg/L for Cd, and 4.4 µg/L for Hg. Adjusting for age, there was no significant difference in serum levels of Pb, Cd, and Hg among the three groups.
Daily intakes of energy, nutrients, and food of the subjects
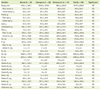
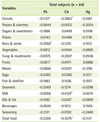
Daily energy and nutrient intakes of the subjects are shown in Table 3. Energy intakes were 1558.4 kcal for the normal subjects, 2019.6 kcal for the osteopenia subjects, and 1962.5 kcal for the osteoporosis subjects without significant difference. Also, the daily intakes of nutrients were not significantly different among the three groups. Daily food intakes from different food groups are shown in Table 4. The total daily food intakes were 969.9 g for the normal group, 1249.7 g for the osteopenia group, and 1314.0 g for the osteoporosis group, not showing a significant difference. Also, food intakes from different food groups were not significantly different among the three groups except fish and shellfishes. Fish and shellfishes intake of the osteoporosis group (120.5 g) was significantly higher than those of the normal (47.4 g) and osteopenic (84.1 g) groups (p < 0.05).
Correlation between heavy metals in serum and intakes of nutrients and food in the subjects
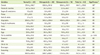
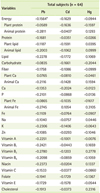
The correlations between serum heavy metals and nutrient intakes after controlling for age, gender, BMI, and BMD status are shown in Table 5. There was no significant relationship between serum heavy metal levels and nutrient intake. Table 6 shows the correlations between serum heavy metals and food intakes after adjusting for age, gender, BMI, and BMD status. The serum Pb level showed significant and negative correlations with intakes nuts & seeds (p < 0.05). Serum Cd showed significant and negative correlation with intakes of cereals (p < 0.05), milks (p < 0.01), and total food (p < 0.05).
Discussion
The present study examined the serum heavy metal status and its relation with intake of nutrients and food in osteopenia and osteoporosis subjects. Overall, we found little evidence of the association between serum heavy metal levels and BMD status in Korean adults, while we did observe negative relationships between serum heavy metal levels and intakes of certain food groups.
Among the various heavy metals, Cd has been reported to have association with low bone mass of the forearm [9-12] at considerably lower exposure levels. Also, a previous large population study has addressed this issue and reported a modestly increasing risk of osteoporosis at the total hip with increasing urinary Cd in women [13]. Cd is a widespread food contaminant, with cereals, vegetables, root vegetables, and potatoes being the major contributors (80%) to dietary Cd intake [14]. Experimental data demonstrate a direct effect of Cd on bone with decreased bone formation and increased bone resorption at Cd concentrations relevant to human exposures [15]. Cd-exposed osteoblast-like cells decreased their bone-forming activity and secreted prostaglandin E2 (PGE2), which, in turn, can increase the formation and activity of osteoclasts. In a study of bone marrow cells, Cd both accelerated the differentiation and enhanced the activity of new osteoclasts. In our study, the serum level of Cd was significantly higher in the osteoporosis group compared with the other two groups (p < 0.05). As shown in the general characteristics of this study, the average age of the osteoporosis group was significantly higher than that of the other groups. Age is a critical risk factor for osteoporosis as it develops slowly over a lifetime. Also heavy metals, after being absorbed and bound to tissues, are not easily excreted from the body, and their accumulation is increased by age due to their long half-life [16]. Therefore, age might affect both BMD and serum heavy metal levels. To investigate an association between heavy metal status and BMD without age effect, we carried ANCOVA-test controlling for age. After controlling for age, there was no significant difference in serum Cd level among the three groups.
A previous study supports associations between Pb and bone formation, as growth plate chondrocyte expression works via changes in alkaline phosphatase, collagen, proteoglycan and thymidine levels, leading to inhibited bone formation [17]. Based on a study of Berglund et al. [8], effects on BMD by Pb and Cd may occur via increased bone turnover either through their direct action on the kidney, which may increase renal tubular Ca resorption, or through bone resorption from increased parathyroid hormone and a decrease in active vitamin D. We did not find a significant difference of the serum Pb levels among the three groups with different BMD in our study. However, we did not analyze the bone metabolism makers, so further study is need to investigate the relationship bone metabolism and heavy metal exposure in Koreans.
Hg toxicity can be caused by an excess ingestion of fish that have accumulated Hg biologically. Hg is released into the atmosphere via industrial emissions. Elemental Hg is transformed to methyl Hg by bacteria in water and methyl Hg subsequently concentrates in fish. Therefore, the primary source of Hg exposure in the population is fish consumption [18]. In our study, a significant difference was not found in serum Hg level among the three groups; however, osteoporotic subjects consumed significantly higher amounts of fish and shellfishes than normal and osteopenic subjects. It is not hard to conclude that fish consumption may have a negative effect on BMD as they contain Pb. One study reported that blood Hg (mean level 4.5 µg/L) was associated with decreased osteoporosis risk evaluated in Korean women [19]. These results could be driven by the fact that the primary source of Hg in Korea was fish consumption [20]. Fish consumption provides essential n-3 and n-6 fatty acids [21], which are protective against osteoporosis [22]. Therefore, further studies are needed to investigate the complex association between BMD and fish consumption, as well as Hg contamination.
The heavy metal concentrations in the blood mainly reflect recent exposure, but are also influenced by the body burden, particularly after a long exposure [23]. Potential uncertainties with heavy metal exposure being based on blood heavy metal levels, the bioavailability and gastrointestinal absorption may vary depending on dietary factors such as fiber content and nutritional status. Plant food generally contains a higher concentration of Cd than meat, dairy, and fish. Among plant foods, the highest concentrations are generally present in cereals such as wheat and rice, leafy green vegetables, and potatoes and root vegetables [24-26]. From the previous studies, cereals and vegetables contribute to about 80% of dietary Cd exposure. However, in our study, serum Cd levels had a significant and negative correlation with cereal intake. There are some possible explanations for this discordance. First, food Cd concentrations differ according to the different soles and environment. Second, we could consider the main type of cereals which the subjects have consumed. According the Korea Nutrition and Health Examination Survey [27], the main food for cereals is rice, which contains high soluble fibers. It is well known that animal protein containing sulfuric amino acids has detoxifying properties [28]. This is also partially supported by our study results showing a negative correlation (p = 0.0529) between serum Pb level and daily intake of animal protein.
Heavy metal exposure can impair Ca absorption, displacing Ca with metals and decreasing bone mineralization [15,16]. If it is restated, Ca intake may affect the level of heavy metals absorption. In our study, the intake of milks, one of the best Ca source showed a significant and negative correlation with serum Cd level. Also, there was a negative correlation between Ca intake and serum levels of Pb and Cd without significance.
Our study has several limitations. Firstly, cross-sectional design makes it difficult to determine causality. Even after some adjustments were made, potential confounding factors may have remained. Secondly, the study had a small sample size and thus needs to be repeated using a larger population. Thirdly, we just measured metals in serum given that serum levels reflect exposure on the order of several months. Urinary levels of metals or hair levels of Hg or bone Pb would have provided a longer-term biomarker of exposure.
Conclusion
In conclusion, we did not find a direct association between serum heavy metal levels and BMD status in some Korean adults. However, negative relationships were found between serum heavy metal levels and intake of some foods (cereals, milks, and total food). Further follow-up studies must be conducted to identify the relation between BMD and heavy metals in large samples with different BMD status.

 XML Download