Abstract
Methods
A modified International Study of Asthma and Allergies in Childhood (ISAAC) questionnaire survey was administered to 1,376 elementary school children in the Songpa area of Seoul. Serum total IgE, blood eosinophils, and skin prick tests for 18 common allergens were performed.
Purpose
We investigated the relationship between allergic rhinitis (AR) and allergen sensitization in students at an elementary school in Seoul.
Results
The prevalence of AR symptoms during the last 12 months and the current AR, defined as having AR symptoms during last 12 months with a history of AR diagnosis from the doctor, were 39.0% and 24.2%, respectively. Males were more likely to have current AR than females (26.6% vs. 21.5%, P=0.04). Independent risk factors for current AR were parental allergic disease (adjusted odds ratio [aOR], 3.78, 95% CI, 2.76–5.18), history of atopic dermatitis (AD; aOR, 1.47; 95% CI, 1.05–2.04), history of asthma (aOR, 3.48; 95% CI, 2.15–5.61), and higher maternal education (aOR, 1.42; 95% CI, 1.02–1.99). The subjects with higher quartiles of serum total IgE (P value for trend <0.001), more than 4% of eosinophil fraction (aOR 1.76; 95% CI, 1.24–2.48), and allergen sensitization house dust mites [aOR, 1.54; 95% CI, 1.10–2.15], dog [aOR, 2.95; 95% CI, 1.38–6.28], cat [1.85; 95% CI, 1.02–3.34], Alternaria [aOR, 2.37; 95% CI, 1.06–5.32] and late-blooming tree pollen mixture [aOR 2.26; 95% CI, 1.12–4.57] were more likely to have current AR. Conclusion: The prevalence of AR in children has increased during the last decade. The sensitization to common allergens and increased sensitization were associated with the development of current AR. House dust mites, dog, cat, alder, and Alternaria were the important allergens for current AR.
References
1. Bousquet J, Khaltaev N, Cruz AA, Denburg J, Fokkens WJ, Togias A, et al. Allergic Rhinitis and its Impact on Asthma (ARIA) 2008 update (in collaboration with the World Health Organization, GA(2)LEN and AllerGen). Allergy. 2008; 63(Suppl 86):8–160.
2. Asher MI, Montefort S, Bjorksten B, Lai CKW, Strachan DP, Weiland SK, et al. Worldwide time trends in the prevalence of symptoms of asthma, allergic rhinoconjunctivitis, and eczema in childhood: ISAAC Phases One and Three repeat multicountry cross-sectional surveys. Lancet. 2006; 368:733–43.

3. Hong SJ, Ahn KM, Lee SY, Kim KE. The prevalences of asthma and allergic diseases in Korean children. Korean J Pediatr. 2008; 51:343–50.

4. Marogna M, Massolo A, Berra D, Zanon P, Chiodini E, Canonica GW, et al. The type of sensitizing allergen can affect the evolution of respiratory allergy. Allergy. 2006; 61:1209–15.

5. Braun-Fahrlander C, Wuthrich B, Gassner M, Grize L, Sennhauser FH, Varonier HS, et al. Validation of a rhinitis symptom questionnaire (ISAAC core questions) in a population of Swiss school children visiting the school health services. SCARPOL-team. Swiss Study on Childhood Allergy and Respiratory Symptom with respect to Air Pollution and Climate. International Study of Asthma and Allergies in Childhood. Pediatr Allergy Immunol. 1997; 8:75–82.
6. Gergen PJ, Turkeltaub PC. The association of individual allergen reactivity with respiratory disease in a national sample: data from the second National Health and Nutrition Examination Survey, 1976–80 (NHANES II). J Allergy Clin Immunol. 1992; 90:579–88.
7. Bauchau V, Durham SR. Prevalence and rate of diagnosis of allergic rhinitis in Europe. Eur Respir J. 2004; 24:758–64.

8. Hong S. Epidemiology of childhood asthma and allergic diseases. Pediatr Allergy Respir Dis (Korea). 2007; 17:S55–66.
9. Shaheen SO, Aaby P, Hall AJ, Barker DJ, Heyes CB, Shiell AW, et al. Measles and atopy in Guinea-Bissau. Lancet. 1996; 347:1792–6.

10. Braback L, Hjern A, Rasmussen F. Social class in asthma and allergic rhinitis: a national cohort study over three decades. Eur Respir J. 2005; 26:1064–8.

11. Blanc PD, Yen IH, Chen H, Katz PP, Earnest G, Balmes JR, et al. Area-level socio-economic status and health status among adults with asthma and rhinitis. Eur Respir J. 2006; 27:85–94.

12. Dom S, Droste JH, Sariachvili MA, Hagendorens MM, Bridts CH, Stevens WJ, et al. The influence of parental educational level on the development of atopic sensitization, wheezing and eczema during the first year of life. Pediatr Allergy Immunol. 2009; 20:438–47.

13. Droste JH, Kerhof M, de Monchy JG, Schouten JP, Rijcken B. Association of skin test reactivity, specific IgE, total IgE, and eosinophils with nasal symptoms in a community-based population study. The Dutch ECRHS Group. J Allergy Clin Immunol. 1996; 97:922–32.
14. Arshad SH, Tariq SM, Matthews S, Hakim E. Sensitization to common allergens and its association with allergic disorders at age 4 years: a whole population birth cohort study. Pediatrics. 2001; 108:E33.

15. Kim YY, Cho SH, Kim WK, Park JK, Song SH, Kim YK, et al. Prevalence of childhood asthma based on questionnaires and methacholine bronchial provocation test in Korea. Clin Exp Allergy. 1997; 27:761–8.

16. Jang AS, Yeum CH, Son MH. Epidemiologic evidence of a relationship between airway hyperresponsiveness and exposure to polluted air. Allergy. 2003; 58:585–8.

17. Jeon BH, Lee J, Kim JH, Kim JW, Lee HS, Lee KH. Atopy and Sensitization Rates to Aeroallergens in Children and Teenagers in Jeju, Korea. Korean J Asthma Allergy Clin Immunol. 2010; 30:14–20.
18. Song Y, Kwon JW, Kim BJ, Kim BS, Kim JH, Kim HB, et al. Relationship between Allergic Rhinitis and Asthma in High School Students in Korea. Pediatr Allergy Respir Dis(Korea). 2010; 20:30–40.
19. Yoo Y, Ko HK, Han JJ, Lee Y, Seo KJ, Choung JT, et al. The prevalence of atopy and asthma among university freshmen in Seoul, Korea: association with obesity. J Asthma. 2007; 44:45–9.

20. Arbes SJ, Gergen PJ, Elliott L, Zeldin DC. Prevalences of positive skin test responses to 10 common allergens in the US population: results from the third National Health and Nutrition Examination Survey. J Allergy Clin Immunol. 2005; 116:377–83.
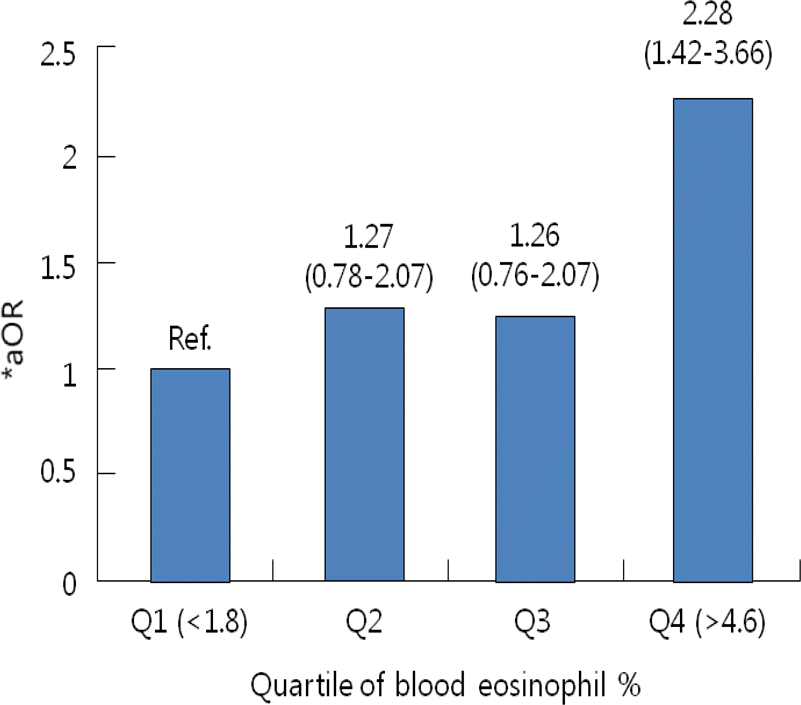
Fig. 1.
The odds ratios (95% CI) for current allergic rhinitis by the fraction of blood eosinophil. ∗aOR: Adjusted by age, sex, BMI, ETS, parental allergic diseases and degree of maternal education ∗aOR for trend=1.29 (1.11–1.50), P =0.001

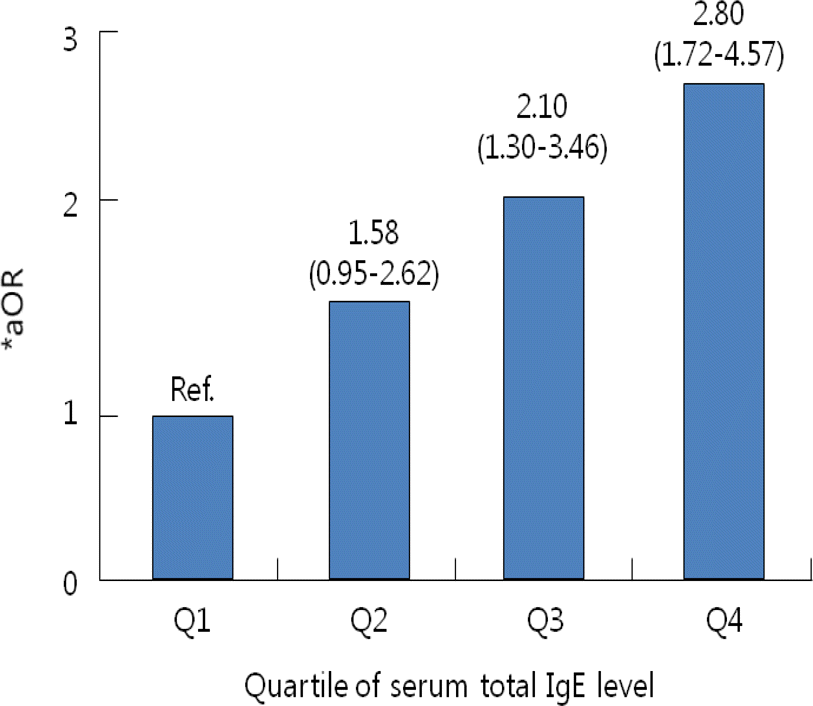
Fig. 2.
The odds ratios (95% CI) for current allergic rhinitis by the level of serum total IgE. ∗aOR: Adjusted by age, sex, BMI, ETS, parental allergic diseases and degree of maternal education ∗aOR for trend=1.39 (1.20–1.62), P<0.001

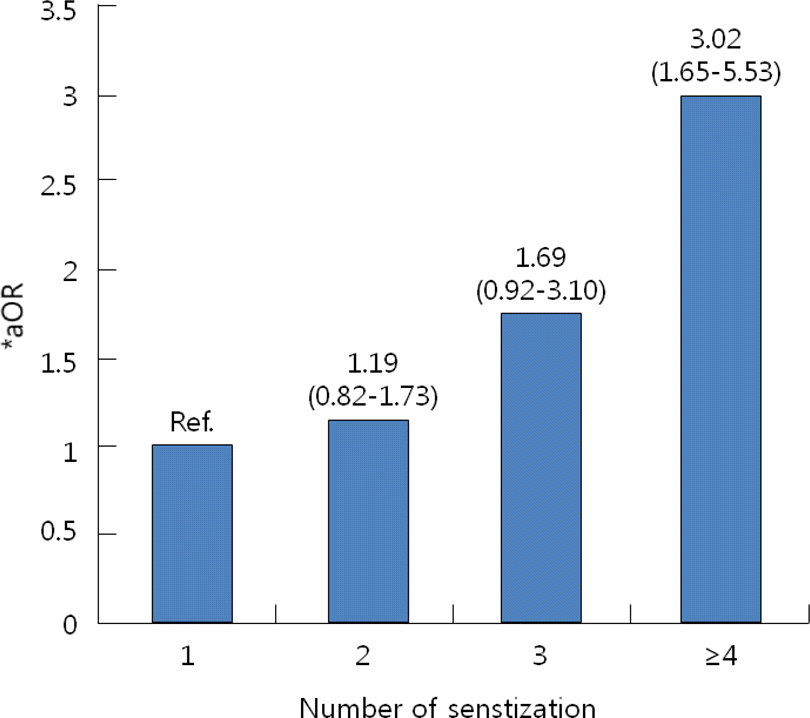
Fig. 3.
The Odds Ratios (95% CI) for Current Allergic Rhinitis by the Number of Sensitization ∗aOR: Adjusted by age, sex, BMI, ETS, parental allergic diseases and degree of maternal education ∗aOR for trend=1.38 (1.15–1.65), P <0.001

Table 1.
Characteristics of Subjects
| Number | 1,376 |
| Age, Year mean±SD | 9.43±1.76 |
| Sex, M/F | 740/636 |
| BMI, mean±SD | 18.57±3.17 |
| Parental history of allergic diseases | 371/1,037 (35.8%) |
| Parental history of AR | 331/1,008 (32.8%) |
| Economic state, monthly income | |
| Low, ≤2,999 USD) | 362 (31.0%) |
| Middle, 3,000–4,990 USD | 685 (58.7%) |
| High, ≥5,000 USD | 120 (10.2%) |
| Environmental tobacco smoking | 454/1,232 (36.9%) |
| Atopy∗ | 495/1,159 (42.7%) |
| Allergen sensitization No. | |
| 0 | 664 (57.3%) |
| 1 | 331 (28.6%) |
| 2 | 83 (7.2%) |
| 3 | 42 (3.6%) |
| ≥4 | 39 (3.4%) |
Table 2.
Prevalence of Allergic Rhinitis in Primary School Children of Seoul
| Number | Prevalence (95% CI) | |
|---|---|---|
| AR symptoms, ever | 474/1,116 | 42.5% (39.6–45.4) |
| AR symptoms, last 12 months | 453/1,163 | 39.0% (36.2–41.8) |
| AR symptoms with itchy watery eyes, last 12 months | 164/1,255 | 13.1% (11.2–15.0) |
| AR diagnosis, ever | 446/1,159 | 38.5% (35.7–41.3) |
| Current AR∗ | 292/1,208 | 24.2% (21.7–26.7) |
| Treatment of AR, last 12 months | 339/1,151 | 29.5% (26.9–32.1) |
Table 3.
Risk Factors for Current Allergic Rhinitis
| Current AR | Univariate Analysis | Adjusted Analysis∗ | ||||
|---|---|---|---|---|---|---|
| Numbers | % | OR (95% CI) | P Value | aOR (95% CI) | P Value | |
| Personal characteristics | ||||||
| Sex, male | 169/636 | 26.6 | 1.32 | 0.043 | 1.16 | 0.350 |
| (1.01–1.72) | (0.84–1.58) | |||||
| BMI ≥ 85percentile | 59/251 | 23.5 | 0.96 | 0.868 | 0.99 | 0.967 |
| (0.69–1.33) | (0.68–1.44) | |||||
| Past history of AD diagnosis | 122/378 | 32.3 | 1.84 | <0.001 | 1.47 | 0.021 |
| (1.40–2.42) | (1.05–2.04) | |||||
| Past history of asthma diagnosis | 49/108 | 45.4 | 3.05 | <0.001 | 3.48 | <0.001 |
| Genetic factors | (2.03–4.58) | (2.15–5.61) | ||||
| Parental allergic diseases | 145/361 | 40.2 | 3.85 | <0.001 | 3.78 | <0.001 |
| (2.85–5.21) | (2.76–5.18) | |||||
| Socioeconomic factors | ||||||
| Maternal education ≥ graduate | 207/747 | 27.7 | 1.63 | 0.001 | 1.42 | 0.036 |
| (1.22–2.17) | (1.02–1.99) | |||||
| Biologic markers | ||||||
| Eosinophil fraction ≥ 4% | 108/341 | 31.7 | 1.71 | <0.001 | 1.76 | 0.001 |
| (1.28–2.28) | (1.24–2.48) | |||||
| Total IgE ≥ 100 kU/L | 126/372 | 33.9 | 2.00 | <0.001 | 1.80 | 0.001 |
| (1.51–2.67) | (1.29–2.52) | |||||
| Sensitization to common allergens | 140/465 | 30.1 | 1.68 | <0.001 | 1.47 | 0.020 |
| (1.27–2.22) | (1.06–2.04) | |||||
Table 4.
Proportion of Specific Allergen Sensitization by Current Allergic Rhinitis (Total 1,159 conducted to allergic skin prick test)
| Allergen Sensitization (Covariates) | Current AR | Univariate Analysis | Adjusted Analysis∗ | |||
|---|---|---|---|---|---|---|
| No (n=816) | Yes (n=266) | OR (95% CI) | Pvalue | OR (95% CI) | Pvalue | |
| Any allergen | 321 (39.3%) | 140 (52.6%) | 1.71 (1.29–2.26) | <0.001 | 1.47 (1.06–2.04) | 0.020 |
| Indoor allergens | 293 (35.9%) | 131 (49.2%) | 1.73 (1.30–2.29) | <0.001 | 1.49 (1.07–2.08) | 0.017 |
| HDM (Der p or Der f) | 275 (33.7%) | 127 (47.7%) | 1.79 (1.35–2.38) | <0.001 | 1.54 (1.10–2.15) | 0.010 |
| Der p | 244 (29.9%) | 113 (42.5%) | 1.73 (1.30–2.30) | <0.001 | 1.47 (1.05–2.05) | 0.025 |
| Der f | 233 (28.6%) | 102 (38.3%) | 1.55 (1.16–2.08) | 0.003 | 1.39 (0.98–1.96) | 0.059 |
| Cockroach | 12 (1.5%) | 7 (2.6%) | 1.81 (0.70–4.64) | 0.211 | 2.30 (0.84–6.29) | 0.104 |
| Dog | 20 (2.5%) | 17 (6.4%) | 2.71 (1.40–5.26) | 0.002 | 2.95 (1.38–6.28) | 0.005 |
| Cat | 49 (6.0%) | 28 (10.5%) | 1.84 (1.13–2.99) | 0.013 | 1.85 (1.02–3.34) | 0.042 |
| Pollen | 51 (6.3%) | 34 (12.8%) | 2.19 (1.39–3.47) | 0.001 | 2.22 (1.28–3.85) | 0.004 |
| Grass | 7 (0.9%) | 5 (1.9%) | 2.21 (0.69–7.03) | 0.167 | 2.29 (0.60–8.71) | 0.221 |
| Tree1, early-blooming | 23 (2.8%) | 12 (4.5%) | 1.62 (0.79–3.32) | 0.175 | 1.91 (0.83–4.38) | 0.125 |
| Tree2, late-blooming | 28 (3.4%) | 20 (7.5%) | 2.28 (1.26–4.13) | 0.005 | 2.26 (1.12–4.57) | 0.022 |
| Alder | 18 (2.2%) | 10 (3.8%) | 1.73 (0.78–3.80) | 0.166 | 2.71 (1.09–6.71) | 0.031 |
| Oak | 29 (3.6%) | 12 (4.5%) | 1.28 (0.64–2.55) | 0.478 | 1.84 (0.84–4.06) | 0.126 |
| Mugwort | 10 (1.2%) | 7 (2.6%) | 2.17 (0.82–5.78) | 0.109 | 1.83 (0.58–5.75) | 0.296 |
| Ragweed | 3 (0.4%) | 2 (0.8%) | 2.05 (0.34–12.35) | 0.602 | 1.69 (0.17–16.60) | 0.652 |
| Mold | 26 (3.2%) | 18 (6.8%) | 2.20 (1.18–4.09) | 0.010 | 2.28 (1.08–4.79) | 0.030 |
| Alternaria | 22 (2.7%) | 16 (6.0%) | 2.31 (1.19–4.46) | 0.011 | 2.37 (1.06–5.32) | 0.035 |
| Aspergillus | 4 (0.5%) | 4 (1.5%) | 3.09 (0.77–12.47) | 0.107 | 2.37 (0.46–12.12) | 0.300 |


 PDF
PDF ePub
ePub Citation
 Print
Print


 XML Download