

 PDF
PDF ePub
ePub Citation
 Print
Print


Abstract
Dietary habit of excess sodium consumption is formed mainly by excessive salt intake from the younger age and this may lead to hypertension, stroke, and stomach cancer. This study was performed to estimate the salt content in kindergarten meals and provide basic data on meal providers' dietary attitude to sodium intake for nutrition education. We collected data on161 food items from 16 institutions in Gyeonggi-do and salt content was calculated from salinity and weight of individual food items. The average salt content from lunch meals was 2.2 g, which was about daily adequate intake of sodium for children aged 3 to 5 years old. Greatest contributor to the salt content in a meal was soup and stew (47.8%). The most salty dishes were sauces and kimchi followed by stir-fried food, deep-fried food, braised food, and grilled food. The salt content was higher in soup and stew despite of low salinity, due to the large quantity per serving. The salt contents of soups and kimchi were 40.6% and 14.3%, respectively of the total salt content in dish groups. Staff members and caregivers at home who prepared food for the child showed preference for one-dish rice meal, dried fish and salted mackerel, and broth when eating soup, stew, and noodles. Caregivers showed higher sodium index score and had higher preference for processed food such as Ramen, canned food, and ham compared with staff members (p < 0.05). These results suggested that monitoring salt content of kindergarten meals and nutrition education for those prepare meals for children are needed to lower sodium intake in childhood.
Figures and Tables
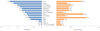
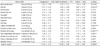
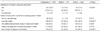
Table 1
Salt content and salinity of menu groups from kindergarten meals
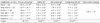
1) Weight of food supplied supplied for each meal (g)
2) Measured by salimeter (%)
3) Amount of food multiplied by salinity × 0.01 (g)
4) Salt content of each dish group divided by total salt content of the meal × 100 (%)
5) Mean±SD
abcd: Means with different superscripts are significantly different among groups by Duncan's multiple range test
***: p < 0.001
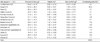
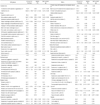
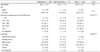
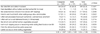
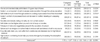
Table 7
Dish frequency questionnaire (DFQ)
1) Mean ± SD, Standard score is 'Once per week = 1'.
2) Except bibimguksu, noodles mixed with vegetables and red pepper sauce
3) Sum of values calculated by multiplying weighed score according to the sodium content of serving size and consumption frequency (adopted from Son et al 2005)
*: p < 0.05, **: p < 0.01 ***: p < 0.001 significantly different between the groups by t-test
References
1. Ahn S, Park S, Kim JN, Han SN, Jeong SB, Kim HK. Salt content of school meals and comparison of perception related to sodium intake in elementary, middle, and high schools. Nutr Res Pract. 2013; 7(1):59–65.
2. Brion MJ, Ness AR, Davey Smith G, Emmett P, Rogers I, Whincup P, Lawlor DA. Sodium intake in infancy and blood pressure at 7 years: findings from the Avon longitudinal study of parents and children. Eur J Clin Nutr. 2008; 62(10):1162–1169.
3. de Wardener HE, MacGregor GA. Harmful effects of dietarysalt in addition to hypertension. J Hum Hypertens. 2002; 16(4):213–223.
4. Gillespie AH. A theoretical framework for studying school nutrition education program. J Nutr Educ. 1981; 13(4):131–133.
5. He J, Whelton PK, Appel LJ, Charleston J, Klag MJ. Long-term effects of weight loss and dietary reduction on incidence of hypertension. Hypertension. 2000; 35(2):544–549.
6. Hooper L, Bartlett C, Davey Smith G, Ebrahim S. Systematic review of long term effects of advice to reduce dietary salt in adults. BMJ. 2002; 325(7365):628.
7. Jung EJ, Son SM, Kwon JS. The effect of sodium reduction education program of a public health center on the blood pressure, blood biochemical profile and sodium intake of hypertensive adults. Korean J Community Nutr. 2012; 17(6):752–771.
8. Jung HR, Lee MJ, Kim KC, Kim JB, Kim DH, Kang SH, Park JS, Kwon KI, Kim MH, Park YB. Survey on the sodium contents of nursery school meals in Gyeonggi-do. J Korean Soc Food Sci Nutr. 2010; 39(4):526–534.
9. Kannel WB. Blood pressure as a cardiovascular risk factor: prevention and treatment. JAMA. 1996; 275(20):1571–1576.
10. Kim JA, Kim YH, Ann MY, Lee YK. Measurements of salinity and salt content by menu types served at industry foodservice operations in Daegu. Korean J Community Nutr. 2012; 17(5):637–651.
11. Kim KO, Hwang IK. A study on salt taste preference and food habits. Saenghwalgwahagyeongu-Seouldaehakgyo. 1992; 17:61–64.
12. Kim YS, Paik HY. Measurement of Na intake in Korean adult females. Korean J Nutr. 1987; 20(5):341–349.
13. Lim HJ. A study on the calcium and sodium intakes and urinary calcium excretion of preschool children in Busan. Korean J Nutr. 2001; 34(7):786–796.
14. Meneton P, Jeunemaitre X, Wardener HE, MacGregor GA. Links between dietary salt intake, renal salt handling, blood pressure and cardiovascular diseases. Physiol Rev. 2005; 85(2):679–715.
15. Ministry of Health and Welfare, Korea Centers For Disease Control and Prevention. The fifth Korea national health & nutrition examination survey (KNHANES V). 2011. cited 2012 March 29. Available from http://knhanes.cdc.go.kr/.
16. Ministry of Health and Welfare. 2013. cited 2013 May 9. Available from http://stat.mw.go.kr/front/statData/publicationView.jsp?menuId=40&bbsSeq=6&nttSeq=20721&searchKey=&searchWord=&nPage=1.
17. Pangborn RM, Pecore SD. Taste perception of sodium chloride in relation to dietary intake of salt. Am J Clin Nutr. 1982; 35(3):510–520.
18. Shin EK, Lee HJ, Jun SY, Park EJ, Jung YY, Ahn MY, Lee YK. Development and evaluation of nutrition education program for sodium reduction in foodservice operations. Korean J Community Nutr. 2008; 13(2):216–227.
19. Shin EK, Lee YK. Evaluation of food and nutrient intake of preschool children in day-care centers. J Korean Soc Food Sci Nutr. 2005; 34(7):1008–1017.
20. Sohn CY, Pak HO. A survey on the foodservice management practice at child care centers in Gyeonggi area. J East Asian Soc Diet Life. 2011; 21(4):577–586.
21. Son SM, Huh GY, Lee HS. Development and evaluation of validity of short dish frequency questionnqire (DFQ) and short DFQ using Na index for estimation of habitual sodium intake. Korean J Community Nutr. 2005; 10(5):677–692.
22. Son SM, Park YS, Lim WH, Kim SB, Jeong YS. Development and evaluation of validity of short dish frequency questionnqire (DFQ) for estimation of habitual sodium intake for Korean adults. Korean J Community Nutr. 2007; 12(6):838–853.
23. Song ES, Kim EG. A survey on the foodservice management system of the child care centers in Chungnam Asan area. Korean J Community Nutr. 2009; 14(6):846–860.
24. The Korean Nutrition Society. Dietary reference intakes for Koreans. First revision. Seoul: Hanarum publishing;2010.
25. Tsugane S. Salt, salted food intakes, and risk of gastric cancer:epidemiologic evidence. Cancer Sci. 2005; 96(1):1–6.
26. Yon M, Lee Y, Kim D, Lee J, Koh E, Nam E, Shin H, Kang BW, Kim JW, Heo S, Cho HY, Kim CI. Major sources of sodium intake of the Korean population at prepared dish level-based on the KNHANES 2008 & 2009-. Korean J Community Nutr. 2011; 16(4):473–487.
 XML Download