

 PDF
PDF ePub
ePub Citation
 Print
Print


Abstract
Figures and Tables
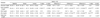
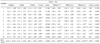
Table 3
1) Difference 1= difference (8weeks-baseline), Difference 2=difference (16weeks-8week), Difference 3=difference (16weeks-baseline)
2) Mean ± SD
3) *: Means significantly different among 3 times at p < 0.05, **: p < 0.01, ***: p < 0.001 by repeated GLM
4) @: Means significantly different between baseline and 8weeks or 8weeks and 16weeks or baseline and 16weeks within group at p < 0.05, @@: p < 0.01, @@@: p < 0.001 by paired t-test
5) #: Means significantly different among 3 differences at p < 0.05, ##: p < 0.01, ###: p < 0.001 by one-way GLM
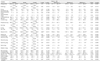
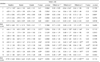
Table 4
1) Difference 1 = difference (8 weeks-baseline), Difference 2 = difference (16 weeks-8 week), Difference 3 = difference (16 weeks-baseline)
2) Mean ± SD
3) *: Means significantly different among 3 times at p < 0.05, **: p < 0.01, ***: p < 0.001 by repeated GLM
4) @: Means significantly different between baseline and 8weeks or 8weeks and 16weeks or baseline and 16weeks within group at p < 0.05, @@: p < 0.01, @@@: p < 0.001 by paired t-test
5) #: Means significantly different among 3 differences at p < 0.05, ##: p < 0.01, ###: p < 0.001 by one-way GLM
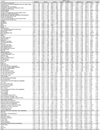
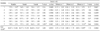
Table 5
1) Difference 1 = difference (8 weeks-baseline), Difference 2 = difference (16 weeks-8week), Difference 3 = difference (16 weeks-baseline)
2) Mean ± SD
3) @: Means significantly different between baseline and 8weeks or 8weeks and 16weeks or baseline and 16weeks within group at p < 0.05, @@: p < 0.01, @@@: p < 0.001 by paired t-test
4) mean % of RNI (Recommended Nutrient Intake of Dietary reference intakes for Koreans)
5) #: Means significantly different among 3 differences at p < 0.05, ##: p < 0.01, ###: p < 0.001 by one-way GLM
6) *: Means significantly different among 3 times at p < 0.05, **: p < 0.01, ***: p < 0.001 by repeated GLM
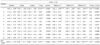
Table 6
1) Difference 1 = difference (8 weeks-baseline), Difference 2 = difference (16 weeks-8week), Difference 3 = difference (16 weeks-baseline)
2) Mean ± SD
3) *: Means significantly different among 3 times at p < 0.05, **: p < 0.01, ***: p < 0.001 by repeated GLM
4) #: Means significantly different among 3 differences at p < 0.05, ##: p < 0.01, ###: p < 0.001 by one-way GLM
5) @: Means significantly different between baseline and 8weeks or 8weeks and 16weeks or baseline and 16weeks within group at p < 0.05, @@: p < 0.01, @@@: p < 0.001 by paired t-test
Table 7
1) Difference 1 = difference (8weeks-baseline), Difference 2 = difference (16 weeks-8 week), Difference 3 = difference (16weeks-baseline)
2) Mean ± SD
3) *: Means significantly different among 3 times at p < 0.05, **: p < 0.01, ***: p < 0.001 by repeated GLM
4) @: Means significantly different between baseline and 8weeks or 8weeks and 16weeks or baseline and 16weeks within group at p < 0.05, @@: p < 0.01, @@@: p < 0.001 by paired t-test
5) #: Means significantly different among 3 differences at p < 0.05, ##: p < 0.01, ###: p < 0.001 by one-way GLM
6) Total score = 100
Nutrition labeling shows sodium contents of processed food
Canned foods and instant foods contain lots of sodium
Using spices such as vinegar, mustard or soybean sauce instead of salt can reduce sodium intake
Salt substitute is a good way to reduce sodium intake
Increased risk of hypertension is associated with high level of serum triglycerides
Having family history of hypertension can elevate incidence of hypertension to descendent
Lowering body weight can reduce blood pressure
All the elderly has high blood pressure
Stress can lead to elevate blood pressure
Pregnancy can lead to elevate blood pressure in female
Table 8
1) Difference 1 = difference (8 weeks-baseline), Difference 2 = difference (16 weeks-8 week), Difference 3 = difference (16 weeks-baseline)
2) Mean ± SD
3) *: Means significantly different among 3 times at p < 0.05, **: p < 0.01, ***: p < 0.001 by repeated GLM
4) @: Means significantly different between baseline and 8weeks or 8weeks and 16weeks or baseline and 16weeks within group at p < 0.05, @@: p < 0.01, @@@: p < 0.001 by paired t-test
5) #: Means significantly different among 3 differences at p < 0.05, ##: p < 0.01, ###: p < 0.001 by one-way GLM
6) Total score = 100
Enjoying dried seafoods or seasoned fish
Enjoying salted fish such as salted spicy pollack roe
Enjoying cooked rice topped with seasoned meats/seafoods or one-dish meal
Usually drinking all soup or stew
Enjoying instant foods such as ramyon, canned food, ham.
Eating-out or taking delivery dishes more than twice a week
Enjoying Kimchi and pickled vegetables
Adding lots of soy-sauce or vinegar-hot pepper paste to fried foods, pan-fried foods or sashimi
Enjoying salty taste and thinking that salty taste is important one
Usually using soy-sauce than vinegar when cooking vegetables
Table 9
1) Difference 1 = difference (8 weeks-baseline), Difference 2 = difference (16 weeks-8 week), Difference 3 = difference (16 weeks-baseline)
2) Mean ± SD
3) @: Means significantly different between baseline and 8weeks or 8weeks and 16weeks or baseline and 16weeks within group at p < 0.05, @@: p < 0.01, @@@: p < 0.001 by paired t-test
4) *: Means significantly different among 3 times at p < 0.05, **: p < 0.01, ***: p < 0.001 by repeated GLM
5) #: Means significantly different among 3 differences at p < 0.05, ##: p < 0.01, ###: p < 0.001 by one-way GLM
Having 3 meals a day without missing any meal
Having breakfast everyday
Having enough time when eating
Having meals often after 10 PM.
Eating until feeing full.
Having cereals such as rice, breads, noodles, potatoes every meal.
Having meats or eggs more than once a day
Having fishes more than once a day
Having soybean products such as tofu or soymilk everyday
Having vegetable dishes (except kimchi) everyday
Having dishes cooking with oils every meal
Having milk or dairy products everyday
Having fruits everyday
Trying to have various foods in a day
Table 10
1) Difference 1 = difference (8 weeks-baseline), Difference 2 = difference (16 weeks-8 week), Difference 3 = difference(16 weeks-baseline)
2) Mean ± SD
3) *: Means significantly different among 3 times at p < 0.05, **: p < 0.01, ***: p < 0.001 by repeated GLM
4) @: Means significantly different between baseline and 8weeks or 8weeks and 16weeks or baseline and 16weeks within group at p < 0.05, @@: p < 0.01, @@@: p < 0.001 by paired t-test
5) Total score = 70
Having three meals a day regularly
Always having appropriate amount of fruits, vegetables and cereals
Concerning about lowering salty foods
Concerning about lowering consumption of foods with lots of sugar
Concerning about lowering consumption of processed foods and instant foods
Doing exercise more than three times a week regularly
Concerning about health and reading the information about health management
 XML Download