

 PDF
PDF ePub
ePub Citation
 Print
Print


Abstract
This study was intended to investigate the sodium-related perception, dietary behavior, and practicability of methods for reducing sodium intake(RSI) according to the stage of change in consumers. The survey was conducted to 770 housewives, among them 553 subjects who answered the key questions for the stage of change were categorized into ''aintenance (M)' stage (maintaining reduced salt intake for more than 6 months; n = 287, 51.90%), 'Action (A)' stage (maintaining reduced salt intake for less than 6 months; n=139, 25.14%), and 'Pre-Action (P)'stage (not starting reduced salt intake; n = 127, 22.97%). The subjects in M and A were significantly older than those in P (p < 0.01). The scores of desirable dietary habit and dietary balance were the highest in M followed by A and P. When eating out, the subjects in P considered 'price' more and 'healthiness of food' less than those in M and A did. Among the guidelines for RSI, 'Avoid Processed Foods', 'Eat enough vegetables and fruits' and 'Add little amount of dipping sauce for fried food' were selected as the three easiest items to perform. With regard to the sodium-related perception, the subjects in M considered eating-out food to be more salty than homemade dishes, read nutrition labels more, avoided table salt or dipping sauce for fried food more, and had 'own low-sodium recipe' than those in P (p < 0.001). It is suggested that practicability of actions for RSI and the stage of change should be considered to develop effective personalized education program and nutrition guidance.
Figures and Tables
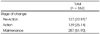
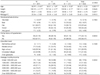
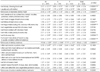
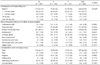
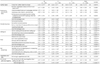
Table 5
Dish consumption frequency according to the stage of change for reducing sodium intake
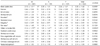
1) Mean ± SD
2) Rank within each group
3) Except bibimguksu, noodles mixed with vegetables and red pepper sauce
4) A kind of noodle dish made by cutting noodles from wheat-flour dough that has been rolled evenly thin.
5) Cooked with salty sauce and white radish or vegetables
6) Mean values are significantly different among the groups by DUNCAN's multiple range test
M = Maintenance stage, A = Action stage, P = Pre-Action stage
*: p < 0.05
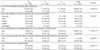
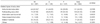
Table 6
Practicability of guidelines for reducing sodium intake according to the stage of change for reducing sodium intake
References
1. Ahn Y, Kim KW. Beliefs regarding vegetable consumption, self-efficacy and eating behaviors according to the stages of change in vegetable consumption among college students. Korean J Community Nutr. 2012. 17(1):1–13.
2. Anliker J, Damron D. Using the stage of change model in a 5 day guidebook for WIC. J Nutr Educ. 1999. 31(31):175–176.
3. Brug J, Hospers HJ, Kok G. Differences in psychosocial factors and fat consumption between stages of change for fat reduction. Psychol Health. 1997. 12:719–727.
4. Chobanian AV, Bakris GL, Black HR. The seventh report of the joint national committe on prevention, detection, evaluation and treatment of high blood pressure: the JNC 7 report. JAMA. 2003. 289:2560–2572.
5. Cho MK. Development of education materials for lowing sodium intake and analysis of educational effects for elementary students. 2008. ChangWon National University;73–180. MS thesis.
6. Contendo IR, Balch GI, Bronner YL, Lytle LA, Maloney SK, Olson CM, Swadener SS. The effectiveness of nutrition education and implications for nutrition education policy, programs, and research: a review of research. J Nutr Educ. 1995. 27(6):277–422.
7. Cohen HW, Hailpern SM, Fang J, Alderman MH. Sodium intake and mortality in the NHANES II follow-up study. Am J Med. 2006. 119(3):275.e7–275.e14.
8. Houston MC. Sodium and hypertensions. Arch Intern Med. 1986. 146:179–185.
9. Kim HJ. Development of sodium usage behavior questionnaire and a case-control study on dietary factors related to hypertension in Koreans. 2006. Seoul National University;72–77. Doctoral thesis.
10. Korea Food and Drug Administration. Korea Health Industry Development Institute. The office of National Assembly Sook-Mee Son, The Symposium of reducing sodium intake. 2010.
11. Korea Food and Drug Administration. Nutrition education material. 2012. cited 2012 August 1. Available from http://www.foodnara.go.kr/Na_down/res/contents/edudatalist.mk?na_ed_type=4.
12. Lee Y, Park HN. The effectiveness of Na education program in elementary school, -Six month follow-up study-. Korean J Community Nutr. 2010. 15(5):603–613.
13. Ministry of Health and Welfare. Korea Health Industry Development Institute. The third Korea National Health Nutrition Examination Survey (KNHANES III), 2005 -Nutrition Survey (I, II). 2006.
14. Ministry of Health & Welfare. Korea Centers for Disease Control & prevention. 2010 National Health Statics. Korea National Health and Nutrition Examination Survey (KNHANES IV-3). 2011.
15. Mori K, Suzuki H, Wang DH, Takaki J, Takigawa T, Ogino K. Relationship of psychological factors with physical activity stage of change in prime-and middle-aged Japanese. Acta Med Okayama. 2009. 63(2):97–104.
16. Miura K, Nakagawa H. Can dietary changes reduce blood pressure in the long term. Curr Opin Nephrol Hypertens. 2005. 14:253–257.
17. National Heart, Lung, and Blood Institute. Your guide to lowering your blood pressure with DASH. 2006. [cited 2012 August 1].
18. Oh SY, Cho MR, Kim JO, Cho YY. Comparison of nutritional status and beliefs on health behavior regarding stages of change in dietary fat reduction among Korean men and women. Korean J Nutr. 2001. 34(2):222–229.
19. O'Shaughnessy KM. Role of diet in hypertension management. Curr Hypertens Rep. 2006. 8(4):292–297.
20. Park YS, Son SM, Lim WJ, Kim SB, Chung YS. Comparison of dietary behaviors related to sodium intake by gender and age. Korean J Community Nutr. 2008. 13(1):1–12.
21. Park YS, Lee CW, Suh CS, Lee BK, Lee HS. Nutrition education and counseling. 2010. Paju: Kyomunsa;17–31.
22. Sim E, Kim JS, Ji JS, Sohn SM, Hwang TY, Chung JA, Chung EJ. The effects of a nutrition and body shape education program as part of health promoting projects in an elementary school. Korean J Nutr. 2010. 43(4):382–394.
23. Son SM, Kim MJ. The effect of nutrition education program for various chronic disease in elderly visiting public health center. Korean J Community Nutr. 2001. 6(4):668–677.
24. Son SM, Huh GY, Lee HS. Development and evaluation of validity of Dish Frequency Questionnaire (DFQ) and short DFQ using Na Index for estimation of habitual sodium intake. Korean J Community Nutr. 2005. 10(5):677–692.
25. Son SM, Lee KH, Kim KW, Lee YK. Nutrition education and counseling practice. 2007a. Seoul: Life Science Publishing Co.;26–29.
26. Son SM, Park YS, Lim WJ, Kim SB, Jeong YS. Development and evaluation of validity of short Dish Frequency Questionnaire (DFQ) for estimation of habitual sodium intake for Korean adults. Korean J Community Nutr. 2007b. 12(6):838–853.
27. Suh Y, Chung Y. Comparison of mineral and vitamin intakes according to the stage of change in fruit and vegetable intake for elementary school students in Chungnam province. Korean J Nutr. 2008. 41(7):658–666.
28. Taylor T, Serrano E, Anderson J, Kendall P. Knowledge, skills and behavior improvements on peer educators and low-income hispanic participants after a stage of change-based bilingual nutrition education program. J Community Health. 2000. 25(3):241–262.
29. Yim KS. The effects of a nutrition education program for hypertensive female elderly at the public health center. Korean J Community Nutr. 2008. 13(5):640–652.
30. Yon M, Lee Y, Kim D, Lee J, Koh E, Nam E, Shin H, Kang BW, Kim JW, Heo S, Cho HY, Kim CI. Major sources of sodium intake of the Korean population at prepared dish level -Based on the KNHANES 2008 & 2009-. Korean J Community Nutr. 2011. 16(4):473–487.
 XML Download