ABSTRACT
Background:
To validate Omron HEM 907 XL blood pressure monitor (test device) against auscultatory mercury sphygmomanometer in children aged 7–18 years old in accordance with International Protocol of European Society of Hypertension revised in 2010 (ESH-IP2) and British Hypertension Society (BHS) protocol.
Methods:
Seventy-five children and adolescents were recruited for the study. A validation procedure was performed following the protocol which was prepared on the basis of ESH-IP2 and BHS protocol for children and adolescents. Each underwent 7 sequential blood pressure (BP) measurements alternatively with a mercury sphygmomanometer and the test device. The results were analyzed according to the validation criteria of ESH-IP2.
Results:
The mean BP (± standard deviation [SD]) difference of absolute value between the test device and mercury sphygmomanometer readings in all the 75 subjects was 3.26 ±3.08 mm Hg for systolic BP and 4.11 ±3.50 mm Hg for diastolic BP. These results fulfilled AAMI criterion of mean ±SD below 5 ±8 mm Hg for both systolic and diastolic BP. The proportion of test device-observer mercury sphygmomanometer BP differences within 5, 10 and 15 mm Hg were 81%, 96%, 99% for SBP and 72%, 93%, 99% for diastolic blood pressure (DBP), respectively, in the part 1 analysis, so both systolic blood pressure (SBP) and DBP passed the part 1 criteria. As for the part 2 analysis, SBP passed the criteria, bur DBP failed.
References
1. Daniels SD, Meyer RA, Loggie JM. Determinants of cardiac involvement in children and adolescents with essential hypertension. Circulation. 1990; 82:1243–8.

2. Barker DJ, Bagby SP, Hanson MA. Mechanisms of disease: in utero programming in the pathogenesis of hypertension. Nat Clin Pract Nephrol. 2006; 2:700–7.

3. Sorof JM, Lai D, Turner J, Poffenbarger T, Portman RJ. Overweight, ethnicity, and the prevalence of hypertension in school-aged children. Pediatrics. 2004; 113:475–82.

4. Cha KB, Kim SA, Kang WK, Park WS. Estimating the burden of diseases due to hypertension in Korea. Korean Hypertens J. 2007; 13:32–40.
5. National High Blood Pressure Education Program Working Group on High Blood Pressure in Children and Adolescents . The fourth report on the diagnosis, evaluation, and treatment of high blood pressure in children and adolescents. Pediatrics. 2004; 114:555–76.

6. Lim KA, Yoon SY, Lee JY, Jung JW, Hong YM, Kim NS. Normal blood pressure values and percentile curves below 3 years of age in Korea. Korean Hypertens J. 2006; 12:27–38.
7. Korea Centers for Disease Control and Prevention . The Korean Pediatric Society, Committee on Growth Chart of Korean Children and Adolescents. 2007 Korean national growth charts. Seoul: Korea Centers for Disease Control and Prevention, The Korean Pediatric Society;2007.
8. Lee CG, Moon JS, Choi JM, Nam CM, Lee SY, Oh K, et al. Normative blood pressure references for Korean children and adolescents. Korean J Pediatr. 2008; 51:33–41.

9. Pickering TG. What will replace the mercury sphygmomanometer? Blood Press Monit. 2003; 8:23–5.
10. Centers for Disease Control (CDC) . National Health and Nutrition Examination Survey (NHANES) Health Tech/ Blood Pressure Procedure Manual. Hyattsville, MD: CDC;2009.
11. O’Brien E, Petrie J, Littler WA. de Swiet M, Padfield PL, Altman D, et al. The British Hypertension Society protocol for the evaluation of blood pressure measuring devices. J Hypertens. 1993; 11:S43–63.
12. O’Brien E, Atkins N, Stergiou G, Karpettas N, Parati G, Asmar R, et al. European Society of Hypertension International Protocol revision 2010 for the validation of blood pressure measuring devices in adults. Blood Press Monit. 2010; 15:23–38.
13. Association for the Advancement of Medical Instrumentation (AAMI) . The national standard of electronic or automated sphygmomanometers Arlington. VA: AAMI;1987.
14. Wong SN, Tz Sung RY, Leung LC. Validation of three oscillometric blood pressure devices against auscultatory mercury sphygmomanometer in children. Blood Press Monit. 2006; 11:281–91.

15. O’Brien E, Pickering T, Asmar R, Myers M, Parati G, Staessen J, et al. Working Group on Blood Pressure Monitoring of the European Society of Hypertension International Protocol for validation of blood pressure measuring devices in adults. Blood Press Monit. 2002; 7:3–17.
16. O’Brien E. Formation of the Working Group on Blood Pressure Monitoring of the European Society of Hypertension. Blood Press Monit. 1998; 3:133–4.
17. Bland JM, Altman DG. Statistical methods for assessing agreement between two methods of clinical measurement. Lancet. 1986; 1:307–10.

18. O’Brien E, Petrie J, Littler W. de Swiet M, Padfield PL, O’Malley K, et al. The British Hypertension Society protocol for the evaluation of automated and semi-automated blood pressure measuring devices with special reference to ambulatory systems. J hypertens. 1990; 8:607–19.
19. Narogan MV, Narogan MI, Syutkina EV. Validation of A&D UA-778 blood pressure monitor in children. Blood Press Monit. 2009; 14:228–31.
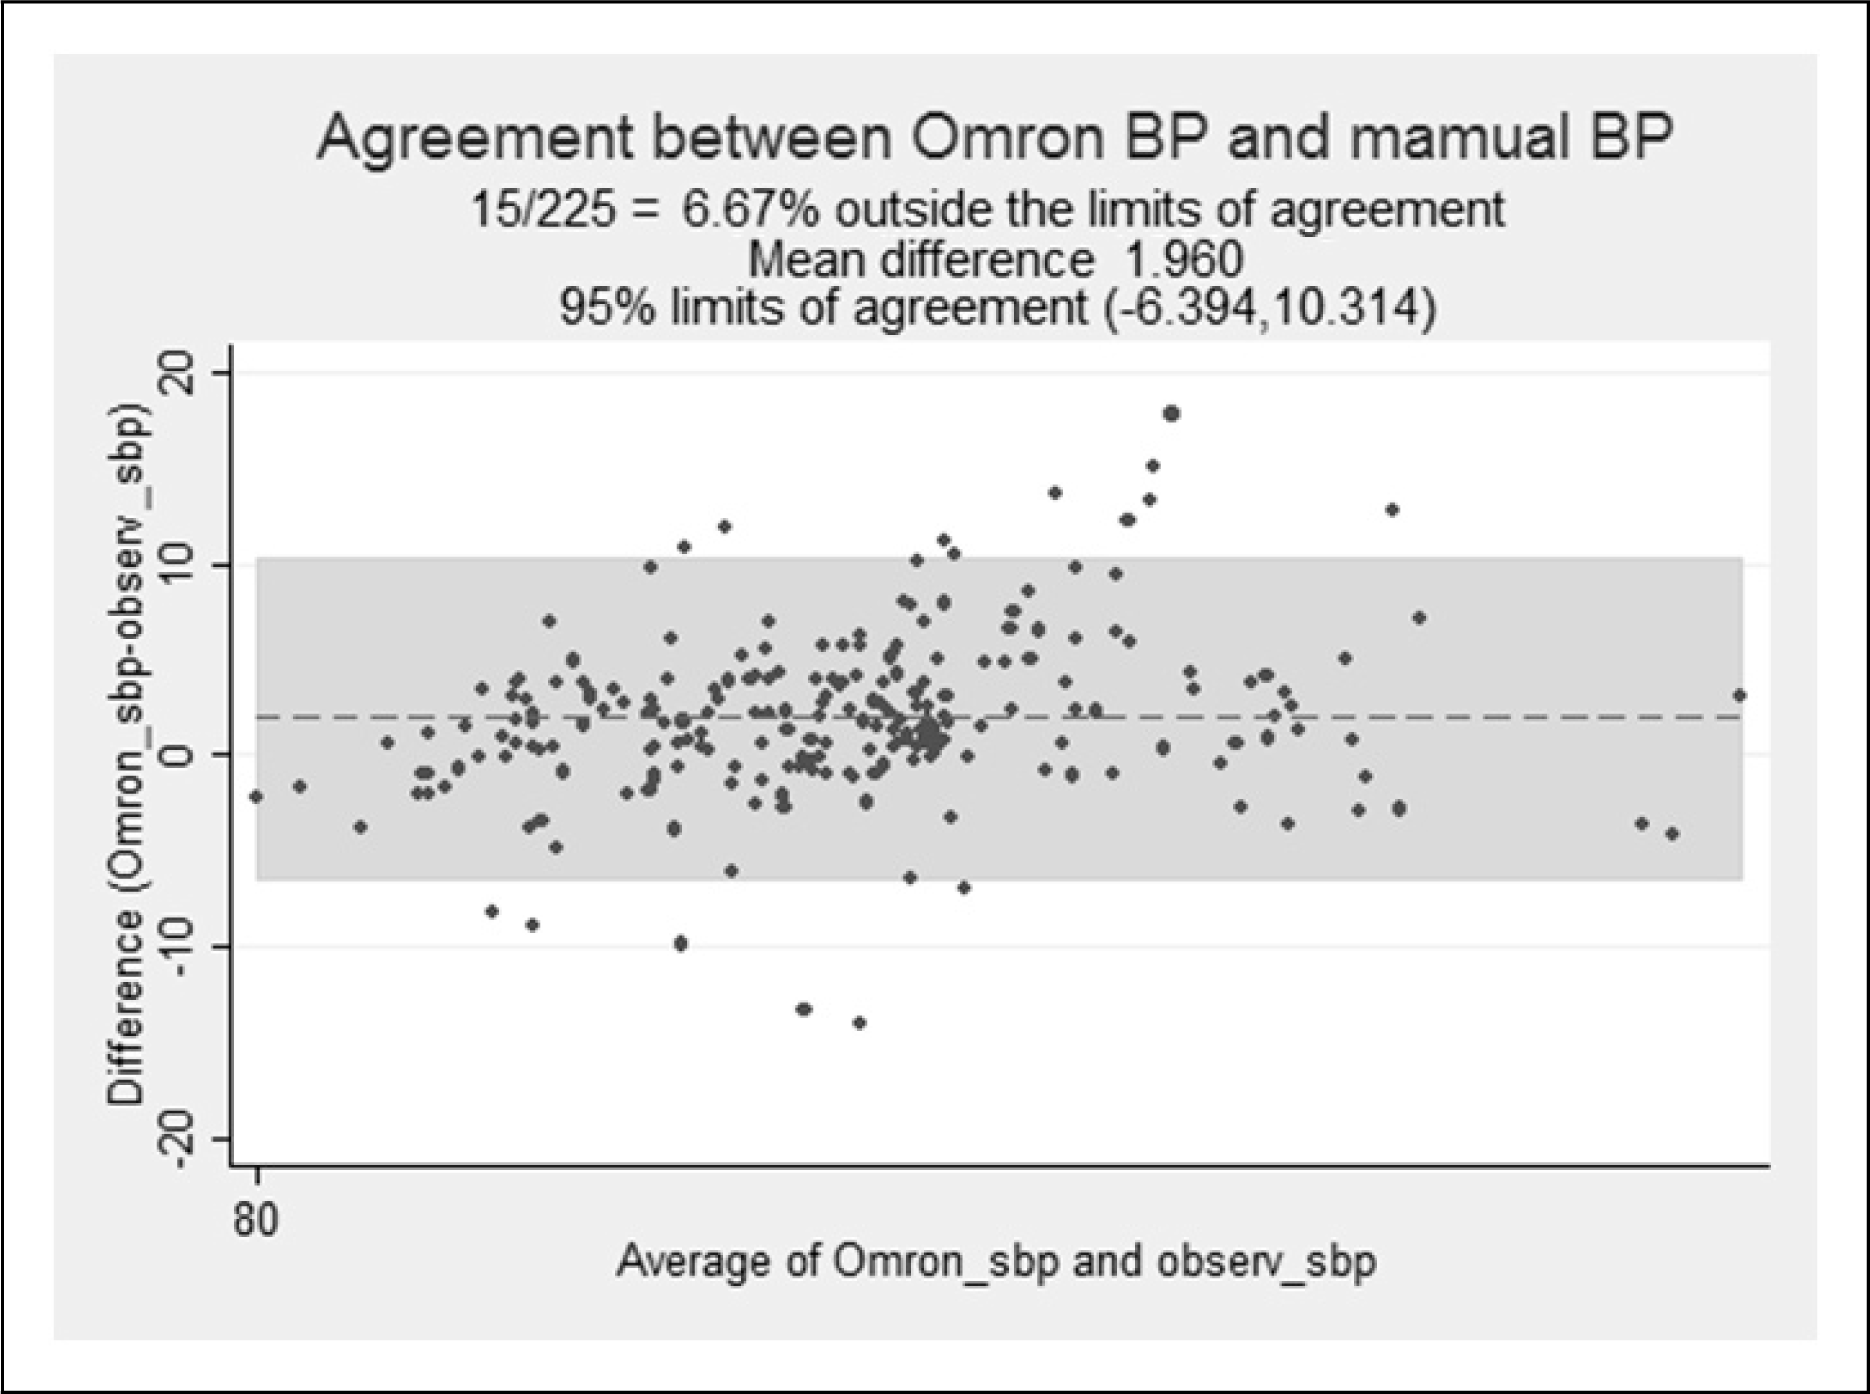
Fig. 1.
Plot of pressure differences between the test device and the better observer (y-axis), and mean pressure of the observer and the device (x-axis), for systolic blood pressure in children and adolescents. BP, blood pressure.

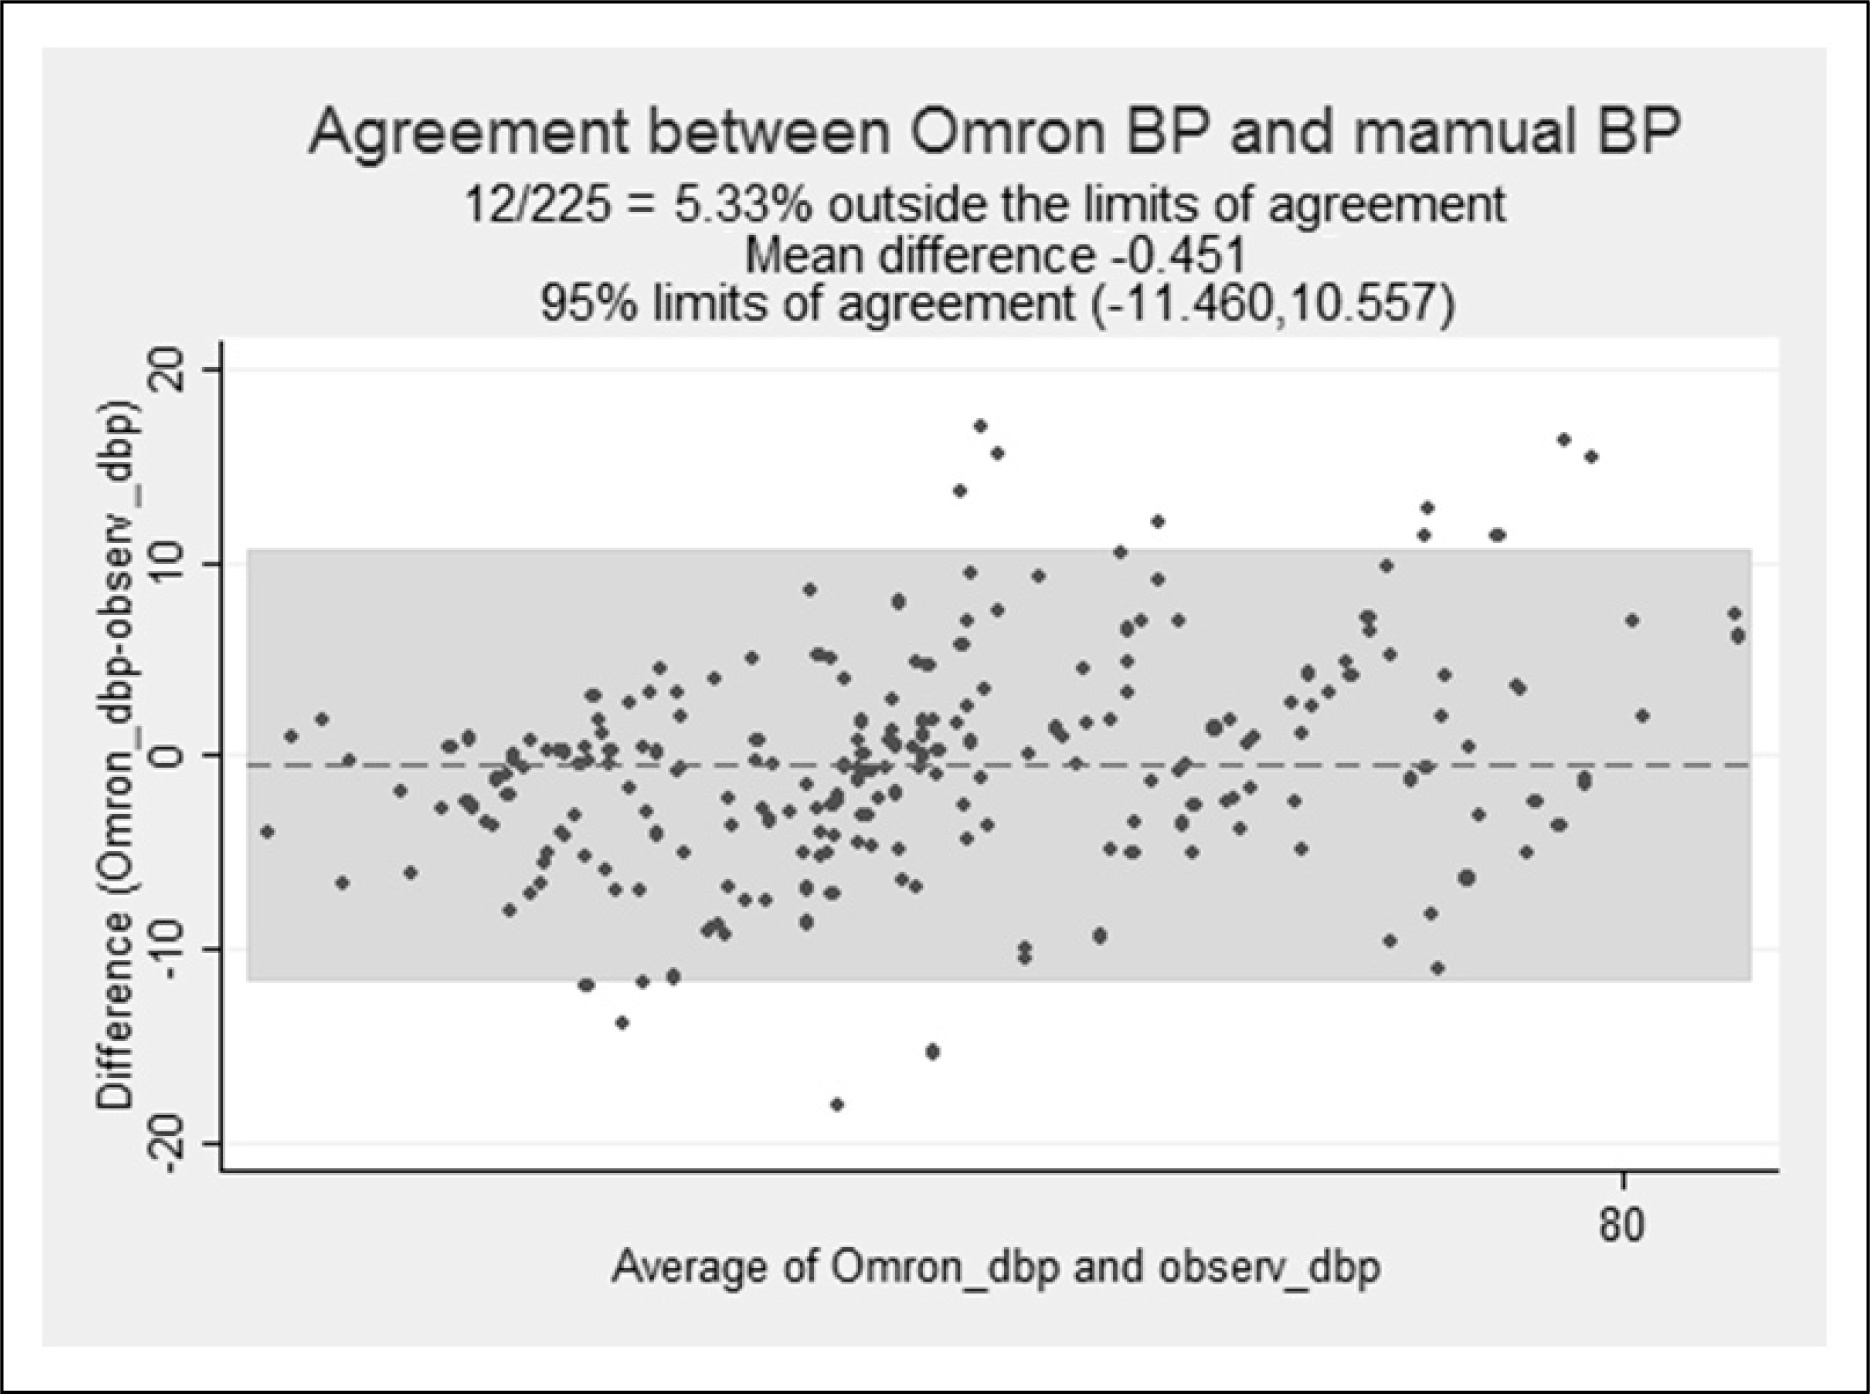
Fig. 2.
Plot of pressure differences between the test device and the better observer (y-axis), and mean pressure of the observer and the device (x-axis), for diastolic blood pressure in children and adolescents. BP, blood pressure.

Table 1.
Distribution of subjects by age and sex
| Age (yr, month) | Male | Female | Number |
|---|---|---|---|
| 7,0 – 10,11 | 13 | 12 | 25 |
| 11,0 – 14,11 | 15 | 11 | 26 |
| 15,0 – 18,11 | 17 | 8 | 25 |
| Total | 45 | 31 | 76 |
Table 2.
Means and SDs of BP by sex, age and 50 percentile of height among Korean children and adolescents
Table 3.
Subjects details
Table 4.
Distribution of subjects by the range of blood pressure (BP) (7 – 18 years of age)
| Male | Femal | e Total | |
|---|---|---|---|
| Systolic BP (mm Hg) | |||
| Low < ‑ 1SD | 2 | 6 | 8 |
| Mean | 33 | 25 | 58 |
| High > + 1SD | 8 | 1 | 9 |
| Diastolic BP (mm Hg) | |||
| Low < ‑ 1SD | 1 | 6 | 7 |
| Mean | 29 | 20 | 49 |
| High > + 1SD | 13 | 6 | 19 |
Table 5.
Observer measurements in each recruitment range
| SBP (mm Hg) | DBP (mm Hg) | ||
|---|---|---|---|
| Range | 82 : 147 | Range | 43 : 81 |
| Low (< 90) | 9 | Low (< 50) | 9 |
| Medium (90 – 130) | 207 | Medium (50 – 80) | 215 |
| High (> 130) | 9 | High (> 80) | 1 |
| Maximum difference | 198 | Maximum difference | 214 |
Table 6.
Observer differences
| SBP (mm Hg) | DBP (mm Hg) | Repeat | |
|---|---|---|---|
| Observer 1 - | |||
| Observer 2 | |||
| Range (low : high) | 0 : 3 | 0 : 4 | |
| Mean (± SD) | 0.8 (0.9) | 0.9 (1.0) | 12 |
Table 7.
Results of the validation analysis of blood pressure readings (n = 225)


 PDF
PDF ePub
ePub Citation
 Print
Print


 XML Download