

 PDF
PDF ePub
ePub Citation
 Print
Print


Introduction
Cone-beam computed tomography (CBCT) is an imaging modality with several applications in dento-maxillofacial diagnosis. In computed tomography (CT) imaging, both the X-ray source and the detectors rotate synchronously around the patient and acquire multiple projections from different angles. The X-ray attenuation measured at these different projections is then translated into sectional images using reconstruction algorithms. In the CT data, each voxel in the reconstructed CT volume is assigned a numerical value, called a CT number, and is also referred to as the gray value. The CT number is a function of the linear attenuation coefficient of this voxel and thus, indicates the amount of X-ray attenuation in the represented tissue. In multislice CT (MSCT), the range of CT numbers is depicted on a scale of Hounsfield units (HU), where the CT numbers of water and air are set at 0 and - 1000, respectively.1 Ideally, the CT number measured at a region of interest (ROI) should be highly representative of the X-ray attenuation of the corresponding tissue region. A practical application of such measurements is quantitative CT, where MSCT images of the patient's lumbar spine and hip are acquired with a calibration phantom, to enable a conversion of the CT numbers measured to bone mineral density.2,3 Several factors influence the magnitude of CT numbers, including X-ray beam energy, filtration, collimation, field of view, and the reconstruction algorithms used.4,5,6,7 Further, artifacts caused by beam hardening and X-ray attenuation by dense materials, such as metals, also affect the calculated CT numbers.
Unlike MSCT images, CBCT images are not depicted using a standardized scaling system. Previous studies have examined the correlation between the CT number and HU on CBCT scans.4,5,6,7 Overall, these studies have demonstrated a linear relationship between the CT number and the X-ray attenuation. However, despite this linear relationship, the practical application of measuring CT numbers on CBCT scans is limited by a number of factors that influence the magnitude of the CT numbers measured. For example, different manufacturers use different scaling systems, which influence the CT numbers. Secondly, even within the same CBCT unit, the CT numbers of the same object vary depending on the field of view (FOV), and the specific exposure settings, including the voltage (in kilovolts), current (in milliamperes), and the number of projection angles.4,5,7 The anatomic location of the object also influences the CT numbers, in medium and large FOV CBCT scans.8,9 The aim of this study was to assess the relationship between CT number and X-ray attenuation in both limited and medium FOV scans by using the Accuitomo 170 and Veraviewepocs 3De CBCT units (both units were manufactured by J. Morita Mfg. Corp. Kyoto, Japan), and the influence of anatomic location on these values.
Materials and Methods
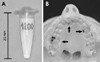
We used aqueous solutions of dipotassium phosphate (K2HPO4) to simulate X-ray absorption by bone, dentin, and enamel. K2HPO4 is a highly water-soluble salt whose effective atomic number is very close to that of calcium hydroxyapatite (15.58 and 15.86, respectively), and has been previously used as a calibration phantom to measure bone mineral density by quantitative CT.10 The effective linear attenuation coefficient of K2HPO4 is within 2.2%-2.7% of that for hydroxyapatite over the photon energy range of 20-100 keV. Solutions of K2HPO4 can be easily prepared and placed at various anatomic locations; thus, K2HPO4 is a simple and convenient reference material to evaluate X-ray attenuation. K2HPO4 was diluted at concentrations of 50, 200, 400, 600, 800, 1000, and 1200 mg/mL. This concentration range was used to simulate the attenuation characteristics of the trabecular bone (50-800 mg/mL), and of the cortical bone and dentin (1000-1200 mg/mL). 0.5-mL polypropylene tubes (diameter: 5 mm) containing the solutions were placed in empty dental sockets of a human head phantom with a soft-tissue equivalent material, as previously described.9 In brief, six teeth were carefully extracted from the skull-the upper and lower central incisors, the first premolars, and the first molars-and replaced with polypropylene tubes containing various concentrations of K2HPO4 (Fig. 1).
CBCT scans were performed using Accuitomo 170 and Veraviewepocs 3De. All exposures were set at the standard resolution mode. The exposure parameters, voxel sizes, and rotational angles for each imaging protocol are shown in Table 1. Following CT acquisition, the volumetric data were reconstructed using the "G001" reconstruction filter in the native i-Dixel software (provided by J. Morita with the Accuitomo 170 and Veraviewepocs units), and exported in the DICOM 3.0 format. The exported DICOM CT dataset is represented as 16-bit images. The DICOM files were imported into the Osirix imaging software, open source software available at http://www.osirix-viewer.com.11
On the thinnest axial slice allowed for each FOV, the mean CT numbers were measured at five heights within each tube and averaged, by selecting circular ROIs with an area of 0.055 cm2. The ROIs were located within the center of the polypropylene tube and within the anatomic confines of the tooth socket. For each K2HPO4 concentration, the CT numbers measured at the six anatomic locations were averaged. Linear regression was performed to assess the relationship between the CT number and the K2HPO4 concentration, and the coefficient of determination (R2) was calculated, as depicted by the seven imaging protocols. Slopes of the linear regression lines were compared using one-way analysis of variance (ANOVA). Next, we examined the influence of the anatomic location on the CT number.
Results
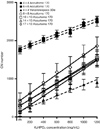
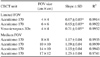
For all the imaging protocols examined, there was a strong linear relationship between the K2HPO4 concentration and the CT number (Fig. 2, R2=0.99 for Accuitomo 170 and 0.97 for Veraviewepocs 3De, Table 2). However, for all K2HPO4 concentrations, the absolute CT number differed for the various imaging protocols used. For the Accuitomo170 CBCT unit, the limited FOVs (4 cm×4 cm and 6 cm×6 cm) yielded significantly higher (p<0.001) CT numbers than the medium FOVs (8 cm×8 cm, 10 cm×10 cm, 14 cm×10 cm, and 17 cm×12 cm). The magnitude of this difference ranged from a 1.2-fold to an almost 5-fold difference. Interestingly, there was a noticeable segregation of the regression lines for the limited FOVs and the medium FOVs from the Accuitomo 170 CBCT unit. The slopes of the linear regressions for the limited FOVs were significantly lower (p<0.001) than those for the medium FOVs (Table 2).
The absolute CT numbers for the 4 cm×4 cm view from the Veraviewepocs 3De CBCT unit were considerably lower than those of the Accuitomo 170 unit. Interestingly, despite the lower CT numbers, the slope of the linear regression paralleled that of the limited FOVs of the Accuitomo 170 unit and was not significantly different (p<0.001) from the slopes of the linear regression lines on the 4 cm×4 cm and 6 cm×6 cm FOVs of this latter unit (Fig. 2, Table 2).
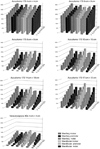
At all the anatomic locations considered, there was a linear correlation between the K2HPO4 concentration and the CT number. However, the CT number of a given concentration of K2HPO4 varied depending on the anatomic location (Fig. 3). Interestingly, the pattern of this variance differed between the two CBCT units as well as with the specific imaging protocol. Typically, for the limited FOVs on the Accuitomo 170 unit, the CT numbers of the K2HPO4 solutions were the lowest when placed in the mandibular incisor region and the highest when placed in the maxillary incisor region. In contrast, for the limited FOV on the Veraviewepocs 3De unit, the CT number was the highest in the mandibular incisor region and the lowest in the mandibular molar region. For the medium FOVs on the Accuitomo 170 unit, the CT number was the highest in the maxillary incisor region and the lowest in the maxillary molar region. Not only was the pattern of variation among anatomic locations different for the various imaging protocols, but the magnitude of these effects was also markedly dissimilar (Fig. 3).
Discussion
The major findings of our study are that the CBCT unit, the FOV size, and the anatomic location markedly influence the CT numbers measured on the limited and medium FOV CBCT scans. These results have important practical implications. There has been considerable interest in examining CT numbers on CBCT scans for various purposes, such as to determine the degree of bone mineralization at potential implant sites. However, the clinical application of such quantitative evaluations has been limited by the lack of a standardized scaling system for CT numbers during reconstructions of CBCT scans.12
In this study, we examined the influence of FOV and anatomic location on CT numbers from the Accuitomo 170 and the Veraviewepocs 3De CBCT units. Evaluation of CBCT scans from both these units showed a strong linear relationship between X-ray attenuation and CT number, which is consistent with previous studies.4,5,7,9,13,14 However, despite these strong linear correlations, our data further emphasize the complexities of applying CT numbers to infer the degree of X-ray attenuation. First, the absolute CT number varied depending on the FOV used. In the Accuitomo 170 unit, the patterns of the relationship between K2HPO4 concentration and CT number were clearly segregated for the limited and the medium FOV protocols. The limited FOV scans yielded higher CT numbers than the medium FOV scans. In addition to the numerical differences between the CT numbers from the limited and medium FOV scans, we detected that the slopes of the linear relationship for the limited FOV scans were significantly lower than those for the medium FOV scans (Fig. 2 and Table 2). Our results underscore the fact that CT numbers on scans taken with different FOVs, even on the same unit, should not be used for direct comparisons. This is underscored by the stark differences between the absolute CT numbers from the Veraviewepocs 3De unit and those from the Accuitomo 170 unit. Although the FOV was the same in both CBCT acquisitions (4 cm×4 cm), the differences in the kVp (90 kVp for the Accuitomo 170 and 80 kVp for the Veraviewepocs 3De) and the rotational arc (360° for the Accuitomo 170 unit and 180° for the Veraviewepocs 3De unit) translated into dramatic differences in the CT numbers. Perhaps, the differences in the parameters of image reconstruction between these two units can account for these differences in the CT numbers. Similarly, device and scanning settings, such as FOV, spatial resolution, number of projections, exposure time, and dose selections, have been shown to influence CT numbers.15 Thus, the clinician should be aware that scans taken with the same FOV but on different units or with different exposure factors yield different CT numbers and thus, should not be used for direct comparisons of CT numbers.
Our data showed that for the Accuitomo CBCT unit, the CT numbers from limited FOV scans were significantly higher than those from medium FOV scans. These results are in sharp contrast with previously published data15 that showed an increase in CT numbers with increasing FOV size on the Accuitomo 170 unit. This study used an automated method to measure the CT numbers at the same anatomic location on a human cadaver mandible imaged with different FOV sizes. This method is different from our approach to the measurement of CT numbers. Interestingly, the same study also analyzed CT numbers from NewTom 5G CBCT scans. Their results for this unit are in concordance with the trends for the NewTom 5G CBCT unit that we previously described.9 Thus, methodological differences alone do not explain the discrepancy between the results for the Accuitomo 170 unit. While this previous study analyzed a single site in a cadaver mandible, in the current study, we examined six anatomic locations in a human skull phantom with seven different K2HPO4 concentrations. The trend of higher CT numbers with limited FOV size was observed at all anatomic locations and at every K2HPO4 concentration. Observing the same phenomenon under varying conditions strengthens the reliability of our results.
Our data also demonstrate a considerable difference in the CT number of an object, depending on its anatomic location. This finding has important practical implications. For example, bones with similar mineralization but located at different regions in the jaws will yield different CT numbers. This underscores the complexities and limitations of using CT numbers on CBCT scans to infer bone mineral density. More importantly, our data demonstrate that the pattern of this variation differs depending on the FOV and the specific imaging protocol used. This is in agreement with the findings of our previous work, where we demonstrated an important influence of anatomic location on the CT number measured on large FOV CBCT images.9 Thus, even a comparison of CT numbers measured at different anatomic locations on the same scan is not recommended.
We found a strong linear relationship between X-ray attenuation and CT number at any given anatomic location within a particular FOV. Based on this finding, it may be tempting to consider serial CBCT imaging to monitor temporal changes in hard tissue mineralization at a specific location, such as to evaluate changes in the mineralization of a bone graft material, or to monitor demineralization of bone caused by a local or systemic disease. Even if the same imaging protocol were used, other factors such as changes in the patient's soft tissue thickness or differences in patient positioning could influence the CT number. Thus, even with the same imaging protocol on the same unit, it may not be feasible to critically analyze temporal changes in CT numbers on CBCT scans. Fabrication of imaging stents with calibration phantoms, a procedure similar to that used for quantitative CT, may conceivably facilitate the quantitative evaluation of CBCT scans. However, the placement of such intraoral reference objects to minimize the influences of anatomic location is a major obstacle to such an approach.
Some investigators have proposed that HU can be derived from CT numbers measured on CBCT scans, using factors that are specific for a given CBCT unit.4 Other studies have suggested an application of the conversion ratio to CT numbers in order to calculate the bone density using CBCT.16 Our data emphasize the complex influences of anatomic location, FOV, and different CBCT units on CT numbers. Such complex influences pose significant challenges to the development of mathematical algorithms and thus, limit the practical implications of using CT numbers from CBCT scans to reliably infer object attenuation.
It is important to note that many software programs, both machine-specific and third-party ones, provide the clinician with the ability to measure CT numbers over a particular ROI. However, such measurement tools do not consider the influence of FOV, anatomic location, and CBCT unit, and it is important for clinicians to be aware that the use of such tools to infer object density is not reliable.
The non-homogenous CT numbers on CBCT scans and their variation with the FOV and anatomic site can be attributed to a number of factors. One important factor is the amount of scattered radiation produced during a CBCT scan. It can be expected that the total Compton scatter varies with FOV as well as with anatomic sites, and plausibly, the noise from the scattered radiation contributes to the variation of CT numbers depending on the anatomic location. Additionally, Sisniega et al17 suggested that patterns of the scatter vary depending on the specific imaging geometry and the CBCT configurations. A second and crucial factor is that the entire facial skeleton is not encompassed on the CBCT scan.18 The CBCT reconstruction algorithms do not adequately account for X-ray attenuation that takes place in the tissues outside of the volume imaged, and this may contribute to the variances observed.
In conclusion, this study demonstrated a strong linear relationship between X-ray attenuation and CT number for the Accuitomo 170 and the Veraviewepocs 3De CBCT units. However, clinicians must be aware that, for limited and medium FOV scans, the specific CBCT unit, exposure settings, and anatomic location of the object markedly influence the CT number. The extent of these influences diminishes the practical application of CT numbers to reliably infer tissue density.

 XML Download