

 PDF
PDF ePub
ePub Citation
 Print
Print


In this third article about sample size determination, we will discuss sample size determination procedure for comparison of several means. Usually analysis of such data is performed using the analysis of variance (ANOVA) procedure. Because of the complex nature that more than two group means are compared, various types of effect sizes have been suggested including Cohen's f, Eta squared (η2), Partial Eta squared ( ), and Omega squared (ω2). Therefore, we will discuss sample size determination procedure using Cohen's f and then will explore various types of effect sizes for ANOVA and their interchangeability.
), and Omega squared (ω2). Therefore, we will discuss sample size determination procedure using Cohen's f and then will explore various types of effect sizes for ANOVA and their interchangeability.Sample size determination using Cohen's f measure
Cohen's f measure is an extended version of Cohen's d which is defined as a standardized difference, difference divided by standard deviation ( ) in comparison of two sample means. Cohen's f is expressed as a square root of mean squared difference divided by variance, whose numerator represents an average difference of group means from the grand mean and denominator represents the common standard deviation.
) in comparison of two sample means. Cohen's f is expressed as a square root of mean squared difference divided by variance, whose numerator represents an average difference of group means from the grand mean and denominator represents the common standard deviation. , where p is the number of groups. Based on the data in Table 1, Cohen's f is calculated as follows:
Cohen (1988) suggested that interpretation of Cohen's f was such as f = 0.1, small effect, f = 0.25, medium effect, and f = 0.40, large effect for the behavioral science.1 Therefore, the calculated Cohen's f value 0.58 can be interpreted as a large effect. If we anticipate outcome values for four comparative groups as appeared in Table 1, we can calculate the required sample size to keep small Type 1 error and large power. Let's set the condition, as α error level = 0.05 and power level = 0.8. Also four group means are assumed as 18.4, 22.2, 25.1, and 32.1, respectively, and a common standard deviation 8.6 is provided. The free software G*Power gives the result of an appropriate sample size as ten per group (total sample size = 40) with the practical power value of 0.85. The steps to perform the sample size calculation are displayed as follows:
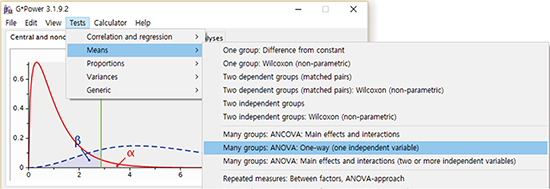
Step 1: Select statistical test types
Menu: Tests - Means - Many Groups ANOVA: One-way (one independent variable)
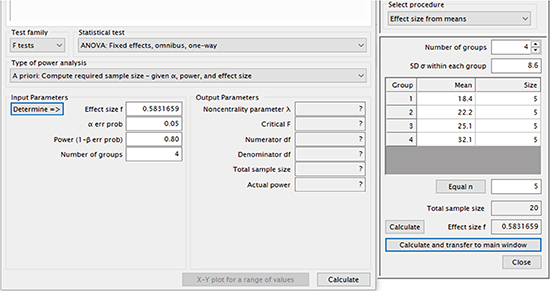
Step 2: Calculation of Cohen's f measure
Menu: Determine - select the procedure as Effect size from means - Number of groups: 4 - Provide means and common SD - Calculate - Calculate and transfer to main window
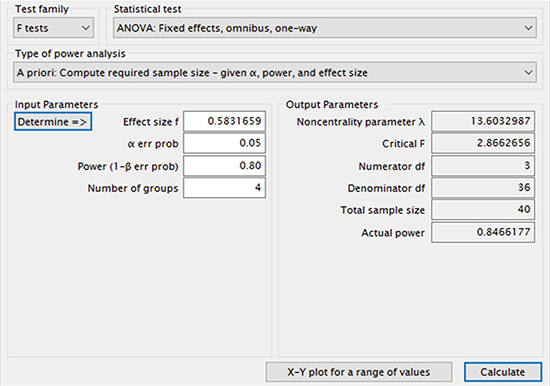
Step 3: Set α error probability = 0.05 and β error probability = 0.2 - Calculate (a total sample size of 40 and actual power level of 0.847 are obtained.)
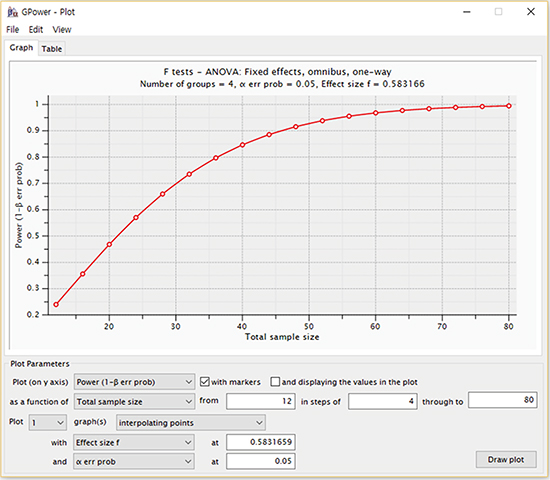
Additionally, we can check the changes of power level (1 - β error probability) as the total sample size changes from 12 to 80, given the prior conditions are fixed except β error probability as shown in the figure below.
Other types of effect sizes for ANOVA
Several types of effect sizes for ANOVA are more commonly reported compared to Cohen's f because most statistical software programs provide statistics such as total sum of squares (SStotal), sum of squares of effects (SSeffect) or sum of squares of error (SSerror), which are related to them. If previous studies report only other types of effect sizes different from Cohen's f and if group means and variances are not available, researchers should convert those effect sizes into Cohen's f to calculate an adequate sample size.
1. Eta squared (η2)
Eta squared is expressed as sum of squares between groups (SSeffect) divided by the total sum of squares of the dependent variable (SStotal),  . The quantity is the same with the usual r squared (R2) which we use as a measure of degree that a model explains the data. The estimate of η2 value was calculated as
  , which means the ANOVA model using the MATERIAL independent variable explained 34.1% of variability in the dependent variable (Table 2). Eta squared can be converted into Cohen's f and vice versa as follows:
  or η2 = f 2 / (1 + f 2).
. The quantity is the same with the usual r squared (R2) which we use as a measure of degree that a model explains the data. The estimate of η2 value was calculated as , which means the ANOVA model using the MATERIAL independent variable explained 34.1% of variability in the dependent variable (Table 2). Eta squared can be converted into Cohen's f and vice versa as follows: or η2 = f 2 / (1 + f 2). 2. Partial Eta squared ()
The effect size of partial Eta square measure is preferred to Eta squared in a two-way factorial design. The main reason is that when other independent variables are included in the model, η2 value becomes smaller compared to the original value, therefore it cannot represent an effect size in multivariate situation. The partial Eta squared is expressed as SSeffect divided by the sum of SSeffect and SSerror,  . Partial Eta squared measure can be obtained by selecting 'estimates of effect size' on the option window during performing two-way ANOVA by selecting successive procedures of Analysis - General Linear Model - Univariate in IBM SPSS statistical package version 23.0 (IBM Corp., Armonk, NY, USA). As appeared in Table 3, the estimates of values for MATERIAL, LIGHT, and the interaction term were calculated as 0.469, 0.015, and 0.410, respectively. Partial Eta squared can be converted into Cohen's f for a specific term using the formula,
. Partial Eta squared measure can be obtained by selecting 'estimates of effect size' on the option window during performing two-way ANOVA by selecting successive procedures of Analysis - General Linear Model - Univariate in IBM SPSS statistical package version 23.0 (IBM Corp., Armonk, NY, USA). As appeared in Table 3, the estimates of values for MATERIAL, LIGHT, and the interaction term were calculated as 0.469, 0.015, and 0.410, respectively. Partial Eta squared can be converted into Cohen's f for a specific term using the formula,
3. Omega squared (ω2)
The Omega squared measure was suggested to correct the biasedness of Eta squared measure. The Eta squared was slightly biased because the calculation procedure was made purely based on statistics from the sample without any adjustment considering population measure. Omega-squared is calculated as  , where SStotal and MSresidual represent total sum of squares and mean square of error, respectively, and dfeffect is degrees of freedom of the effect. An Omega square has slightly lower value and generally is considered more accurate compared to an Eta squared (Table 4). Omega squared can be approximately converted into Cohen's f using the formula,
  .
.
, where SStotal and MSresidual represent total sum of squares and mean square of error, respectively, and dfeffect is degrees of freedom of the effect. An Omega square has slightly lower value and generally is considered more accurate compared to an Eta squared (Table 4). Omega squared can be approximately converted into Cohen's f using the formula, .Cohen (1988) suggested interpretation of effect sizes expressed as η2 or ω2: small effect, η2 or ω2 = 0.01; medium effect, η2 or ω2 = 0.06; large effect, η2 or ω2 = 0.14 for the behavioral science.1


 XML Download