

 PDF
PDF ePub
ePub Citation
 Print
Print


Introduction
Gastric cancer (GC) is one of the most common malignant cancers, and gastric tumors are biologically and genetically heterogeneous.123 Several biological markers including human epidermal growth factor receptor 2 (HER2), p53, forkhead box O1A, E-cadherin, vascular epidermal growth factor receptor, and mesenchymal epidermal transition (c-MET) receptor, have been introduced.456789 Various therapies that use these biological markers have been developed, resulting in improved treatment outcomes.9 Among these markers, the reported rates for MET overexpression and MET amplification are 4% to 98% and 1.5% to 59.0%, respectively.9 These broad ranges could possibly be attributed to a variety of reasons. For example, variable antibody clones and evaluation criteria have been used to determine the expression of c-MET by immunohistochemistry (IHC) analysis in different patient populations. In addition, various molecular tests, such as in situ hybridization (ISH), quantitative real-time polymerase chain reaction, and next generation sequencing, have been used to confirm the genetic alterations in c-MET, which are mostly in the form of c-MET gene amplification. The ligand for c-MET, which is a tyrosine kinase receptor, is the hepatocyte growth factor. Upon binding of its ligand, c-MET activates downstream signaling pathways such as the ras sarcoma/effector of ras/mitogen activated protein kinase and the phosphatidylinositol 3-kinase/AKT/mechanistic target of rapamycin pathways.1011 Consequently, the abnormal or aberrant activation of c-MET signaling results in tumor cell growth, survival, migration, invasion, and tumor angiogenesis.10
Accurate evaluation tests and well-defined detailed criteria are required for the appropriate selection of patients that can benefit from targeted molecular therapies. Although molecular tests, including ISH or quantitative real-time polymerase chain reaction, are more accurate and confirmatory methods for detecting gene alterations, they have several disadvantages including high costs, the requirement for multiple steps, and time consumption compared to IHC. In daily practice, cheap, simple, and popular methods, such as IHC, are ideal for screening tests. However, unlike HER2, the evaluation criteria for c-MET expression as determined by IHC have not been fully elucidated in patients with GC.12
We performed a systematic review and meta-analysis to elucidate the correlation between the overexpression of c-MET as determined by IHC and the clinicopathological parameters. In addition, the diagnostic accuracy of IHC was investigated using concordance analysis and performing a review of the diagnostic test accuracy.
Materials and Methods
1. Published study search and selection criteria
Articles relevant to the subject of the analysis were obtained by searching the PubMed and MEDLINE databases throughout January 31, 2016 using the following key words: 'MET' or 'mesenchymal epithelial transition' and 'IHC'. The titles and abstracts of all the searched articles were screened for exclusion. The review articles were also screened to identify additional eligible studies. Subsequently, the search results were reviewed and studies were included in the analyses if (1) the study was performed in human cases of GC and (2) information about the correlation between c-MET expression as determined by IHC and clinicopathological parameters, and the amplification of the c-MET gene was available. The articles were excluded if (1) they were case reports or non-original articles or (2) they were published in a language other than English.
2. Data extraction
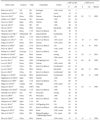
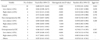
The data from all eligible studies13141516171819202122232425262728293031323334353637383940414243444546474849 were extracted by two independent authors and the extracted data were the first author's name, year of publication, study location, antibody clone and manufacturer, antibody dilution ratio, evaluation criteria, number of patients analyzed, and the data allowing the estimation of the impact of c-MET overexpression as determined by IHC on overall survival (OS). For the meta-analysis, we extract ed all the data associated with the results of the IHC analyses.
3. Statistical analysis
For the meta-analysis, all data were analyzed using the Comprehensive Meta-Analysis software package (Biostat, Englewood, NJ, USA). We investigated the correlation between the overexpression of c-MET as determined by IHC and clinicopathological parameters such as sex, tumor differentiation, HER2 positivity by IHC, primary tumor (T) stage, regional lymph node (N) stage, and distant metastasis (M) stage. The concordance rates were determined according to the agreement rates between the expression of c-MET as determined by IHC and the mutation tests. For the quantitative aggregation of survival results, the correlation between the overexpression of c-MET as determined by IHC and OS was analyzed based on the hazard ratios (HRs) that were obtained using one of three available methods. For studies lacking information on the HR or its confidence interval (CI), these variables were calculated from the presented data using the HR point estimate, log-rank statistic or its P-value, and the O-E statistic (the difference between the number of observed and expected events) or its variance. If data on the HR values were not available, they were estimated using the total number of events, number of patients at risk in each group, and the log-rank statistic or its P-value. Finally, if useful data were provided only in the form of graphical illustrations of survival distributions and survival rates, these data were extracted at specified time points to reconstruct the HR estimate and its variance under the assumption that the patients were censored at a constant rate during the time intervals.50 The published survival curves were read independently by two authors in order to reduce the interpretation bias. Subsequently, the HRs were combined into an overall HR using the Peto method.51 Because eligible studies used various clones of the c-MET antibody and different evaluation criteria for various patient populations, a random-effects model was more suitable than a fixed-effects model. The heterogeneity between the studies was assessed using the Q and I2 statistics, and the results were presented as P-values. Additionally, sensitivity analysis was performed to assess the heterogeneity of eligible studies and the impact of each study on the combined effect. In order to assess the publication bias, a Begg funnel plot and Egger test were used. If a significant publication bias was identified, the fail-safe N and trim-fill tests were performed to confirm the degree of publication bias. P<0.05 were considered to be statistically significant.
The review of diagnostic test accuracy was performed using the Meta-Disc program version 1.4 (Unit of Clinical Biostatics; the Ramon y Cajal Hospital, Madrid, Spain).52 In order to calculate the pooled sensitivity and specificity, data were collected from each eligible study and forest plots were obtained. The summary receiver operating characteristic (SROC) curve was initially constructed by plotting 'sensitivity' and '1-specificity' of each study, and curve fitting was performed through linear regression using the Littenberg and Moses linear models.53 Because the data were heterogeneous owing to differences in the evaluation criteria, the accuracy data were pooled by fitting a SROC curve and measuring the value of the area under the curve (AUC).52 An AUC close to 1 would be considered a perfect fit and an AUC close to 0.5 would be considered a poor fit. In addition, the diagnostic odds ratio (OR) was calculated using the Meta-Disc program.
Results
1. Study selection and characteristics
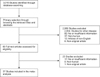
In total, 3,010 reports were identified in the database search for this systematic review and meta-analysis. Among them, 77 were excluded owing to insufficiency or lack of information on the correlation between c-MET overexpression as determined by IHC and the clinicopathological parameters, and the amplification of c-MET. In addition, 2,876 reports were excluded because they were concerning other diseases, or they used animals or cell lines, and 20 were excluded because they were articles written in a language other than English or they were non-original articles. Finally, 37 studies were included in this systematic review and meta-analysis (Table 1, Fig. 1). The total number of patients from the 37 studies was 8,395. Table 1 shows the different clones of c-MET antibody and the evaluation criteria used in each study. The rate of c-MET overexpression as determined by IHC was 1.8% to 82.5% and the overall c-MET overexpression rate as determined by IHC was 31.5% (2,641 out of 8,395 patients) in the present study.
2. Clinicopathological significance of c-MET overexpression as determined by immunohistochemistry
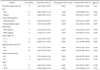
The estimated c-MET overexpression rate as determined by IHC was 0.403 (95% CI, 0.327~0.484) (Table 2). The c-MET overexpression rates in male and female patients were 0.706 (9%5 CI, 0.668~0.741) and 0.491 (95% CI, 0.357~0.627), respectively. A significant correlation was identified between c-MET overexpression as determined by IHC and poor tumor differentiation. The c-MET overexpression rate was significantly higher in the HER2 positive GCs than in HER2 negative GCs (0.349; 95% CI, 0.183~0.563 vs. 0.148; 95% CI, 0.074~0.275). There was a significant correlation between c-MET overexpression and N stage and TNM stage; however, the T and M stages showed no correlation. In the assessment of publication bias, the Egger test and Begg funnel plots showed a significant publication bias for male patients and TNM III~IV stages (P=0.004 and P=0.021, respectively). To confirm the degree of publication bias for male patients and TNM III~IV stages, trim-fill and fail-safe N tests were conducted. In both groups, the publication biases were not large and the remaining groups did not show significant publication biases.
Next, we investigated the correlation between c-MET overexpression as determined by IHC and OS rate. The estimated HR was 1.588 (95% CI, 1.266~1.992) and the c-MET overexpression was significantly correlated with worse OS rate (Table 3). Because there was a significant heterogeneity (P<0.001), subgroup analysis would be needed to identify the cause of the heterogeneity. First, subgroup analysis was performed based on the year of publication divided by published year after 2012 and before 2011. The HRs calculated for studies after 2012 and before 2011 were 1.397 (95% CI, 1.067~1.829) and 2.111 (95% CI, 1.632~2.730), respectively. In addition, the subgroup analysis performed based on the study location showed that the HRs for the Asian and non-Asian subgroups were 1.488 (95% CI, 1.165~1.900) and 1.866 (95% CI, 1.196~2.912), respectively. The HRs for subgroups formed based on low (<25%) and high (≥25%) evaluation criteria for c-MET expression as determined by IHC were 1.566 (95% CI, 1.073~2.284) and 1.416 (95% CI, 1.117~1.794), respectively. In addition, there were no significant publication biases in the primary (Begg funnel plot and Egger test) and secondary (fail-safe N and trim-fill) tests
3. Diagnostic accuracy of c-MET immunohistochemistry
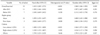
In order to evaluate the diagnostic role of the c-MET in predicting c-MET amplification, a concordance analysis was performed. The overall concordance rates between c-MET expression level as determined by IHC and c-MET amplification was 0.739 (95% CI, 0.531~0.876; Table 4). In addition, the concordance rates of the non-overexpressed and overexpressed c-MET cases were 0.967 (95% CI, 0.916~0.987) and 0.270 (95% CI, 0.173~0.395), respectively. Subgroup analysis was performed based on the evaluation criteria for c-MET expression. The c-MET evaluation criteria were subdivided into low staining(<25%), high (≥25%) staining, and other. In cases showing c-MET non-overexpression, there were no significant differences between the subgroups of the evaluation criteria (low evaluation criteria: 0.949; 95% CI, 0.850~0.984 vs. high evaluation criteria: 0.984; 95% CI, 0.892~0.998 vs. other: 0.990, 95% CI, 0.684~1.000). However, in cases showing c-MET overexpression, the concordance rate of the high evaluation criteria subgroup (0.082; 95% CI, 0.016~0.334) was significantly lower than that of the other subgroups. There was no significant publication bias in the primary and secondary tests.
Next, a diagnostic accuracy test review was performed. In all cases, the pooled sensitivity and specificity were 0.56 (95% CI, 0.50~0.63) and 0.79 (95% CI, 0.77~0.81), respectively (Table 5). The sensitivity and specificity of the eligible studies were 0.25 to 1.00 and 0.53 to 0.91, respectively. The diagnostic OR and AUC on the SROC curve for all cases were 14.52 (95% CI, 3.43~61.38) and 0.878, respectively. According to the evaluation criteria, the subgroups were subdivided into low and high evaluation criteria and the remaining subgroups. In the subgroup showing low evaluation criteria, the pooled sensitivity and specificity were 0.53 (95% CI, 0.46~0.60) and 0.76 (95% CI, 0.73~0.78), respectively. The diagnostic OR and AUC on the SROC curve of the low evaluation criteria subgroup were 11.99 (95% CI, 2.04~70.47) and 0.892, respectively. In the others subgroup, all parameters of the diagnostic accuracy test review were higher than those of the low evaluation criteria subgroup. The pooled sensitivity and specificity, the diagnostic OR and AUC on the SROC curve of the other subgroup were 0.79 (95% CI, 0.60~0.92), 0.85 (95% CI, 0.82~0.87), 22.08 (95% CI, 1.40~347.21), and 0.899, respectively.
Discussion
Many preclinical and clinical studies have reported the effectiveness of various c-MET inhibitors in the treatment of GC. Although the effectiveness of c-MET was shown in preclinical studies, its effectiveness in clinical trials is controversial. Before the evaluation of the effectiveness of c-MET inhibitors, the confirmation of evaluation criteria for c-MET expression as determined by IHC expression and gene amplification were required. This study is the first meta-analysis to assess the clinicopathological significance and diagnostic accuracy of c-MET expression in patients with GC. The present study reported 4 major findings. First, the estimated overexpression rate of c-MET was 40.3% in patients with GC. Second, a higher overexpression rate of c-MET was significantly correlated with HER2 positivity, higher TNM stage, and worse OS rate. Third, the expression level of c-MET was in concordance with the c-MET gene amplification in c-MET non-overexpressed cases, but not in the c-MET overexpressed cases. Fourth, there was no difference between the diagnostic accuracy of IHC and molecular testing.
The assessment of the eligible studies showed that the rate of c-MET overexpression was 1.8% to 82.5%. The overall rate of overexpression for c-MET was 31.5% and the estimated overexpression rate was 40.3%. In the present meta-analysis, c-MET overexpression was significantly correlated with the male sex, poor differentiation, regional lymph node metastasis, and higher TNM stage. Nevertheless, there was a positive correlation between the overexpression of c-MET, and tumor depth and distant metastasis without statistical significance. However, previous studies have reported various correlations between the c-MET status and clinicopathological parameters; these studies used various processing protocols, antibody clones, and different evaluation criteria for c-MET.13141516171819202122232425262728293031323334353637383940414243444546474849 These discrepancies could influence the clinicopathological significance of c-MET expression as determined by IHC. To obtain the confirmatory information for c-MET, systematic review and meta-analysis for pathological validation was required.
In the eligible studies, the rates of c-MET overexpression and c-MET amplification were 31.5% (2,641 out of 8,395 patients) and 11.5% (232 out of 2,019 patients), respectively. There was a significant discrepancy between c-MET overexpression and c-MET amplification. There could be a variety of reasons that could explain this discrepancy. As described above, various antibody clones and evaluation criteria were used for the evaluation of c-MET expression. Indeed, the included patient population could have affected this discrepancy. In addition, the false positive c-MET expression could be one of the important causes of discrepancy. Therefore, concordance analysis and the review of the diagnostic test accuracy are required to confirm this discrepancy. In the present study, the overall concordance rate between c-MET overexpression and c-MET amplification was 0.739 (95% CI, 0.531~0.876). However, the concordance rate of non-expressed c-MET cases was significantly higher than that of overexpressed cases (0.967; 95% CI, 0.916~0.987), nearing 1. The discordance of positive rates between c-MET overexpression and c-MET amplification might be caused by false positive cases. According to our results, c-MET could be useful for the screening of c-MET amplification, similar to HER2 for stomach cancer.12 However, further studies should be conducted to determine the accurate evaluation criteria to reduce the false positive rate.
Interestingly, in the non-overexpressed c-MET cases, the concordance rate of eligible studies with low staining was lower than that of eligible studies with high staining. In our unpublished data for non-small cell lung cancer, the concordance rate between c-MET expression and c-MET amplification was lower in the low expression group than in the high criteria group. In the present diagnostic test accuracy review, the estimates of the studies with low criteria for diagnostic accuracy were lower than that of studies with other criteria, as shown Table 5. In addition, in clinical trials with patients classified according to their c-MET expression status, rilotumumab showed a therapeutic effect for GC.54 In that study, c-MET overexpression was evaluated at >25% of membrane staining and any intensity. Because the differences of evaluation criteria might have had an impact on the selected patients and the results for therapeutic effect, more detailed and accurate criteria for c-MET expression are required.
Previously, two studies reported a correlation between c-MET and survival rate through meta-analysis. However, the HRs between studies differed, 1.66 (95% CI, 1.17~2.36) and 2.42 (95% CI, 1.66~3.54), respectively.5556 Each meta-analysis included 9 eligible studies. Among eligible studies of two meta-analysis, 8 eligible studies that were identical. However, the estimated HRs of some studies differed between two meta-analyses and the largest difference reported was 1.55. However, the definitive difference between the extracting methods for survival data could not be found. The present meta-analysis included eligible studies from two previous meta-analyses. In the present meta-analysis, c-MET overexpression was significantly correlated with a poor OS rate (HR, 1.588; 95% CI, 1.266~1.992). The eligible studies differed in their follow-up periods. In the present meta-analysis, to avoid bias from the follow-up periods, survival data were extracted after a 60-month follow-up period. Although the follow-up period did not influence the correlation between c-MET overexpression and survival, the correlation between c-MET and survival differed from those in previous reports. Interestingly, the HRs of eligible studies before 2011 were higher than those of eligible studies after 2012 year. However, the reason for the differences associated with the study year could not be elucidated. Indeed, there were no differences between the c-MET overexpression, study location, and evaluation criteria.
The coexpression of HER2 and c-MET was found in 12% of the GCs.27 Previous studies have reported that c-MET activation was associated with the resistance against molecular targeted inhibitory therapy for epidermal growth factor receptor.575859 Chen et al.60 has reported that GC cells can evade lapatinib-induced growth inhibition through the activation of MET and reactivation of the downstream signaling pathways. However, a synergistic effect by the dual inhibition of HER2 and MET was not found in GC cells.60 They concluded that dual inhibition is not required until the development of resistance.60 In our meta-analysis, the overexpression rate of c-MET in HER2 positive cases was significantly higher than that of the HER2 negative cases (0.349; 95% CI, 0.183~0.563 vs. 0.148; 95% CI, 0.074~0.275, respectively). This result could be useful for elucidating the correlation between c-MET and HER2 and for appropriate patient selection for HER2 or MET monoclonal antibody therapy. In addition, further cumulative studies are required to confirm the detailed mechanism.
There were some limitations to the current meta-analysis. First, as described above, eligible studies used various antibody clones and evaluation criteria for evaluating the expression status of c-MET. Additional subgroup analysis based on antibody clones could not be performed due to insufficient information. However, in sensitivity analysis, individual studies had no effects on the pooled estimates. Second, as a confirmatory test for c-MET amplification, various molecular tests, such as fluorescence ISH, silver ISH, chromogenic ISH, polymerase chain reaction, and next generation sequencing, were used. However, the diagnostic accuracy of c-MET IHC analysis according to the molecular test could not be evaluated due to insufficient information. Third, as described above, the concordance rate of low criteria group between c-MET expression and c-MET amplification was lower than that of other criteria groups. However, 2 of the eligible studies were using high and other criteria, respectively. Because the minimum number of included studies was 3 for the diagnostic test accuracy review, a subgroup analysis of the high and other criteria could not be performed. In order to evaluate the diagnostic accuracy of the low criteria for c-MET expression, we subdivided and compared the low and others subgroups.
In conclusion, this study showed that the overexpression of c-MET significantly correlated with HER2 positivity, higher TNM stage, and worse OS rate. The cases having non-overexpressed c-MET were in accordance with cases having c-MET gene amplification. The IHC analysis of c-MET expression could be useful for predicting prognosis and screening c-MET gene amplification in GCs.

 XML Download