

 PDF
PDF ePub
ePub Citation
 Print
Print


Introduction
In a previous study, we published an analysis of the 2014 cause-of-death statistics in the Republic of Korea, with a particular focus on the number of deaths, the crude death rate, the ranking of causes of death, and trends in the death rate from the major causes of death [1]. This report on health statistics is a follow-up analysis of the cause-of-death statistics from 2016. We added alcohol-related diseases and dementia to the analysis of specific diseases. In Korea, there has been a rapid diminution of the number of births. In 2016, the number of births was 406,243, whereas it was 438,420 in 2015 [2]. In contrast, the number of deaths has increased year by year. Therefore, the anticipated year of zero population increase will approach in the near future. An analysis of trends in causes of death will provide the basic data needed to estimate population data. The purpose of the report is the same as that of the previous report: “Examining the corresponding changes in the causes of death in the Korean population may provide some insights regarding how to cope with issues of public health and welfare in developing countries as well as in other Organization for Economic Cooperation and Development (OECD) countries” [1]. Specifically, the following variable items based on the cause-of-death data were analyzed: number of deaths and crude death rate; number of deaths and death rates by age and sex; life expectancy; trends in death rates by major causes of death; infant mortality; alcohol-induced mortality; and dementia-related mortality.
Methods
Statistics Korea collected data from death notifications filed at local administration offices and death medical certificates issued by physicians. When a death occurs, the family should submit the death notification form with a medical certificate of death issued by a physician to local offices. The data in this article were drawn from the death certificates issued in 2016 for Korean people who had resided in Korea [3]. To supplement the number of newborn deaths, which can be omitted from statistics, reports from crematoriums have been reflected since 1999. The mid-year population numbers used to calculate death rates originated from the resident registration population of the Republic of Korea. Causes of death were classified based on the underlying cause of death described in the death certificate, as recommended by the World Health Organization (WHO) [4]. However, it is possible that some death certificates are incorrectly written, especially for external causes of death. In order to classify the underlying cause of death more accurately, Statistics Korea collected and linked 22 kinds of administrative data, including health insurance data from the National Health Insurance Service, the cancer registry from the National Cancer Center, criminal investigation records and traffic accident investigation data from the National Police Agency, autopsy records from the National Forensic Service, and emergency records from the National Emergency Medical Center.
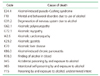
In order to compare the data internationally, the causes of death were classified according to the International Statistical Classification of Diseases and Related Health Problems, 10th revision, as recommended by the WHO, as well as the KCD-7 (Korean Standard Classification of Diseases and Causes of Death), which has been modified to fit circumstances in Korea [45]. In order to determine the ranking of causes of death, Statistics Korea used the selection list of 56 causes of death from the list of 80 causes of death for the tabulation of mortality statistics recommended by the WHO to better fit the Korean situation. A variety of cancers (malignant neoplasms) were integrated into the single item of cancer [45]. Alcohol-related causes of death were classified as shown in Table 1; however, direct causes of death related to accidents, homicides, and fetal alcohol syndrome were excluded. Death by dementia was classified as blood-vessel-origin dementia (F01), unknown-origin dementia (F03), or Alzheimer disease (G30).
Results
1. Number of deaths and crude death rate
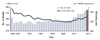
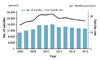
The total number of deaths was 280,827 in 2016, which was an increase of 4,932 (1.8%) from 2015. The number of deaths among males was 152,529, which was 2,080 (1.4%) more than in 2015. The number of deaths among females was 128,298, which was 2,852 (2.3%) more than in 2015 (Figure 1). The daily number of deaths was 767, which was 11 persons more than in 2015. The crude death rate (number of deaths per 100,000 population) was 549.4, which was an increase of 7.9 (1.5%) compared to the crude death rate in 2015. The crude death rate among men was 597.5, which was an increase of 6.5 (1.1%) from 2015. The crude death rate among women was 501.5, which was an increase of 9.4 (1.0%) from 2015. The crude death rate among men was 1.19 times higher than that among women, and this number was similar to the proportion from 2015 (Suppl. 1). The annual number of deaths in 2016 was the highest to be recorded since the introduction of cause-of-death statistics in 1983. The crude death rate was also the highest since 1992 (539.8).
2. Number of deaths and death rates by age and sex
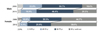
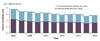
In 2016, 42.5% of deaths were among those 80 years old and over, which was 1.7%p more than in 2015 and 11.8%p more than in 2006 (Figure 2, Suppl. 2). In males, 29.5% of deaths were in those 80 years old and over in 2016, which was 10.2%p more than in 2006. In females, 58.0% of deaths were in those 80 years old and over in 2016, which was 13.3%p more than in 2006. The death rate by age (per 100,000 population) was the lowest in those who were 1 to 9 years old (11.6) and the highest in those 80 years old and over (8,393.2). The death rate by age (per 100,000 population) decreased in all age groups except age 0 and the 10 to 19 years age group. The death rate of males decreased by 6.4% in the 20 to 29 years age group and by 4.9% in the 40 to 49 years age group compared to 2015. The death rate of females decreased by 4.7% in the 70 to 79 years age group and by 4.3% in the 20 to 29 years age group compared to 2015. The sex ratio of the death rate (male/female) was greater than 1 in all age groups. The 50 to 59 years age group showed the highest ratio (2.7).
3. Life expectancy
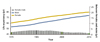
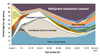
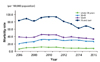
The life expectancy of newborns in 2016 was 82.4 years, which was 0.3 years longer than in 2015 and 3.6 years longer than in 2006 (Figure 3, Suppl. 3). The life expectancy of male newborns in 2016 was 79.3 years, and that of females was 85.4 years. The gap in the life expectancy between male and female newborns in 2016 was 6.1 years. The life expectancy of all age groups and both sexes increased since 2015. The life expectancy of 40-year-old men in 2016 was 40.4 years and that of 40-year-old women was 46.2 years. The life expectancy of 60-year-old men in 2016 was 22.5 years and that of 60-year-old women was 27.2 years.
4. Trends in death rates by major causes of death
1) Leading causes of death
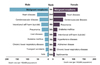
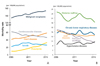
The ten leading causes of death, in order from high to low, were malignant neoplasms (cancer), heart diseases, cerebrovascular diseases, pneumonia, intentional self-harm, diabetes mellitus, chronic lower respiratory diseases; liver diseases, hypertensive diseases, and transport accidents (Figures 4,5,6, Suppls. 4,5,6). Those ten major causes of death comprised 69.5% of all deaths in 2016. The rank of hypertensive diseases increased to 9th from 10th in 2015, while that of transport accidents decreased to 10th from 9th in 2015. Pneumonia became the 4th-highest cause of death since 2015. The causes of death whose rank increased in 2016 from 2006 were heart diseases, pneumonia, and chronic lower respiratory diseases; while those that decreased were cerebrovascular diseases, diabetes mellitus, transport accidents, and liver diseases.
The ten leading causes of death in males, in order from high to low, were malignant neoplasms (cancer), heart diseases, cerebrovascular diseases, intentional self-harm, pneumonia, liver diseases, diabetes mellitus, chronic lower respiratory diseases, transport accidents, and accidental falls. The ten major causes of death in females, in order from high to low, were malignant neoplasms (cancer), heart diseases, cerebrovascular diseases, pneumonia, diabetes mellitus, intentional self-harm, hypertensive diseases, Alzheimer disease, chronic lower respiratory diseases, and sepsis. The number of deaths in males caused by malignant neoplasms was 1.6 times higher than that in females in 2016. In males, the rank of liver diseases increased to 6th in 2016 from 7th in 2015, while in female, the rank of hypertensive diseases increased to 7th in 2016 from 8th in 2015.
The top cause of death in the age groups of 10 to 19, 20 to 29, and 30 to 39 years was intentional self-harm. In the age groups of 40 to 49 years and over, the top cause of death was malignant neoplasms. Intentional self-harm was the second most common cause of death in the age groups of 40 to 49 and 50 to 59 years.
2) Mortality due to malignant neoplasms
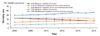
The death rate (per 100,000 population) due to malignant neoplasms was 153.0 in 2016, which was an increase of 2.1 (1.4%) from 2015 (Figure 7, Suppl. 7). The top 5 malignant neoplasms in terms of causing mortality were lung cancer (35.1 deaths out of 100,000 population), liver cancer (21.5), colon cancer (16.5), stomach cancer (16.2), and pancreatic cancer (11.0). The number of deaths from colon cancer exceeded the number of deaths from stomach cancer in 2016. This is the first time that this has happened since 1983, when death statistics started to be classified. There were decreases in the death rates from liver cancer (−3.0%), stomach cancer (−3.4%), and cervical cancer (−5.7%), while there were increases in the death rates from lung cancer (2.9%), pancreatic cancer (2.9%), and leukemia (6.8%). The death rate due to malignant neoplasms among males was 188.8, while it was 117.2 among females. The rate of males was 1.6 times greater than that of females. The top causes of death from malignant neoplasms among males were lung cancer (52.2), liver cancer (31.5), and stomach cancer (20.8), and those among females were lung cancer (18.1), colon cancer (14.6), and liver cancer (11.6). The male-to-female ratio of malignant neoplasms was 9.5 for esophageal cancer, 2.9 for lung cancer, and 1.7 for liver cancer. The death rate from malignant neoplasms among males in 2016 increased by 1.6 (0.8%) compared to 2015, while there was an increase of 2.8 (2.4%) among females. Of malignant neoplasms, the top cause of death was stomach cancer in the 30 to 39 years age group, liver cancer in the 40 to 59 years age group, and lung cancer in those 60 years of age and older. The death rate from malignant neoplasms decreased between 2015 and 2016 in all age groups except 0 to 19 years and 80 years and over.
3) Diseases of the circulatory system
The death rate (per 100,000 population) caused by diseases of the circulatory system was 118.1 in 2016, which mainly consisted of 58.2 by heart diseases, followed by 45.8 by cerebrovascular diseases and 10.6 by hypertensive diseases (Figure 8, Suppl. 8). The death rate from cerebrovascular diseases declined by 4.6% from the previous year; while the death rate from hypertensive diseases and heart diseases increased by 6.9% and 4.6%, respectively, over the previous year. Deaths caused by diseases of the circulatory system increased with age, and were especially common in individuals over 70 years of age. The category of “other” heart diseases were the most common cause of death in this category in those under the age of 40, while ischemic heart diseases were the most common cause of death in the age groups from 40 to 79 years.
4) Mortality caused by intentional self-harm
The number of deaths caused by intentional self-harm was 13,092, which was a decrease of 421 from 2015 (−3.1%) (Figures 9,10, Suppls. 9,10). The average number of daily deaths by intentional self-harm was 35.8. The death rate (per 100,000 population) by intentional self-harm was 25.6, which was a decline of 0.9 (−3.4%).
6. Alcohol-induced mortality
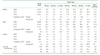
The alcohol-induced mortality rate was found to be 9.3 out of 100,000 population, which was the same as in 2015 (Table 2). The alcohol-induced mortality rate among men was 16.1, which was a decrease of 0.1 (0.7%) compared to 2015, while that among females was 2.4, which was an increase of 0.1 (2.9%) compared to 2015. The alcohol-induced mortality rate among men (16.1) was 6.6-fold higher than that among women (2.4). The alcohol-induced mortality rate among men increased starting in the 40–49 years age group and peaked in the 60 to 69 years age group.
7. Dementia-related mortality
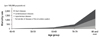
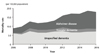
The number of dementia-related deaths was 9,164, which was a decrease of 296 (3.1%) from 2015. The dementia-related mortality rate was 17.9 out of 100,000 population, and this category consisted of Alzheimer disease (9.4), unspecified dementia (7.1), and vascular dementia (1.4) (Figure 12, Suppl. 12).
The dementia-related mortality rate of women (24.7) was 2.2-fold higher than that of men (11.2). The dementia-related mortality rate among males increased by 122.4% since 2006, and that of females increased by 97.3% since 2006.
Discussion
1. Number of deaths, crude death rate, and life expectancy
The total number of deaths was 280,827 in 2016. This number is the highest value to be recorded since 1983. The crude death rate was 549.4, which was an increase of 7.9 (1.5%) from the crude death rate in 2015. The crude death rate in 2016 was the highest since 1992 (539.8). Those two data points tell us that there will be a continuous increase not only of the number of deaths, but also of the crude death rate. The total number of births in 2016 was 406,243. The natural population increase was 125,373. This number will continuously decrease year by year. Although the Korean government has estimated that zero population growth will occur in 2029, our findings suggest that this milestone may occur earlier. Life expectancy increased in all age groups due to the decrease in the mortality rate. The gap in life expectancy between males and females increased from 1970 to 1985, and has decreased continuously since then. The infant mortality rate in Korea (2.8) was below the average value of OECD countries (3.9).
2. Pneumonia
Pneumonia became the 4th leading cause of death in 2015. Its ranking has increased continuously since 2006, when it was the 10th leading cause of death. Its continuous increase may have been due to the growth of the elderly population and their vulnerability to infectious diseases, originating from their immunocompromised status.
3. Neoplasms
Within the category of mortality from malignant neoplasms, mortality caused by colon cancer (16.5) began to exceed that of stomach cancer (16.2) in 2016. This trend may continue based on changes in meat and cereal consumption [6], its increased incidence in the 40 to 50 years age group, and the growth of the population aged over 65. Furthermore, early screening for colon cancer was limited because the target population for screening is over 50 years old in Korea [7]. Meanwhile, early screening for stomach cancer was more active than early screening for colon cancer [8], so that early detection and treatment were more common for stomach cancer than for colon cancer, as indicated by the fact that Korea had the lowest mortality-to-incidence ratio of stomach cancer out of the 24 OECD countries [9].
4. Intentional self-harm
Intentional self-harm became the 5th most common cause of death in 2015. In 2016, it was also ranked 5th. Both the number of deaths and mortality rate decreased compared to 2015, by 421 persons (3.1%) and 0.9 (3.4%) respectively. This phenomenon originated mainly from a decrease in deaths among individuals in their 70s. The increase in the mortality rate by intentional self-harm in the 10 to 19 and 20 to 29 years age groups is a problem in Korea. The Korean government announced the National Action Plan for Prevention of Intentional Self-Harm in January 2018 [10]. Its goal is to reduce the mortality rate caused by intentional self-harm to 17 per 100,000 population by 2022. The current rate is 25.6 (in 2016). Korea is known to be the OECD country with the highest mortality rate from intentional self-harm. The specific strategy was outlined as follows: first, a strategic approach based on scientific evidence shall be constructed including surveys of all cases and a monitoring system of intentional self-harm. Second, to detect those at high risk of intentional self-harm, a social network shall be constructed. Third, risk will be reduced by intensive interventions, including a support system for the high-risk group. Fourth, an enforcement of post-care system shall be constructed to prevent the spread of intentional self-harm. The above strategies are expected to reduce the mortality rate by intentional self-harm.
5. Hypertension and transport accidents
The movement of hypertension from the 10th most common cause of death in 2015 to the 9th in 2016, and the corresponding shift of transport accidents from the 9th most common cause of death in 2015 to the 10th in 2016 was the most remarkable change that occurred between these 2 years. Mortality due to transport accidents will continue to decrease in the future, due to the establishment and enforcement of a law mandating the use of safety belts, improvements in the road system, and improvements in critical care for injured passengers.
6. Infant mortality
The number of infant deaths decreased by 36 infants (3.0%) from 2015; however, this originates from the decrease in the number of newborns by 7.3% since 2015. The infant death rate (per 1,000 newborns) was 2.8, which increased by 0.1 (4.7%) from the previous year.
7. Alcohol-induced mortality
The alcohol-induced mortality rate was 9.3, which was the same as in 2015 (9.3). The rate among males (16.1) was 6.6 times higher than that among females (2.4). This gender discrepancy decreased somewhat in 2016 from 2015 (6.8) and 2006 (10.8). The mortality rate began to increase in the 30 to 39 years age group, peaked in the 50 to 59 years age group, persisted in the 60 to 69 years age group, and slowly decreased among individuals in their 70s and 80s. Alcohol-induced mortality may persist due to the social culture of Korea, in which excessive alcohol drinking is accepted. Broadcasting has also contributed to excessive alcohol consumption in Korea by disseminating frequent scenes of alcohol drinking and advertisements of alcohol beverages. The average annual alcohol intake in Korea was 12.3 L according to a 2014 WHO report, making Korea the country with the 15th highest average intake worldwide [11]. If social norms regarding alcohol drinking do not change soon, alcohol-induced mortality will continue to remain a problem.
8. Dementia-related mortality
Dementia-related mortality has increased continuously since 2006. The mortality rate in 2016 was 17.9, whereas it was 9.2 in 2006. The male-to-female ratio of dementia-related mortality was 0.5 (11.2/24.7). Alzheimer disease was the 8th leading cause of death among females in 2016, while it was 7th in 2015. Dementia-related mortality will continue to increase due to increases in life expectancy.
This report was solely based on the information contained in the “Annual report on the causes of death statistics” [3]. Interpretations of data based on the age-sex standardized death rate of each cause of death can be different from interpretations of the crude death rate [12]. The further analysis of age-standardized data will help identify additional trends.
Conclusion
The most notable change in the cause-of-death statistics in 2016 was the movement of hypertension from the 10th most common cause of death in 2015 to the 9th in 2016, and the movement of transport accidents from the 9th most common cause of death in 2015 to the 10th in 2016. Furthermore, mortality caused by colon cancer (16.5) surpassed that caused by stomach cancer (16.2) for the first time, which was remarkable. Additional focus should be directed to alcohol-related diseases and dementia as causes of death, because the former category has not changed dramatically and the latter may increase year by year. The above trends in causes of death reflect aspects of the population structure, disease patterns, lifestyle, and medical care in present-day Korean society.
 XML Download