

 PDF
PDF ePub
ePub Citation
 Print
Print


Introduction
Sex determination is one of the important tool for identification of human skeletal remains discovered in forensic scenarios [1]. Determination of sex has paved the way for further development of techniques such as age and stature determination. It is widely known that the two most sexually dimorphic skeletal remains are the pelvis and the skull [2]. Sex determination is considered as one of the baseline data for identification for use as in facial reconstruction, as it decreased the number of possible matches by one-half [3]. There were several studies performed on sexual dimorphism from different skeletal parts, which used various osteometric and morphological approaches.
The pelvis is the best skeletal indicator for any sex determination, while the skull is the second best indicator due to its better preservation [4]. The dimorphic features of skull has a better stability and durability than other bony remnants. The methods used for sex determination are classified into molecular and morphologicalmethods [5]. An adult skull is preferred to a sub-adult skull in sex determination due to hormonal control on its growth and bone development in adult skull. The gender difference in skull occurs due to its variability in bone development and its forces. Thus, bone development in females is earlier than in males, and there is a drastic modification in the appearance of female skull at the time of puberty. Thus, the morphological difference among genders manifests more readily in the adult skeletons [56].
One of the main advantages of anthropometric methods is that more objective results can be obtained than that with morphological method. Therefore, many studies on anthropometric methods were still being reported, and their results were currently being widely used in actual cases [7]. Although anthropometric methodis helpful for sex determination and they may have some limitations when applied to actual cases [1]. Generally, male tends to have a larger, more robust and rugged features than females, while female has a smaller, rounder and more gracile skull [8]. The present study was performed to develop an anthropometric method for sex determination in adult Malaysian population based on 22 parameters of cranial measurements, and the results were analysed by logistic regression, discrimination function, and discriptive analyses. It is hoped that the results can be used as a tool of identification in human by the forensic anthropologists and scientists.
Materials and Methods
This study was a retrospective study of cases collected from postmortem computed tomography (CT) scan images taken at the Department of Forensic Medicine, Hospital Kuala Lumpur for 4 years duration between 2012 till 2016. In this study, a total of 22 parameters were selected out of the most commonly used parameters in anthropometric studies. The study sample comprised 87 cases with 45 males and 42 females with age ranges between 18 and 75 years old. Cases with fracture or surgery in the craniofacial region were excluded from the study, in which four cases were excluded. The crania were measured using Osirix software 3-D Volume Rendering. Ethics of the study was approved by the Medical Ethics Committee, Faculty of Medicine, Universiti Kebangsaan Malaysia (UKM) with code number UKM PPI/111/8/JEP-2016-344.
– Maximum cranial length (gop): the distance between glabella (g) and opithocranion (op) in the midsagittal plane measured in straight line.
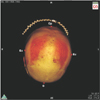
– Maximum cranial breadth (eu-eu): maximum width of skull perpendicular to midsagittal plane, wherever it was located with the exception of inferior temporal lines and area immediately surrounding them from right euryon to left euryon (eu-eu) (Fig. 1).
– Cranial base length (nba): the distance from nasion (n) to basion (ba).
– Basion-bregma height (bab): the distance of the lowest point on the anterior margin of foramen magnum (ba) to bregma (b).
– Bizygomatic breadth (zyzy): the width or breadth of the face from the widest part of one zygomatic arch to the widest part of the other.
– Maximum frontal breadth (coco): the distance between two coronalia (co).
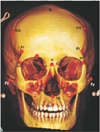
– Minimum frontal breadth (ftft): the distance between two frontotempolare (ft) (Fig. 2).
– Basion prosthion (bapr): the distance from basion (ba) to prosthion (pr).
– Upper facial height (npr): the distance from nasion (n) to prosthion (pr).
– Nasal height (nns): the distance from nasion (n) to the mid-point of a line connecting the lowest points of the inferior margin of the nasal notches (ns).
– Nasal breadth (alal): the maximum breadth of the nasal aperture (al-al).
– Orbital height of the right eye: the maximum height from the upper to lower orbital borders (or) perpendicular to the d-ec line on the right side.
– Orbital height of the left eye.
– Orbital breadth of the right eye (dec): the laterally sloping distance from dacryon (d) to ectoconchion (ec) of the right orbit.
– Orbital breadth of the left eye.
– Biorbital breadth (ecec): the distance between right and left ectoconchion (ec).
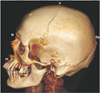
– Auriculo-bregmatic height of the right side (pobr): the distance from porion (po) to bregma (b) on the right side (Fig. 3).
– Auriculo-bregmatic height of the left side (pobl).
– Naso-occipital length (nop): the distance between nasion (n) to opithocranion (op).
– Mastoidal bregma height of the right side (msbRt): the distance between mastoidale (ms) to bregma (b) on the right side.
– Mastoidal bregma height of the left side (msbLt).
– Nasion bregma height (nb): the distance between nasion (n) and bregma (b).
Statistical analysis
The data was analysed using SPSS version 23 [11]. The independent t test was used to compare the difference in measurements between males and females. The discriminant function was used to generate equations for classification of male and female that was validated by cross validation analysis, and regression analysis was used to perform classification accuracy.
Results
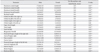
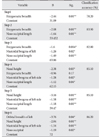
Results showed a significant difference between males and females, as males gave higher values of all the parameters than in females, except for the left orbital height by using independent t test (P<0.05). Sexual dimorphism ratio was greater than 1, which indicated that male cranium was larger than female (Table 1). The highest ratio was found in the nasal height (NHt), followed by the upper facial height (npr).
The significance of the Box's M test was done to detect equality of covariance matrices. The equality of covariance matrices was 0.518, and thus, the test had rejected the hypothesis of equal population covariance matrices as the significance level was more than 0.05. The canonical discriminant function showed a high canonical correlation of 0.73. The unstandardized and standardized canonical coefficients were listed (Table 2).
By stepwise statistics, four parameters were used in the analysis i.e., BZBr, NHt, NOLt, and MBrHtLt (Table 2), and these parameters were highly significant by t test. Standardized canonical discriminant function coefficients showed that MBrHtLt was the best discriminant predictor followed by NHt, NOLt, and BZBr in that order (Table 2).
The discriminant function score was given as follows (Table 2): , whereby, a1 to an is unstandardized raw factor (the discriminant coefficient), x1 to xn is discriminating variables, and b is constant. , where, BZBr is bizygomatic breadth, NHt is nasal height, NOP is nasooccipital length, and MsBlt is mastoidal bregma height of the left side.
The sectioning point is the mean of male and female centroids of the same function. To assign the case to either male or female, the product discriminant score (DS) was compared to the sectioning point derived by the discriminant function. A value higher than the sectioning point was deemed to be male, and a value below it, deemed to be female [12, 13].
A DS was formulated for males as follows:
A DS was formulated for females as follows:
Sectioning point: (1.019–1.092)/2=–0.036.
The DS for males was found to be greater than the sectioning point, while the DS for females was less than the sectioning point. In the original sample, the sensitivity was 86.7% and the specificity was 83.3%.
By cross-validation, 85.1% of original grouped cases were correctly classified (Table 3). Cross-validation was done only for those cases in the analysis. In cross validation, each case was classified by the functions derived from all cases other than that case. About 85.1% of cross-validated grouped cases were correctly classified. When these 22 measurements were assessed by forward logistic regression analysis, five parameters were included namely, bizygomatic breadth, naso-occipital length, left mastoidal bregma length, left orbital breadth and nasal height (Table 4).
Discussion
The results indicated that there was a significant difference between males and females, where males gave higher values in all the parameters than females, except for left orbital height by independent t test (P<0.05). Sex dimorphism ratio was conducted by comparing mean values between male to female (Table 1), and it showed greater values in male than female. Nasal height was the strongest discriminating morphometric parameter with the ratio of male to female is 1.09 (P<0.01). The results comparable with the literature exhibiting similar results in other population from different geographical regions by utilizing traditional osteometric methods, cephalometrics and geometric morphometrics [141516]. In this study, the highest ratio was found in nasal height (NHt) followed by upper facial height (npr). It differed with the study which showed that bizygomatic breadth and cranial length were the most useful dimorphic parameters for Gujrati population [14].
The canonical variate analysis showed that the right mastoidale-bregma height (0.84) was the strongest discriminating morphometric parameter, followed by nasal height (0.45), naso-occipital length (0.37) and bizygomatic breadth (0.29) in that order. It differed with another study which showed that bizygomatic breadth was the strongest discriminating variable, followed by maximum cranial length and basi-bregmatic height [14].
By stepwise discrimination analysis, the classification accuracy was 85.1%, and this was supported by a study, which showed a classification accuracy of 80.8% by using four facial parameters i.e., cranial length, basion-bregma, bizygomatic breadth and nasal height [17]. Additionally, Hanihara [18] had worked on Japanese crania, and found about 89.7% classification accuracy of sexual dimorphism. In another study, a classification accuracy of 85.5% was achieved by using cranial height, maximum bizygomatic diameter and mastoid length in a study sample comprised 408 American Black and White crania of known sex [19].
A study was done in 176 adult Greek crania, in which the classification accuracy was 82% and 79% for size and shape, respectively, and on cross validation, the classification accuracy was 77.2% [20]. The classification accuracy can be improved when both size and shape were used in combination (90.4% for cranial base), as shown in a study on 106 South African White crania and 90 South African Black crania, in which 13 standard cranial parameters were measured, and the results showed that the classification had yielded from 86.7% up to 97.8% for males, and yielded from 81.1% to 95.8% for females [21]. In another study, a correct sexing in White South Africans was obtained with an accuracy rate of 85.7% for crania and 80.2% for bizygomatic breadth alone [22]. A study on Japanese population had reported accuracy rates of functions, which ranged from 80 to 90% for crania based on 10 parameters [23].
In this study, the logistic regression analysis produced regression based on five parameters namely, bizygomatic breadth, naso-occipital length, left mastoidal bregma height, left orbital breadth and nasal height. The bizygomatic breadth was chosen as the most discriminatory single variable with an accuracy rate of 78.2%. This finding was comparable with the literature, in which bizygomatic breadth and basion-prosthion length were found to have classification accuracy of 87.5% for females and 87.0% for males [10], and that bizygomatic breadth showed an accuracy rate of 82% as the most discriminatory single parameter.
Large number of parameters is not mandatory to obtain maximum sex classification accuracy, and this is evidenced by the fact that Franklin combination of five parameters performed better sex classification accuracy than functions employing six, seven or even eight parameters [14]. The significance of the present study was to confirm that parameters of Malaysian crania can be used for identification of skeletal remains by using discriminant function for classification.
The discriminant function score can be used, and compared to sectioning point for classification. By logistic regression analysis, bizygomatic breadth was the most discriminatory single parameter with an accuracy rate of 78.2%. The results were supported by previous studies exhibiting similar results in other populations from different geographical regions.
The limitation of this study was that measurement was done by using CT images so that there incurred some technical difference between measurements on CT images compared to that on real skull. It is recommended that in future, one should compare between measurements on real skull and on CT images, and validate the equations for sex identification, and compare the results using both methods.
In conclusion, the cranium can be used to distinguish between sexes in the Malaysian population. The database collected can be used in forensic investigation for identification of damaged or unknown crania. It is hoped that it can contribute to the population-specific standards for the Malaysian population.


 XML Download