

 PDF
PDF ePub
ePub Citation
 Print
Print


INTRODUCTION
Primary implant stability is one of the most important factors in the evaluation of successful dental implantation [12]. Primary stability at implantation corresponds to a mechanical phenomenon that is relevant to local bone quality and quantity, the type of implant, and the placement technique used [3]. Bone quality is one of the essential factors in predicting the success rate of implant installation [45]. The mechanical competence of bone, which is referred to as bone quality in implant dentistry, comprises bone mass, structural properties, and material properties [67]. Consequently, greater failure of implants is likely associated with poor bone mineralization or limited bone resistance on tactile assessment while drilling [89].
Quantitative methods for determining implant stability can yield valuable information regarding the success of dental implants [3]. Several methods appropriate for repeated measurements have been developed for the long-term monitoring of implant stability [101112]. The Osstell Mentor (Integration Diagnostics AB, Goteborgsvagen, Sweden) based on resonance frequency analysis (RFA) measures the stability as an implant stability quotient (ISQ). Generally, local bone density at dental implant recipient sites is measured using computed tomography (CT). The bone density according to CT had significant correlations with insertion torque values and ISQ values, and there was a significant correlation between insertion torque and ISQ values [13]. Bone density obtained using a cone-beam CT (CBCT) showed high correlation with the primary implant stability as assessed by insertion torque and ISQ [14]. The CT numbers according to CBCT and the thickness of cortical bone had strong correlation with ISQ [515]. Thus, trabecular bone density and cortical bone thickness are of considerable importance for primary implant stability.
Dental implants are mainly in contact with trabecular bone rather than cortical bone, which directly concerns implant stability [4]. That is, the structure of trabecular bone appears to play a minimal role in primary fixation of an implant, but it is of substantial importance for peri-implant bone healing [15]. Although primary implant stability has been extensively investigated with regard to trabecular bone density and cortical bone thickness, few studies have examined the relationship between implant stability and trabecular bone microstructure. Implant stability according to ISQ showed moderately positive correlation with the stiffness (elastic modulus) of cancellous bone and with the 3D bone-to-implant contact ratio determined by micro-CT [16]. Histomorphometry according to micro-CT showed differences in microstructures of the bone specimens, but none of the trabecular microstructural parameters were significantly correlated with ISQ values. To date, the relationships of implant stability with trabecular bone structural parameters have not been fully explained.
The micro-CT analysis technique has been the prevalent method of measuring 3D trabecular bone microstructures of small samples because of its increased analysis speed compared with conventional histology, its non-invasiveness, and its high spatial resolution [17181920]. However, the application of micro-CT technology to bone analysis is limited to small specimens. Recently, the high correlations between dental CBCT and micro-CT regarding bone structural parameters indicated the possibility of quantifying and monitoring changes of trabecular bone microarchitecture using CBCT clinically [2122]. However, there have been no studies done on the relationship between primary implant stability and trabecular bone structural parameters using CBCT.
Previously, we developed a new method for evaluating dental implant stability quantitatively using an inductive sensor [23]. The implant stability measured by the impact response frequency showed better differentiability and consistency than did the ISQ value using artificial bone [24]. The objective of this study was to investigate the relationships between primary implant stability measured by impact response frequency and the structural parameters of trabecular bone using CBCT, excluding the effect of cortical bone thickness.
MATERIALS AND METHODS
We placed 23 dental implants (11.5 mm length and 4.5 mm diameter) (SSII SA Fixture, Osstem Implant, Seoul, Korea) into swine rib bone specimens composed of only trabecular bone without the cortical bone layer. Swine bone samples have been widely used in dental implant experiments. As recommended by the manufacturer, a twist drill with a 2 mm diameter was used to make the initial implant hole, followed by twist drills of 3.0, 3.6, and 4.1 mm in ascending order. After hole preparation, all implants were placed in the hole by a mount driver with the same thread position established in contact with the bone surface. The bone sample with implant was trimmed to a cube of uniform size, 20×20×20 mm3, for micro-CT scanning and stability measurement.
For implant stability measurement, the bone sample was tightly fixed to the specially designed mounting plate using bolts (Figure 1). The system was composed of an analog inductive sensor (Sungjin Corporation, Busan, Korea), an adaptor for amplifying the implant movement, and a signal processing unit [2324]. A dedicated cube-shaped aluminum adaptor (13×13×13 mm) was manufactured to amplify the small signal of implant movement. The adaptor, tightly screwed into the implant, was tapped using the tapping rod of the Periotest (Siemens, Bensheim, Germany) as a source of constant excitation force. The inductive sensor detected movement of the adaptor-implant body without physical contact (Figure 2). The interaction between the two magnetic fields of the sensor and adaptor generated an output signal corresponding to the changing distance between the implant and the sensor. The signal from the sensor was digitized at a 1 kHz sampling rate and was high-pass filtered to remove noise. We obtained consecutive impact responses by multiple tappings and calculated the power spectrum of each response by fast Fourier transform (FFT) (Figure 2). The peak frequency of the spectrum was determined as the implant stability (SPF).
Figure 1
Measurement of implant stability in bone samples using an inductive sensor. The implant (A) with an adaptor (B) was placed into the swine bone sample (C) and was tapped using the tapping rod of the Periotest (D). An inductive sensor (E) measured the movement of the implant-adapter assembly.
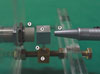
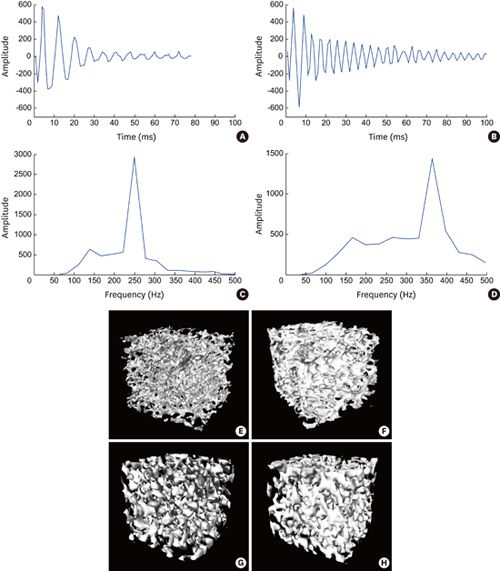
Figure 2
Examples of impulse response signals (A, B) and their power spectra (C, D) in two different bone samples, and CT images using micro-CT (E, F) and using CBCT (G, H). The implant (B, D) placed at the bone sample (F, H) with higher volume density and well-connected thick trabeculae shows higher stability than that that (A, C) at the bone sample (E, G).
We set up a bench-top CBCT system using an X-ray source (SB-80-500, Source-Ray Inc., New York, NY, USA) of 0.04 mm focal spot and a direct-conversion flat panel detector (FLAATZ 330N, DRTECH, Seongnam, Korea). The CBCT images of bone samples with implants in place were obtained at 80 kVp, 0.1 mA, and 1 s with an isotropic voxel size of 129 μm. A total of 320 projection images were recorded at an incremental angle of 1.125 over 360 degrees. The volume image was reconstructed by using the filtered back projection algorithm with a ramp filter. The 3D Laplacian filter and anisotropic diffusion filter were then applied to the reconstructed images for enhancement of the edge-of-bone images. To compare the relationships of trabecular bone structures using CBCT with implant stability to those using micro-CT, micro-CT images of the bone samples were also obtained using a micro-CT scanner (Skyscan 1172, Skyscan, Kontich, Belgium) at 100 kVp, 0.1 mA, and 0.59 s with an isotropic voxel size of 12.97 μm.
The volume images of the samples were exported to CTAn software (Skyscan, Kontich, Belgium) for evaluation of trabecular bone microstructure. The regions of interest (ROI) for CBCT images were selected as an annulus of the inner diameter of 7.1 mm and outer diameter of 9.7 mm around the implant (annulus thickness=1.3 mm) for parameter calculation. The ROI for micro-CT was an annulus of the inner diameter of 4.56 mm and outer diameter of 6.32 mm (annulus thickness=0.88 mm). The following 3D microstructural parameters were calculated for each sample: percent bone volume (BV/TV), bone volume (BV), bone surface (BS), bone specific surface (BS/BV), bone surface density (BS/TV, BSD), trabecular thickness (Tb.Th), trabecular separation (Tb.Sp), trabecular number (Tb.N), trabecular bone pattern factor (Tb.Pf), structural model index (SMI), and fractal dimension (FD). The relationships between SPF and bone microstructural parameters were evaluated using linear regression analysis and Pearson’s correlation analysis by SPSS 21 (IBM Corp., Armonk, NY, USA).
RESULTS
Stability according to peak frequency (SPF) was calculated from impact responses and 3D bone microstructural parameters from micro-CT and CBCT were evaluated for each sample. Figure 2 shows examples of the impact responses, their power spectra, and 3D reconstruction images using micro-CT and CBCT. The power spectra of two bone samples present different SPF values according to the architectural characteristics of the trabecular bone (Figure 2). Table 1 shows means of SPF and microstructural parameters using micro-CT and CBCT for 23 bone samples. Table 2 shows the Pearson’s correlation coefficients between SPF values and microstructural parameters using micro-CT (Figure 3) and CBCT (Figure 4). Most of the microstructural parameters showed significant high correlation with SPF in both imaging methods. SPF had a significant positive correlation with BV/TV, BV, BS, BSD, Tb.Th, Tb.N, and FD (P<0.05 for FD by CBCT, P<0.01 for others). In contrast, SPF had a significant negative correlation with BS/BV, Tb.Sp, Tb.Pf, and SMI (P<0.05 for Tb.Sp by CBCT, P<0.01 for others) (Table 2). SPF had the strongest correlation with BV/TV, BV, and Tb.Pf in both methods. SPF showed a higher correlation with structural parameters using micro-CT than those using CBCT (Table 2).
Table 1
Implant SPF (Hz) and 3D bone microstructural parameters using micro-CT and CBCT for 23 implantation samples
CBCT, cone-beam computed tomography; SPF, stability according to peak frequency; BV/TV, percent bone volume; BV, bone volume; BS, bone surface; BSD (BS/TV), bone surface density; Tb.Th, trabecular thickness; Tb.Sp, trabecular separation; Tb.N, trabecular number; Tb.Pf, trabecular bone patternfactor; SMI, structural model index; FD, fractal dimension.
Table 2
Pearson’s correlation coefficients between SPF and bone microstructural parameters using micro-CT and CBCT

CBCT, cone-beam computed tomography; BV/TV, percent bone volume; BV, bone volume; BS, bone surface; BSD (BS/TV), bone surface density; Tb.Th, trabecular thickness; Tb.Sp, trabecular separation; Tb.N, trabecular number; Tb.Pf, trabecular bone patternfactor; SMI, structural model index; FD, fractal dimension.
a)P<0.05, others P<0.01.
Figure 3
Relationships between SPF and 3D bone microstructural parameters of BV/TV (A), BV (B), BS (C), BS/BV (D), BSD (E), Tb.Th (F), Tb.Sp (G), Tb.N (H), Tb.Pf (I), SMI (J), and FD (K) for 23 bone specimens using micro-CT (P<0.01) (SPF, stability according to peak frequency; BV/TV, percent bone volume; BV, bone volume; BS, bone surface; BSD (BS/TV), bone surface density; Tb.Th, trabecular thickness; Tb.Sp, trabecular separation; Tb.N, trabecular number; Tb.Pf, trabecular bone patternfactor; SMI, structural model index; FD, fractal dimension).
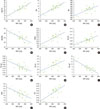
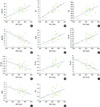
Figure 4
Relationships between SPF and 3D bone microstructural parameters of BV/TV (A), BV (B), BS (C), BS/BV (D), BSD (E), Tb.Th (F), Tb.Sp (G), Tb.N (H), Tb.Pf (I), SMI (J), and FD (K) for 23 bone specimens using CBCT (P<0.01, P<0.05 for Tb.Sp and FD) (SPF, stability according to peak frequency; BV/TV, percent bone volume; BV, bone volume; BS, bone surface; BSD (BS/TV), bone surface density; Tb.Th, trabecular thickness; Tb.Sp, trabecular separation; Tb.N, trabecular number; Tb.Pf, trabecular bone patternfactor; SMI, structural model index; FD, fractal dimension).
A linear regression analysis was also conducted to evaluate the relationships between SPF and 3D bone microstructural parameters. Table 3 summarizes the relationships between SPF and bone parameters calculated by both methods. Most parameters had a significant high R2 measure of goodness of fit (P<0.01), with BV/TV, BV, BS/BV, Tb.Pf, and SMI demonstrating the strongest relationship with SPF. The parameters using micro-CT showed higher goodness of fit than those using CBCT. The stepwise multiple linear regression analysis revealed an increase in the prediction of SPF when bone microstructural parameters were combined (Table 4). Seventy-two percent of the variability in SPF could be accounted for by the BV/TV parameter using micro-CT. Additionally, up to 80% of SPF variability could be accounted for when BV/TV and SMI were used together as predictor variables. On the other hand, up to 71% of SPF variability could be accounted for when BV/TV, BSD, and SMI were used together using CBCT.
Table 3
Linear regression analyses between SPF and bone microstructural parameters using micro-CT and CBCT (P<0.01)

CBCT, cone-beam computed tomography; SPF, stability according to peak frequency; BV/TV, percent bone volume; BV, bone volume; BS, bone surface; BSD (BS/TV), bone surface density; Tb.Th, trabecular thickness; Tb.Sp, trabecular separation; Tb.N, trabecular number; Tb.Pf, trabecular bone patternfactor; SMI, structural model index; FD, fractal dimension.
Table 4
Stepwise regression analysis with SPF as a dependent variable and bone microstructural parameters using micro-CT and CBCT as independent variables
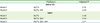
| Predictors | Adjusted R2 | |
|---|---|---|
| micro-CT | ||
| Model 1 | BV/TV | 0.72 |
| Model 2 | BV/TV, SMI | 0.80 |
| CBCT | ||
| Model 1 | BV/TV | 0.46 |
| Model 2 | BV/TV, BSD | 0.64 |
| Model 3 | BV/TV, BSD, SMI | 0.71 |
DISCUSSION
Primary implant stability is associated with the mechanical relationship between bone and implant, and secondary implant stability refers to the regeneration of bone following implantation [2526]. Primary stability is influenced by the quality and quantity of the trabecular bone, implant geometry, and the thickness of the cortical bone [32728]. It is difficult to obtain optimum primary stability from soft bone of low density, and implant failure rates are therefore higher in these cases [2930]. The noninvasive quantification of implant stability at various points in time provides important information about individualized optimal healing time [31]. The Osstell Mentor system (Integration Diagnostics AB, Goteborgsvagen, Sweden) based on resonance frequency analysis (RFA) provides stability as an implant stability quotient (ISQ). However, some studies have indicated discrepancies between RFA and other stability measurements, such as insertion torque, removal torque, bone mineral density, and histological bone-implant contact [323334]. In a previous study, we developed a new method for evaluating implant stability quantitatively [23]. The peak frequency of the impact response spectrum was determined as the implant stability criterion (SPF) [24]. The SPF showed a wider dynamic range and higher resolution than the ISQ value in determining dental implant stability in an in vitro model [23]. The SPF also revealed better differentiability and consistency with implant stability than did the ISQ value using artificial bone of various densities and thicknesses [24]. Based on these studies, we analyzed the relationships between primary implant stability measured as the SPF and 3D bone architectural parameters using micro-CT and CBCT, excluding the effect of cortical bone thickness.
Microstructural parameters including BV/TV, BV, BS, BSD, Tb.Th, Tb.N, and FD showed a strong positive correlation with SPF value using both micro-CT and CBCT. On the other hand, SPF had a strong negative correlation with the parameters of BS/BV, Tb.Sp, Tb.Pf, and SMI. The SPF increased when the microstructural parameters of BV/TV, BV, BS, BSD, Tb.Th, Tb.N, and FD increased, while the SPF decreased when BS/BV, Tb.Sp, Tb.Pf, and SMI increased. The density parameters including BV/TV, BV, BS, and BSD showed positive correlation with the SPF, while BS/BV showed negative correlation with the SPF. BV/TV and BS/BV represent the total volume density of the bone core [35]. BS/BV characterizes the complexity of structures and can be associated with SMI [35]. When BS/BV was low and trabeculae were plate-shaped (low SMI), the SPF was high; however, when BS/BV was high and trabeculae were rod-shaped (high SMI), the SPF was low. On the other hand, when BV/TV was high, the SPF was high, but when BV/TV was low, the SPF was low. We expect that denser bone with high bone volume density and low bone surface density shows high SPF, as the bone has thick trabeculae or a plate-like trabecular pattern [35].
Microstructural parameters such as Tb.Pf, Tb.Th, and Tb.N are associated with the trabecular configuration and 3D organization. Tb.Pf represents inverse trabecular interconnectivity, and a high Tb.Pf value of low trabecular interconnectivity had a low SPF. High Tb.Th of high mean thickness of trabeculae showed a high SPF, and high Tb.N of the reciprocal of the distance between trabecular centers showed a high SPF [35]. High FD providing a statistical index of complexity demonstrated a high SPF. Tb.Sp represents the spacing of bone structures, which is measured as the distance between trabeculae. High Tb.Sp values showed a low SPF, while low Tb.Sp values showed a high SPF. As a result, sparse, thin trabecular bone with large marrow spaces or poorly connected bone showed a low SPF, while well-connected, thick bone with small marrow spaces or trabeculae in close proximity showed a high SPF [35].
The influence of 3D bone microstructural parameters on primary implant stability is not fully understood to date, although one study proposed a correlation between 3D bone microstructural parameters and ISQ values of implant stability. A previous study showed a positive tendency between ISQ value and BV/TV, SMI, BS/BV, TV, BV, and BS and a negative tendency between ISQ value and Tb.Pf, Tb.Th, Tb.N, and Tb.Sp [35]. However, no significant relationships were noted between implant stability and microstructural parameters [35]. Some researchers have reported no significant correlation between bone micro-architectural parameters and ISQ value. One study found no correlation between ISQ value and the histomorphometric parameters of trabecular bone, such as BV/TV, Tb.Pf, Tb.N, and Tb.Th [15]. Similarly, the ISQ value did not significantly correlate with the histological parameters such as trabecular bone connectivity and volume density [32]. On the other hand, our results demonstrate significant correlation between implant stability and bone microstructural parameters using micro-CT and CBCT, as the SPF from the impact response showed a wider dynamic range and higher resolution than ISQ in determining dental implant stability [23].
Several studies have investigated the relationships between 3D bone micro-architecture and mechanical properties representing failure mechanisms [3637383940]. Mechanical properties such as Young’s modulus, yield stress, failure load, and insertion torque were measured through mechanical testing [3637383940]. Failure load showed significant correlation with structural parameters (Tb.N, Tb.Th, and Tb.Sp) [38], and Young’s modulus and yield stress correlated well with BV/TV, BS/BV, and SMI [3940]. Insertion torque also exhibited significant correlation with BV/TV and SMI [3637]. These studies confirmed that 3D bone micro-architectural parameters are associated with mechanical properties relative to bone strength. The combination of bone density parameters with micro-architectural parameters showed a higher correlation with mechanical properties and therefore improved the prediction of bone strength [3637]. These mechanical properties determined by bone strength have a decisive effect on primary implant stability. Consequently, 3D micro-architectural parameters using micro-CT or CBCT, which are correlated with the mechanical properties of bone in relation to bone strength, are significantly correlated with implant stability in this study. Furthermore, there is an increase in implant stability prediction by combining BV/TV and SMI in stepwise forward regression analysis. As a result, the combination of bone density parameters and architectural parameters using micro-CT or CBCT can increase prediction in dental implant stability.
Our study shows that dental implant stability measured by impact response frequency is highly correlated with 3D trabecular microstructural parameters using micro-CT or CBCT. Bone with high volume density and low surface density shows high implant stability, as does well-connected, thick bone with small marrow spaces. The combination of bone density and architectural parameters measured using CBCT can predict the implant stability more accurately than the density alone in clinical diagnoses. In future studies, we will investigate the relationships between implant stability as determined by impact response frequency and microstructural parameters using CBCT in human bones.
 XML Download