

 PDF
PDF ePub
ePub Citation
 Print
Print


I. Introduction
Breast cancer is the most common malignant disease among women. Clear evidence shows that early diagnosis and treatment of breast cancer can significantly increase the chance of survival for patients1). Mammography is regarded as themost effective method for the early detection of breast cancer. Mammography-based screening programs are carried out in many countries, and their effectiveness has had a great impact on prognosis. An early sign of 30-50% of breast cancer detected mammographically is the appearance of clusters of fine, granular micro-calcification2)-5), and 60-80% of breast carcinomas reveal micro-calcification upon histological examinations6). With the advances of digital image processing, radiologists have an opportunity to improve their performance with computer-aided diagnosis (CAD) system. The use of a CAD system as an objective "second reader" is considered to be one of the promising approaches that may help radiologists improve the sensitivity of mammography. On average, the reader's sensitivity can be increased by 10% with the assistance of CAD7).
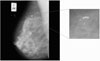
There are many methods that can be used to detect micro-calcification and reduce the number of false-positive (FP) detections. A common approach that some researchers have used is a rule-based method8). Artificial neural networks are another means of reducing FP9)10). Karssemeijer11) developed a statistical method for detection of micro-calcification in digital mammograms(Figure 1). The method is based on the use of statistical models and the general frameworks of Bayesian image analysis. Chan et al12)13) investigated a computer-based method for the detection of micro-calcification in digital mammograms. The method is based on a difference image technique in which a signal suppressed image is subtracted from a signal enhanced image to remove structured background in the mammogram. Yoshida et al14) used decimated wavelet transform and supervised learning for the detection of micro-calcification. Shen et al15) discussed different shape factors including compactness, moments, and Fourier descriptors in calcification analysis. These quantitative measures represent the roughness of shapes and are used to classify calcifications in mammograms. They conclude that the combination of these three measures is better than just using only one or two.
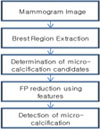
In this paper, we present the research and development of a CAD system for the automatic detection of the clustered micro-calcification(Figure 2). The proposed system consists of three main steps : a) segmentation of breast region, b) detection of candidates, c) false-positive reduction using feature analysis. In the first step, the breast region is segmented using GLCM contrast method. Then, foveal segmentation is used to extract candidate of micro-calcification. Heucke at al16) proposed image segmentation using foveal method. In order to detect micro-calcification, we adopted foveal method. Among these candidates, there are much false detection due to noise, blood vessels, and dense breast tissue in the mammogram. Therefore, in the last step, false individual micro-calcification objects are removed using a set of 8 features.
II. Materials and Method
1. Materials
In out experiments, proposed algorithmwas implemented withMATLAB on a Pentium4 3.0GHz PC.
We used a database of 21 mammograms, originating from the Mammography image analysis society (MIAS). Each mammogram shows one or more clusters of micro-calcifications marked by expert radiologists. The X-ray films in the database have been carefully selected from the United kingdom national breast screening program and digitized with a Joyce-Label scanning microdensitometer to a resolution of 50µm × 50µm, 8bit represent each pixel. All mammograms selected contain micro-calcification (11 benign and 10 malignant, according to database ground truth tables) and correspond to dense and fatty breast.
2. Methods
We extracted breast region using GLCM, and applied to use foveal masks to decide candidates of micro-calcification. After applying feature analysis, we reduced false-positive. Finally, we obtained micro-calcification.
A. Breast region segmentation
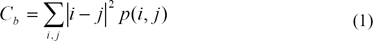
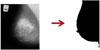
The breast area in this data set only covers about 30%, on average, of each mammogram. Based on this observation, the breast area is first segmented out in order to save processing time and avoid false detections caused by markers and sharp edges near the chest side. Contrast property of GLCM technique is used to achieve this purpose, as in Eq(1). I and j are image coordinates, p(i,j) is GLCM value. The result of this procedure is shown in Figure 3.
B. Detection of micro-calcification candidates
After the breast region was identified, individual micro-calcificationswere detected using foveal algorithm16).
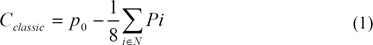
The classical contrast (Cclassic) is calculated at every pixel as the difference between that pixel value (P0) and a weighted sum of the pixel values in an immediate neighborhood (N), as in Eq (2).
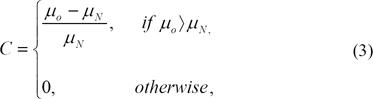
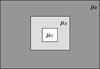
In a simpler scenario, Cclassic is compared with a fixed threshold, over the whole image andmicro-calcification are marked. The variation in height in a image or intensity in a typical mammogram makes it far easier to detect micro-calcification(or contrast changes) against a fatty (dark) background but more difficult to detect correctly against a denser (bright) background17). We compute a set of mean intensity values of the inner area of the object to visualize (i.e. within the boundary of calcification), its neighborhood (the local area around the object) and background (the rest of the breast tissue). The histogram of the inner foveal surface provides the mean of the object (µ0), as the histogram of the whole image will give us the mean of the background (µB) and a measure of the density of breast. The mean of the neighborhood (µN) is found from the intensities of pixels within the neighborhood and excluding the object pixels according to Figure 4.
µN determineswhether the visualized object is on a dense (bright) or a fat (dark) area of breast. The size of the kernel of the inner object (O) used to compute µ0 is established according to the average size of micro-calcification17). It is desirable to have a slightly smaller kernel than the micro-calcification diameter to assure the detection of small calcium salts, which are overlooked by larger kernels. Still, the size of O must not be too small to avoid overlapping O and N for slightly bigger micro-calcification. In our application N is set twice the size of O. O is 10×10 dimension. Then the perceivable contrast C is calculated in agreement with the following equation:
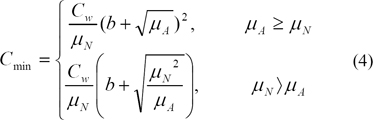
We then computed Cmin (4), a measure of contrast sensitivity, where µA = ωµN + (1 - ω)µB and ω is a suitable weight between 0 and 1 affecting the amount of background implied in the computation of contrast. Cmin sets the threshold from which objects in the image are visible for the observer, a measure of the eye's ability to perceive luminance gradients. The literature proposes 7.7% of the adaptive luminance to be due to the background luminance [16], which gives a value of 0.923 to our weight w. In practice, we studied the effect of varying w with 10% more or less than the proposed value. For parameter b in Eq (4), we have found that the literature proposed value b = 0.0808 gives good results. Areas in the image having C > Cmin are marked as micro-calcification16).
C. False-positive reduction of micro-calcification
In order to reduce false-positive (FP), we determined whether a potential individual micro-calcification object segmented out in the previous step is a true or a false individual micro-calcification object. Karssemeijer's criteria for counting true positive (TP) and false positive (FP) is adopted. Atrue cluster is counted to be found if two ormore objects in the truth circle are found. A cluster is counted if three ormore objects are within the distance of 1cm. A false positive cluster is counted if none of the objects found in the cluster are inside the truth circle. Our method is based on a set of 8 features extracted from these potential individual micro-calcification objects (Table 1). We selected 8 features which are valid statistical features of micro-calcification. These features are all calculated from the original image. A square neighborhood of 10 pixels larger than the potential individual micro-calcification object in diameter is used to extract GLCM contrast, GLCM correlation, GLCM entropy, fractal dimension hurst coefficient (FDHC) for each potential individual micro-calcification object.
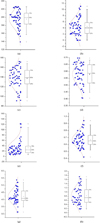
The set in feature analysis is generated by using 54 region of interest (ROI). The truth image of the ROI with a cluster of micro-calcification in the center is used to obtain features for true individual micro-calcification objects. To obtain the features for the false individual micro-calcification objects caused by noise, blood vessels, and dense breast tissue. So, we selected with micro-calcification that is suitable by using 8 features (Fig. 5).
III. Result
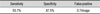
In this study, 54 ROI images and 21 mammograms are employed to test the proposed algorithm. A cluster, in our experiment, is defined as a group of micro-calcification pixels (>=2pixels) in 10×10 pixel box. The performance of the proposed approach is evaluated by sensitivity and FP/image. The final detection result of the mammogram is shown in Table 2.
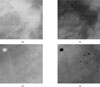
We got the result image using all the 8 features for the detection of individual micro-calcification objects, as shown in Figure 6.
IV. Discussion & Conclusion
In this study, the research and development of micro-calcification cluster in mammograms is presented. The proposed CAD system consists of three main steps. In the first step, breast region is segmented using GLCM contrast property. In the second step, potential micro-calcification pixels are detected from breast region by foveal method. Finally, false individual micro-calcification objects are removed based on a set of 8 features. Foveal method serves a key role in detecting potential micro-calcification objects. It removes most of the structured noise from a mammogram. This technique appears to be applicable also in other types of computer-aided diagnosis in which the background anatomical structures may interfere with the detection of abnormalities.
Results show that the proposed system gives quite low FP rate. In particular, some breast structures such as dense tissues, ducts, or skin folds may have intensity similar to those of micro-calcification, and thus will also be enhanced in the difference image. It is evident from the results in Table 2 that proposed system, while providing good detection accuracy for moderately subtle micro-calcification. In order for a CAD system to be useful clinically, it must provide acceptable FP rate. We plan to research for other features that calculate characteristic of micro-calcification to reduce FP rate and apply 16-bit mammogram images.
Processing time is an important consideration for the implementation of a computer detection system in clinical settings. In our study, all the algorithms were implemented with MATLAB on a Pentium4 3.0GHz PC. The average execution time for calculating is 5 seconds per one image. The improvement of processing time must be based on the detection accuracy achieved.
Although further studies will be needed to optimize the image-processing, FP reduction techniques and to improve the detection accuracy for subtle micro-calcification, we have demonstrated the usefulness of utilizing several features.
 XML Download