

 PDF
PDF ePub
ePub Citation
 Print
Print


I. Introduction
Complete and accurate excision of cancer is important, and it can be guided by the histopathological examination of tissues obtained during operation. Histopathological diagnosis using hematoxylin and eosin (H&E) staining of frozen sections of patients' tissues is currently a common practice. However, the preparation of frozen tissues for histopathological examination is labor intensive and slow, and this sometimes leads to insufficient or inaccurate results [12]. Confocal laser scanning microscopy (CLSM) has been used in the in vitro and in vivo imaging of cells and tissues because it has high sensitivity and resolution. In addition, CLSM has been used to show images of nuclear and cellular parts in detail, similar to that seen in histopathology, but it is carried out directly in fresh tissue [345]. Also, it can provide more detailed molecular or genetic information [56]. However, the colors used in CLSM are different from those seen in H&E staining, although pathologists are familiar with the pink, blue, and white colors used in H&E staining. Therefore, it is still challenging to obtain fluorescence images that are similar to or better than those produced by H&E staining.and white colors used in H&E staining. Therefore, it is still challenging to obtain fluorescence images that are similar to or better than those produced by H&E staining.
Computer technology can facilitate the production of CLSM images that are similar to H&E staining images. Image processing is becoming important in a computer technology for many reasons. In particular, image processing methods have been studied to produce a variety of image data. Such technology mainly uses pixel intensity and edge-based information. Image processing can now assist image analysis, which enables pathologists and radiologists to concentrate on a region of interest (ROI).
In this study, we attempted to obtain images that can provide the same or more information than H&E staining images by using CLSM with our recommended image processing method. The proposed method consists of pre-processing and conversion processing. To facilitate the classification of the color, pre-processing is first performed to convert Lab color space from RGB color space and to remove background artifacts. Secondly, conversion processing is carried out using a binarization and morphological method to choose the segmented region. Finally, the color is adjusted to make the images similar to H&E staining images.
II. Case Description
1. Preparation of Materials
A Calu-3 human lung adenocarcinoma cell line sample was obtained from the American Type Culture Collection (ATCC, Manassas, VA, USA). Fetal bovine serum (FBS), Eagle's Minimum Essential Medium (EMEM) cell culture medium, and antimicrobials/antimycotics were purchased from Life Technologies. The Calu-3 cancer cell line sample was maintained in EMEM media supplemented with 10% FBS and 1% antimicrobials/antimycotics at 37℃ under 5% CO2 in a standard humidified incubator.
2. Obtaining of Fluorescence Images of Tumors
All animal studies were approved by the Institutional Animal Care and Use Committee.
Female athymic nude mice (BALB-c/nude, 5 weeks old) were used for the in vivo experiments. Calu-3 cells (5 × 10⁶ cells/50 µL of EMEM media) were subcutaneously implanted into the left hind flank of each mouse. Tumor tissues were collected when their size reached approximately 180 mm3. The tumor tissues were washed with saline solution, put in OCT solution, and frozen at –70℃. After serial sectioning of the tumor tissues by 7 µm thickness using a Cryotome, the sectioned tissues were placed on slide glasses. For the preparation of dye solution for fluorescence staining, Hoechst 33342 and eosin Y were dissolved in a phosphate-buffered saline (PBS; pH 7.4, 10 mM, NaCl 150 mM) solution to obtain final concentrations of 0.1 and 10 mg/mL, respectively. Then each tumor section was stained with the dye solution for 30 seconds and washed with deionized water. Finally, mounting medium was dropped on the tissue sections followed by sealing with cover glass. CLSM images were obtained with Carl Zeiss LSM 780 (Plan-Neofluar 10×/0.45 M27; Ex/Em for eosin Y, 488 nm/499–633 nm; Ex/Em for Hoechst 33342, 405 nm/410–513 nm).
3. Obtained Image Using Image Processing
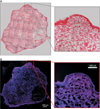
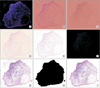
Microscopic images were obtained from each tumor section as seen in Figure 1. Also, the data was obtained by CLSM, and then it was converted using the developed algorithm as follows. As shown in Figure 2A, a 16-bit TIFF image file was obtained from a microscope, which has two frequencies, and it was subjected to image processing. In general, RGB color space is widely used to display red, green, and blue. RGB color space is used to easily represent color on a computer. Thus, many colors can be expressed. However, it is difficult to apply it to perceptual characteristics. Using the proposed method, as shown in Figure 2B and 2C, RGB images were converted to the CIE Luv color space, which separates the brightness and the chromaticity. White balancing is performed from the background region in Figure 2D. In this process, it gained a result of Figure 2E. Figure 2F was obtained by subtraction of Figure 2B from Figure 2C. Figure 2G was obtained by color balancing and contrast stretching of the subtracted image of Figure 2E from Figure 2F. This enhanced the contrast of the nucleus image. Then, the original image was converted to a grayscale image and was added to a generated binary mask with a fill-hole operation, as shown in Figure 2H. Finally, Figure 2H was added to the processed image presented in Figure 2G to make the result image shown in Figure 2I.
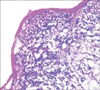
Finally, the magnified confocal images, which show blue-colored nuclei and pink-colored cytoplasm and extracellular matrix, were obtained as seen in Figure 3, after the image processing procedure.
III. Discussion
In cancer surgery, it is necessary to strive to minimize the ablation of normal tissue and all tumor tissue should be completely removed. However, it is not easy to determine the resection border during surgery. Many surgeons take intraoperative frozen sections to allow for microscopic examination, which is able to confirm the presence or absence of remaining cancer tissue [12]. Obtaining an accurate histopathologic diagnosis in a short time represents a clinical advantage for patient management. CLSM is a highly sensitive imaging technique that may provide microscopic images of fresh tissue that correspond to H&E stained slides [5].
De Rossi et al. [7] reported that they could obtain confocal fluorescence images similar to H&E stained images obtained using fluorescent dyes. Since hematoxylin staining of nuclei does not use a fluorescent dye, it has been possible to obtain fluorescence images using an eosin dye only through a fluorescence microscope. Thus, with fluorescence images, it is not possible to obtain information about the position and shape of the nucleotides which can be obtained using H&E-stained images. Gareau et al. [8] also tried to obtain fluorescence images from patient tissue sections after staining nuclei with acridine orange and staining cytoplasm with eosin dye. Even though these fluorescence images were shown to be somewhat similar to H&E staining images, the extracellular matrix was not well stained with eosin. Moreover, acridine orange unexpectedly stained the elastin fibers of the tissue sections. Another problem in using acridine orange for nucleus staining is that its absorption and emission spectra overlap with those of eosin dye in confocal laser microscopy.
Therefore, in the current study, we used Hoechst 33342 for nucleus staining of tissue sections instead of acridine orange. Hoechst 33342 has long been used in nucleus staining because it becomes highly fluorescent only when it binds to double-stranded DNA, with a preference for sequences rich in adenine (A) and thymine (T). Although dyes can bind to all nucleic acids, AT-rich double-stranded DNA strands enhance fluorescence considerably [9]. In addition, its absorption and emission spectra do not overlap those of eosin dyes.
The fluorescence image in Figure 1B confirms that staining of tissue sections by Hoechst 33342 and eosin was well done without overlap between these dyes. However, black coloring, indicating the absence of fluorescence signals, made the analysis of the fluorescence images difficult. Therefore, we then processed the fluorescence images through a 9-step process as shown in Figure 2. We improved images by using several image converting techniques, including morphological methods, color space conversion methods, and segmentation methods [101112]. As a result, the final images obtained after image process showed colors very similar to those seen in images obtained by H&E staining, and it is advantageous to conduct analysis through fluorescent dye imaging and microscopy rather than analysis with single microscopic imaging. Still, there are a few problems in the use of the proposed method. First, it is difficult to obtain images comparable to H&E staining images and accurate results. Therefore, to solve these problems, a light correction method as a preprocessing step is required to improve image enhancement in the fully automatic method. In particular, the shape and position of a nucleus was not only clearly visualized but also discriminated from the cytoplasm and extracellular matrix. We believe that the technique used in this study has great potential for application in clinical tissue analysis.
 XML Download