

 PDF
PDF ePub
ePub Citation
 Print
Print


I. Introduction
Data mining is a recently developed technological methodology that has been used intensively and extensively in many fields. It is defined as the process of discovering previously unknown patterns or trends from stored data, building predictive models based on that information. Compared with the past healthcare system, there has been an ever increasing amount of data generated by current healthcare settings. The amount of data generated in current healthcare settings is becoming too large and complex to be analyzed by traditional statistical methods. Due to its good applicability to any field of study, data mining has gradually gained popularity in almost all areas of healthcare [1]. However, data mining has been used mostly to analyze disease-focused clinical data rather than community data gathered for primary care providers in Korea. The importance of accessing community health status has been widely recognized throughout the nation and data mining can empower local decision makers with a clear methodology for organizing and interpreting healthcare data [2].
Data mining has been recognized as a solution to handle these large amounts of complex data, transforming these data into meaningful information for the decision making process of health professionals. A comprehensive community health profile plays an important role in the development, refining and monitoring of long-term strategies designed to improve the overall health status of the population across the nation. Such information obtained at the community level can be used to ensure that the best resource allocation choices are made to improve community health [3]. Along with Korean Elderly Survey, a number of national representative studies, such as the Korean Longitudinal Study of Ageing and the Korean Retirement and Income Study, have recently been conducted in Korea [4,5]. Currently, more healthcare data are available at the community level, enabling health professionals to make a transition from the previous disease- and treatment-focused strategy to a health- and prevention-focused strategy. This also clarifies the public health role, which should be supported by unbiased data that accurately reflect a community's health status, needs, and resource allocation [6].
The proportion of elderly population in Korea reached 11.8% in 2012 which is expected to increase further accounting for 24.3% in 2030 and 37.4% by 2050 [7]. The growing elderly population has a huge impact on the healthcare system, and malnutrition is a common health problems found frequently among the elderly [8]. The leading causes of malnutrition include several individual factors, such as poor oral health, loss of vision and hearing, dementia, impaired mobility, and pain. Malnutrition is both a cause and consequence of many geriatric diseases that accounts for a significant proportion of national medical spending [9]. Nutritional status has a great influence on the immune system of the human body; the lower immune response induced by malnutrition eventually puts elderly individuals at a high risk of infection, increasing the risk of mortality [10]. A rapid and precise diagnostic method that supports clinical decision enables the earlier identification of the elderly at risk of malnutrition. This will eventually prevent negative outcomes caused by poor nutritional status, resulting in a substantial reduction in healthcare cost spent on the elderly population [11]. Most studies to date have conducted research on small samples obtained from local hospitals or specific communities using traditional statistical analysis, which may not be sufficient for discovering comprehensive knowledge [12]. In addition, the limited number of variables analyzed in those studies could not provide integrative understanding of elderly malnutrition.
Data mining is known to be the best method in terms of the cost estimation, disease diagnosis, prediction of prognosis, and the discovery of hidden patterns in the healthcare system with the use of large health database [13]. A decision tree model presented in this study was developed from a combination of decision tree approaches and statistical analysis. Data mining provides information that can be the used in the analysis of risk factors for certain types of diseases. Contrasting the characteristics of ill patients with those of healthy people to find the patterns related to the occurrence of disease has been a common practice in evidence-based medicine [14]. The purposes of the study were to identify the best modeling method among data mining tools by testing the discriminatory power of individual models and to identify the patterns related to the occurrence of malnutrition in elderly. Finding patterns for the related characteristics of risky conditions that threaten the health of the community may contribute to the achievement of public health goals with effective disease prevention strategies. By identifying the associated characteristics of older adults who are more likely to be malnourished in community settings, the decision tree model allows health professionals and decision makers to intervene earlier to allocate adequate resource for nutritional support, improving the overall health of the community.
II. Methods
1. Subjects
A secondary analysis of a large community data set from the 2008 national study of Korean elderly was conducted to provide accurate information regarding the characteristics of the elderly at risk of malnutrition in Korea. The Institutional Review Board gave prior approval to the study. The sample consisted of 15,146 adults over 60 years old and community dwelling. The ten items of the 'Determine Your Nutritional Health Checklist' were used to access dietary intake and meal patterns. The tool was developed by the Nutritional Screening Initiative to screen nutritional risk in the elderly population. A summed score of 0-2 indicates good nutritional status, 3-5 moderate risks, and 6 or more high risk [15]. In this study, elderly people with summed scores of 3 or more were classified as being at risk of malnutrition as they pose problems for malnutrition.
2. Decision Tree Models
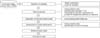
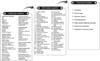
Figure 1 presents the data mining process that started with the selection of variables. The target variable was malnutrition, and the 52 input variables covered all aspects of elderly malnutrition, including general characteristics, family & social relationship, economic status, health status, health behavior, functional status, leisure & social activity, quality of life, and living environment (Figure 2). The ratio between the training data and test data was 7:3 by random division of the full data set to which four tree-structured models, including C5.0, CHAID, QUEST, and classification and regression (C&R) Tree, were applied. In an assessment of model performance, analysis node was used to calculate the percentage of correct and wrong classification of each model, and then the correct classification rates of the models were compared to select the best model. In this study, the C&R Tree showed the best predictive performance, and it was selected to draw the final decision support tree [16]. A decision tree is a visual representation of obtained knowledge using a tree form in which each branch represents an output of the test. This decision tree enables easy understanding and interpretation of data as the nodes and branches are organized hierarchically. It generates reliable knowledge, promoting accuracy in clinical decision-making [17]. The C&R Tree node is a tree-based classification and prediction method. The C&R Tree approach provides a very simple representation that displays accumulated knowledge well. This method allows the tree to grow large before pruning, which results in smaller trees, and this ensures better cross-validation properties of decision tree modeling [18]. The recursive partitioning process splits the records into segments with similar output field values, and two subgroups are defined by the first split. The split ends when one of stopping criteria is triggered [19].
3. Statistical Analysis
The default experimental parameters of Clementine ver. 12.0 (SPSS Inc., Chicago, IL, USA) were utilized to construct the decision tree model with the usage of the C&R Tree component in this study. SPSS ver. 12.0 for Windows (SPSS Inc.) was used to perform the statistical analysis in which important variables were chosen using the feature selection method. Among Pearson, Likelihood ratio, Cramer's V, and Lambda-a, Pearson correlation analysis was selected to prioritize the meaningful variables [20].
III. Results
1. Demographic Characteristics of the Subjects
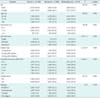
A total of 15,146 elderly subjects were included in this study, and the sample consisted of 6,185 males (40.8%) and 8,961 females (59.2%). Of the total participants, 7,769 (51.3%) had normal nutritional status while 7,377 (48.7%) had poor nutritional status. Compared with elderly subjects showing good nutritional status, the mean age of elderly subjects at risk of malnutrition was higher (Table 1). About three-fourths of older people living alone were categorized as having poor nutritional status, and there was a greater proportion of elderly subjects with good nutritional status in the higher monthly income group. Apart from 54 participants (0.4%), the majority of participants had been married at least once. While malnourished elderly subjects comprised about one third of the married group, the proportion of malnourished elderly subjects was much greater in the separated or living alone groups, accounting for 73.5% and 65.2%, respectively.
2. Selecting Important Attributes
As a result of the feature selection process, 48 important attributes were identified to be important variables of a total of 52 input variables shown in Figure 2. Seven variables including chewing ability, level of life satisfaction, depression status, health status, number of diagnosed diseases, difficulties in daily activities caused by pain, subjective economic state, and monthly income were identified to be most significant variables.
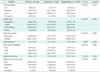
3. Comparing Predictability of the Models using Analysis Node
The highest percentage of correct prediction in training data was reported in C5.0; however, the C&R Tree model showed relatively higher percentages of correct prediction in both training and test data with 78.10% and 80.95%, respectively (Table 2).
4. Modeling of the Data using C&R Tree
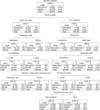
Figure 2 presents seven finalized input variables that were selected during feature selection. The final decision support model was designed using the C&R Tree algorithm and is shown in Figure 3.
In this study, a total of six rules were identified to be associated with the risk of malnutrition in the elderly. The six decision rules were the following: 1) good and very good chewing ability, depressed, level of life satisfaction less than 2.89; 2) good and very good chewing ability, depressed, level of life satisfaction above 2.89, severe difficulty in daily activity caused by pain; 3) low chewing ability, living with spouse or children; low chewing ability, living with spouse or children, depressed; 5) low chewing ability, living with spouse or children, not depressed, number of disease above 2.5; 6) low chewing ability, living with spouse or children, not depressed, number of disease less than 2.5, subjective income status is poor.
5. Variables in the Final Modeling
The traditional statistical method and chi-square test were used to find out whether there are significant differences between the elderly at risk of malnutrition and normal subjects in the seven final variables identified by the C&R Tree algorithm. All seven variables showed statistical significance with a p-value of <0.05 (Table 3). Chewing ability, in particular, showed the biggest differences between well-nourished participants and malnourished participants. The majority of participants with low to moderate chewing ability had poor nutrition status (84.1% and 70.2%, respectively) while eight out of ten participants with either good or very good chewing ability were well-nourished. In addition higher proportions of individuals with depression, low life satisfaction, many difficulties in daily activities and poorly perceived economic status were found to be at risk of malnutrition.
IV. Discussion
This study explored the applicability of a prediction model using data mining of a large community data set. To improve the accuracy of knowledge regarding the characteristics of the elderly at risk of malnutrition, we identified significant rules during the process of data mining. Elderly subjects at risk of malnutrition were compared to normal and well-nourished elderly subjects to find the patterns associated with the occurrence of malnutrition in the elderly population. A tree-structured decision model was designed, and its potential application to large amounts of public health data was examined. Malnutrition is a commonly reported condition among the elderly, and it is considered to be both a cause and consequence of many age-related diseases. There has been growing concern over poor nutrition status in Korea as we are becoming an aging population. Therefore, this study was carried out to find patterns related to malnutrition in the elderly. Using the C&R Tree model, a well-designed prediction model was developed, which showed good performance in finding associated rules [18]. The C&R Tree uses a recursive partitioning method that provides a very simple representation that displays accumulated knowledge with a well-organized structure. To predict continuous dependent variables (regression) and categorical predictor variables (classification), the C&R Tree builds a classification and regression tree [15]. Compared with other classification technique used for classification or regression of problems, there are many benefits that can be obtained using the C&R Tree [21]. The simplicity of the C&R Tree enables clinicians to make rapid classification of new clinical observations. Moreover, when there is a little prior knowledge, tree methods are known to be well suited for data mining tasks for data from healthcare settings [22].
In this study, seven variables and six rules for the prediction of malnutrition risk in elderly subjects were identified. Those associated rules provide information regarding co-occurrence and relationships between risk factors that may increase the probability of elderly suffering from malnutrition. According to the rules identified by the decision tree model, elderly people living alone with low chewing ability, depression, low life satisfaction, comorbidity, functional limitation and subjective economic issues are more likely to be malnourished. Findings are consistent with previous studies conducted to identify patient factors associated with the risk of malnutrition that was strongly associated with age-related changes of older adults. Elderly people with swallowing difficulties due to oral problems, such as absence of teeth, poor oral hygiene, and gum infections, have a decreased food intake and are vulnerable to malnutrition [23]. In addition, several studies found that along with functional changes, social changes in elderly people's lives (loss, changed family structure, and decreased income) may result in depression and reduced life satisfaction, increasing the risk of being malnourished [24].
The final results of the tree method demonstrated the usability of large public health data sets with good feasibility of decision model in the classification of elderly with malnutrition. Through repeated testing and refinement of data mining and the C&R Tree in particular, it is anticipated that new knowledge will be discovered by more sophisticated analysis of healthcare data at the community level [13]. As a result of this study, a reliable decision support model was designed that provides accurate information regarding the characteristics of the elderly with malnutrition. The algorithm used to construct the decision tree showed high accuracy, and it is expected to facilitate the discovery of discriminatory knowledge for the targeted problem. The C&R Tree, which was based on the C&R Tree method, provided excellent discrimination of the characteristics associated with malnutrition in the elderly. This decision tree can be utilized to identify community residing elderly individuals who are at high risk of malnutrition; this will eventually contribute to significantly reducing healthcare costs spent on treating malnutrition and its complications in the elderly.

 XML Download