

 PDF
PDF ePub
ePub Citation
 Print
Print


INTRODUCTION
There are strong seasonal trends in asthma-related hospital admissions and cold dry air can trigger asthma symptoms.123 Weather conditions also influence the levels of air pollutants, some of which have been suggested as asthma triggers.456 However, studies exploring relationships among weather conditions, air pollution, and asthma have reported inconclusive and inconsistent results.57 This might suggest that the effects of the outdoor environment on asthma are complex and not dependent simply on the amount of exposure but related to complex interactions among environmental factors and personal components.
Thus, well-designed studies and appropriate analytical methods are necessary to account for the multiple confounding factors. The key to performance of effective studies of the outdoor environment may be to select an appropriate location that provides a relatively homogenous outdoor environment for the population. Carey et al.8 used Bermuda, an isolated, clean island without air pollution or aeroallergens. The population of Bermuda considered a north wind to be bad for asthma, from experience. Indeed, it was demonstrated that wind from the north was typically of low humidity and low temperature; both of these conditions were related to asthma exacerbations. Regarding analytical methods, a case-crossover design enables examination of relationships between brief exposures and risk of an acute-onset disease by comparing outcomes within subjects with various levels of exposure at different time points before disease onset. It is an analysis of each individual, not the population, and self matching of cases eliminates the threat of control-selection bias, such as age, gender, and physical status, and increases efficiency.9 In a study of outdoor environments, a case-crossover analysis can adjust for seasonal variables, including seasonal aeroallergens and long-term variation in air pollution, which are important confounding factors in time-series analyses.
This study was conducted to estimate the effects of weather and air pollution on asthma exacerbations using a case-crossover analysis in Chuncheon, situated in a relatively isolated large basin with rivers and lakes and surrounded by mountains (Supplementary Figure). In particular, the effects of fog on asthma exacerbations were evaluated due to the common occurrence of fog in this location. The medical records at two university hospitals in Chuncheon, which were expected to cover the majority of acute asthma exacerbations in the city, were reviewed.
MATERIALS AND METHODS
Study subjects
We retrospectively reviewed patients with asthma exacerbations who had visited the emergency department (ED) of 2 university hospitals (Kangwon National University Hospital and Chuncheon Sacred Heart Hospital) in Chuncheon from January 1, 2006, to December 31, 2011. The study protocol was approved by the Institutional Review Board of each participating hospital.
Asthma exacerbations were defined as ED visits for asthma that were identified based on a diagnosis of asthma by the ED physicians and use of a bronchodilator via a nebulizer in the ED. The diagnosis of asthma was made using asthma-specific International Classification of Diseases, Tenth Revision (ICD-10) codes (J459, J450, J460, J461, J469) by ED doctors. Use of a bronchodilator was identified by an ED order for salbutamol sulfate in electronic medical records, because it was the only beta-agonist + nebulizer used in the enrolled hospitals. Data about age, gender, arrival time at the ED, and results of treatment in the ED, such as discharge or admission, were collected. ED visits within 1 week after a previous ED visit were regarded as part of the previous asthma exacerbation and not included separately in the analysis.
Meteorological data were retrieved from the database of the Korea Meteorological Administration. Data about air pollution were retrieved from routine monitoring of gaseous air pollutants by the Gangwon Institute of Health and the Environment. The data included daily highest, lowest, and mean temperature, daily temperature range (DTR, highest - lowest temperature), daily mean dew point temperature, daily lowest and mean relative humidity, maximum and mean wind speed with wind direction, mean atmospheric pressure, mean amount of cloud cover, the presence of rain, solar irradiation, daylight hours, and the presence of fog. The daily average levels of sulfur dioxide (SO2), nitrogen dioxide (NO2), ozone (O3), carbon monoxide (CO), and airborne particulate matter equal to or less than 10 µm in diameter (PM10) were collected. A case-crossover analysis was performed for the whole study population and then subgroup populations, children (≤19 years old) and elderly patients (>60 years old), because children are known to be a vulnerable population.11011
Statistical analysis
Characteristics of enrolled subjects and ED visits are presented as means and standard deviations (SD) for continuous variables and as relative frequencies for categorical variables. We used a case-crossover design originally proposed by Maclure9 that has been widely used for analyzing the acute health effects of air pollution. The approach compares exposure variables on a case day with control days within a subject. This method has the advantage of controlling for time-invariant individual confounders, such as physiological status. There are many reference selection strategies in case-crossover designs, and we used a 1 week bi-directional approach: 2 control days (1 week before and after) were matched with the case day. A 1 week bi-directional approach can reduce confounding variables related to the day of the week. Lagged effects were assessed for up to 3 days (from lag 0 to lag 3). We fitted conditional logistic regression models to estimate associations between exposure and ED visits using "PROC PHREG" in the SAS software (ver. 9.2; SAS Institute, Cary, NC, USA). Results are expressed as the percentage changes in risk of asthma ED visit per 1 or 10 unit increases in each variable.
RESULTS
Characteristics of enrolled patients and ED visits
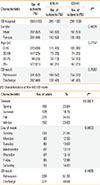
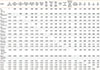
There were 660 ED visits by 583 patients with asthma exacerbations over a 6 year period. There were 564 days with ED visits with asthma exacerbations, and the median (range) number of ED visits on those days was 1 (1-5) per a day. Characteristics of the 583 patients and 660 ED visits are shown in Table 1.
Air pollution and fog
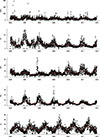
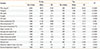
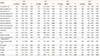
Levels of PM10, CO, NO2, and SO2 were higher in winter. In contrast, levels of O3 were higher in summer and correlated negatively with SO2, NO2, and CO levels (Fig. 1). There were 320 foggy days over a 6-year period. Fog was more prevalent in winter and fall; the pattern was similar over a 6-year period. There were 130 (40.6%) foggy days in fall (September-November), 93 (29.0%) in winter (November-February), 52 (16.3%) in spring (March-May), and 45 (14.1%) in summer (June-August). Meteorological variables and levels of air pollutants in foggy and non-foggy days are shown in Table 2. The levels of air pollution were higher on days with fog than non-foggy days, with the exception of O3 level. Maximum and mean wind speeds were lower on foggy days. Mean relative humidity and dew point temperature were higher on foggy days. Mean and maximum temperatures were lower on foggy days. However, in a comparison of foggy and non-foggy days in fall and winter, the relationships between meteorological factors and the presence of fog were consistent, with the exception of daily temperature and SO2 level. Mean, maximum, and minimum daily temperatures were higher on foggy days (6.6 vs. 4.2℃, P=0.01; 12.6 vs. 10.2℃, P=0.0002; 2.4 vs. -0.95℃, P<0.0001, respectively) in fall and winter. There was no difference in the SO2 levels between foggy and non-foggy days in fall or winter.
Correlations between humidity, wind speed, and air pollution
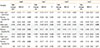
Ambient CO and NO2 levels were negatively correlated with mean wind speed (r= 0.42, P<0.001 and r=-0.50, P<0.001, respectively; Table 3). The O3 level was positively correlated with mean wind speed (r=0.63, P<0.001). Ambient CO and NO2 levels were correlated positively with mean relative humidity (r=0.26, P<0.001 and r=0.24, P<0.001, respectively). The O3 level was negatively correlated with mean relative humidity (r=0.47, P<0.001).
Univariate analysis
In univariate analysis, the risk of asthma exacerbation decreased, by 9.55% and 8.75%, respectively, according to a 10% increase in mean relative humidity on lag 1 day and lag 2 day (P=0.012 and P=0.027, respectively; Table 4). The prevalence of asthma exacerbation was lower after lag 2 day with fog (risk increase: -29.41%, P=0.013). The prevalence of asthma exacerbation was higher after lag days 1-3 with a higher mean wind speed. The prevalence of asthma exacerbations was lower after high levels of CO and NO2 (lag 1-3 and lag 2-3, respectively).
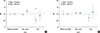
In patients aged ≤19 years, fog in lag 2 showed a protective effect against asthma exacerbations (risk increase: -47% (95% CI=-66.1% to -17.1%), P=0.005; Fig. 2). Mean wind speed in lag 3 was associated with asthma exacerbations (risk increase per 1 m/s increase: 41.3% (95% CI=9.0%, 83.1%); P=0.009). Mean relative humidity in lag 3, and the CO level in lag 2 and lag 3, were related to a decrease in asthma exacerbations (risk increase per 10% increase: -13.5% (95% CI=-24.6% to -0.8%), P=0.038, risk increase per 1 ppm increase: -59.8% (95% CI=-78.1% to -26.1%), P=0.003, and risk increase per 1 ppm increase: -61.7% (95% CI=-79.1% to -29.5%), P=0.002, respectively). However, for patients aged >60 years, mean and maximum wind speed in lag 2 were associated with asthma exacerbations (risk increase per 1 m/s increase: 33.1% (95% CI=1.9% to 73.9%), P=0.036, and risk increase per 1 m/s increase: 20.2% (95% CI=4.0% to 39.0%), P=0.013, respectively). However, fog and relative humidity were not associated with asthma exacerbations in patients aged >60 years.
Multivariate analysis
Fog in lag 2 was negatively related with asthma exacerbations after adjusting for the lowest temperature (risk increase: -29.2% (95% CI=-46.2% to -6.9%), P=0.014). Mean relative humidity (%) in lag 1 remained negatively correlated with the prevalence of asthma exacerbation after adjusting for the lowest temperature and the presence of fog (risk increase per 10% increase: -9.5% (95% CI=-17.2% to -1.1%), P=0.027).
In the model using mean wind speed, mean relative humidity, and the levels of CO or NO2, mean relative humidity in lag 0 was protective against asthma exacerbations after adjusting for mean wind speed and CO or NO2 level (P=0.044 and P=0.038, respectively; Table 5). Mean wind speed in lag 3 was associated with asthma exacerbations after adjusting for mean relative humidity and CO level (risk increase per 1 m/s increase: 19.8% (95% CI=0.98% to 42.2%), P=0.038). Otherwise, there was no significant association between asthma exacerbations and NO2 or CO level after adjusting for mean wind speed and mean relative humidity.
DISCUSSION
Low relative humidity and high wind speed were significantly associated with asthma exacerbations in this study. Fog, characterized by high relative humidity and low wind speed, showed protective effects against asthma exacerbations in Chuncheon. This relationship was more prominent in patients ≤19 years old than in those >60 years old. High levels of ambient CO and NO2 were associated with decreased asthma exacerbations; however, there was no significant relationship between levels of ambient CO or NO2 and asthma exacerbations after adjusting for wind speed and relative humidity.
Weather conditions could affect asthma directly, acting on airways, or indirectly, through effects on aeroallergens and air pollutants.5612 Although it is relatively consistent that a decrease in air temperature is an aggravating factor for asthma symptoms,358 the effects of other meteorological factors, such as humidity, wind, and fog, on asthma are unclear. Several studies about asthma and ambient fungal spores or thunderstorms have reported that high humidity was related to asthma exacerbations.7131415 In contrast, low humidity was related to worsening asthma and asthma-related hospital admissions in other studies.1816 The prevalence of asthma showed a negative association with relative humidity in western European countries.17 Regarding the effects of wind on asthma, a few studies have reported inconsistent results. Hashimoto et al.10 reported that low wind speed is related to emergency visits for childhood asthma attacks, but Villeneuve et al.11 showed that wind speed was higher on the day of ED visits for asthma in children. There is no relationship between wind speed and asthma in another study.18 Carey et al.8 showed that a specific wind direction is related to low relative humidity, low temperature, and worsening asthma in Bermuda. These studies suggest that the effects of weather conditions are highly dependent on the environment of different places and individual factors, including age. In the current study, many complex confounding factors, including aeroallergens and seasonal variation, could be adjusted for by the case-crossover design at 1 week intervals between cases and controls, and demonstrated that exposure to high wind speed or relative humidity could have significant effects on acute asthma exacerbations with 1- or 2-day lag times. However, there was no significant effect on asthma exacerbations of other meteorological factors, including ambient temperature, although reports consistently state that a decrease in air temperature aggravates asthma symptoms.358 The lack of a significant relationship between ambient temperature and asthma exacerbations in this study may also have been due to the case-crossover design. A case-crossover analysis can adjust for seasonal variation; therefore, the differences in daily temperatures during a 1 week period were not sufficient to induce asthma exacerbations.
In addition, the effects of meteorological factors on asthma were different between patients aged ≤19 years and those aged >60 years. Protective effects of fog and humidity were more prominent in children and high wind speed on lag 2 day was more related to asthma ED visits in old patients. The reason for the different effects of wind speed and fog on the 2 populations is not clear. However children have been routinely identified as a vulnerable population in environmental health risk assessments due to specific behavioral and physiological mechanisms of children.19 For old people, reduced lung function as natural part of aging and pre-existing diseases such as co-existing chronic lung, heart or circulatory conditions may determine susceptibility.20
It could be deduced that fog had a protective effect against asthma exacerbations because foggy days were associated with low wind speeds and high humidity. Although there have been few studies on the relationship between fog and asthma, the findings are of most conflicted with our data, in that the occurrence of fog was associated with asthma exacerbations. Tanaka et al.21 reported that 8.8% of adult patients with asthma had increased hospital visits for asthma on foggy days. Kashiwabara et al.22 reported an increased occurrence of night-time ED visits for asthma exacerbations among children on misty or foggy nights using a time-series analysis. Using a univariate case-crossover analysis with 6 hours time intervals, Villeneuve et al.11 showed that the occurrence of fog was associated with an increased number of ED visits for asthma by children. However there were several limitations to the designs of these studies in terms of the number of complex confounding factors and determining the proper lag time between exposure and acute asthma exacerbations. Fog is regarded as an acid aerosol, as another air pollutant in many studies of asthma since Tanaka et al.23 reported that the pH of fog is low and that air pollution levels are low on foggy days. Fog is a cloud in physical contact with the earth's surface and many meteorological factors, including temperature and wind, are involved in fog formation.24 In addition, the profiles of ambient pollution on foggy days in the current study differed from those reported previously.23 Therefore, the profiles of ambient pollution on foggy days and the fog-forming process might differ according to environment, air pollutant levels, and geographical feature. Thus, it is possible that the effects of fog on asthma exacerbations differ geographically. The current study suggests that fog may not always exert a negative effect on asthma; indeed, its effects on asthma exacerbations could differ according to the weather and environment of the location in question.
Air pollutants have been suggested as asthma triggers in previous studies on traffic exposure, volcanic eruptions, and smog.252627 However, the reported relationship between asthma exacerbations and air pollution during 'natural' exposure is inconsistent, and air pollution-related asthma aggravations are expected to be dependent largely on the atmospheric conditions during such natural exposure.528 Several time-series analyses have reported that air pollution is related to asthma exacerbation.2930 However, Rossi et al.3 showed that air pollutant levels are not associated with asthma attacks; only temperature, among the meteorological factors examined, show a small asassociation with asthma. In the current study, ambient CO and NO2 levels were associated with a decrease in asthma exacerbations. These findings are inconsistent with other reports that suggest air pollution is trigger for asthma exacerbations which may be due to the case-crossover design. The case-crossover study with 1 week control matching adjusted seasonal variation and evaluated the changes of meteorological factors and air pollutants during a 1 week period. Additionally ambient CO and NO2 levels were negatively correlated with wind speed and positively correlated with relative humidity, and there was no significant relationship between levels of air pollution and asthma exacerbations after adjusting for wind speed and relative humidity. This suggests that the differences in daily air pollution levels during a 1-week period were not sufficient to induce asthma exacerbations, and daily changes in relative humidity and wind speed might have greater effects on asthma exacerbations than air pollution in Chuncheon.
This study had several limitations that should be considered. First, this case-crossover study could not explain the seasonal trend in asthma exacerbations or relationships between long-term variation in air pollutants and asthma exacerbations due to limitations associated with the study design itself. Thus, this study could not determine the effects of low temperature and high air pollution in winter on asthma. However, our data suggested that the differences in daily wind speed and relative humidity were associated with the risk of asthma exacerbations. Moreover, this result remained after adjusting for individual factors such as age, smoking, physical status, and the day of the week. Secondly, sample size was small as a 6-year collection. Asthma ED visits have usually been defined as diagnosis of asthma at ED in most of previous studies112231 but asthma ED visits in this study was more strictly defined as diagnosis of asthma at ED and use of salbutamol which is only beta-agonist for nebulizer used in the enrolled hospitals and regarded as primary and essential treatments for asthma exacerbations. In addition, it is very easy to access local clinics in Chuncheon, so many patients might have reliver medications for thier symptoms and could visit daytime out-patient clinics just after worsening of their symptoms. However we used case-crossover model with strictly defined cases using 1-week interval control matching within each subject that could adjust most of complex confounders including the day of week. Third, there are pitfalls in interpreting the relationship between ED visits and meteorological data or the levels of air pollutants on lag 0 day. ED visits on lag 0 day cannot be regarded as the result of exposure to daily mean values for the outdoor environment on lag 0 day because the patients visited the ED in the middle of lag 0 day.
CONCLUSIONS
This case-crossover study demonstrated that high wind speed and low humidity were associated with an increased risk of asthma ED visits, and that fog was associated with a decreased risk of asthma ED visits. This study provides new evidence suggesting that high wind speed and low humidity are associated with an increased risk of asthma exacerbations after adjusting for seasonal variation in weather and air pollution levels, and wind speed and humidity exerted a greater effect on asthma exacerbations than air pollutants after controlling for seasonal variations in Chuncheon.
 XML Download