

 PDF
PDF ePub
ePub Citation
 Print
Print


Abstract
The purpose of this study was to evaluate trends in the sources of dietary sodium intake in a representative Korean population in the Korea National Health and Nutrition Examination Survey (KNHANES) conducted in 1998, 2001, 2005, 2007, 2008, 2009, and 2010. The study consisted of 53,570 men and women aged 7 years or older participating in the KNHANES during the corresponding years. Overall sodium intake and the mean percent contribution of each dish and food group to dietary sodium intake across 1998-2010 were calculated. The means of sodium intake ranged between 4,572.6-5,498.9 mg/d across 1998-2010. The major dish groups contributing to dietary sodium intake were kimchi (1,154.8-1,521.2 mg/d), noodles and dumplings (505.3-760.5 mg/d), soups (465.3-714.8 mg/d), and stews and casseroles (387.0-579.8 mg/d). The combined mean percent contribution from the top four dish groups contributing to dietary sodium intake showed a slight decrease over the period; 64.4% in 1998, 64.5% in 2001, 59.3% in 2005, 58.2% in 2007, 56.3% in 2008, 56.7% in 2009, and 54.4% in 2010. The major food groups contributing to dietary sodium intake were seasonings (1,852.9-2,435.9 mg/d), vegetables (1,425.6-1,792.1 mg/d), grains (482.2-778.1 mg/d), and fish and shellfish (257.2-351.4 mg/d). In addition, the combined mean percent contribution from the top four food groups showed a slight decrease over the period; 92.8% in 1998, 93.2% in 2001, 93.8% in 2005, 92.1% in 2007, 91.7% in 2008, 90.9% in 2009, and 90.7% in 2010. In summary, we did not observe a reduction in dietary sodium intake over time, however, the percent contributions from the top major dish groups or food groups to dietary sodium intake showed a decrease over the last decade.
Figures and Tables
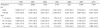
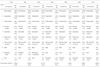
Table 2
Mean intake and percent recommended daily intake of dietary sodium among participants by sex and age, KNHANES 1998-2010
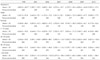
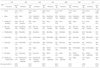
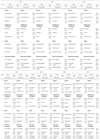
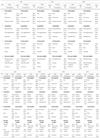
Table 4
Major sources of the top four dish groups contributing to dietary sodium intake by sex, KNHANES 1998-2010
References
1. Kearney PM, Whelton M, Reynolds K, Muntner P, Whelton PK, He J. Global burden of hypertension: analysis of worldwide data. Lancet. 2005; 365(9455):217–223.

2. Korea Centers for Disease Control and Prevention. Korea National Health Statistics 2009 - The 4th Korea National Health and Nutrition Examination Survey (KNHANES IV). 2009. Cheongwon: Korea Centers for Disease Control and Prevention.
3. Egan BM, Zhao Y, Axon RN. US trends in prevalence, awareness, treatment, and control of hypertension, 1988-2008. JAMA. 2010; 303(20):2043–2050.
4. Kannel WB. Blood pressure as a cardiovascular risk factor: prevention and treatment. JAMA. 1996; 275(20):1571–1576.
5. Stamler J, Stamler R, Neaton JD. Blood pressure, systolic and diastolic, and cardiovascular risks. US population data. Arch Intern Med. 1993; 153(5):598–615.
6. Sowers JR, Epstein M, Frohlich ED. Diabetes, hypertension, and cardiovascular disease: an update. Hypertension. 2001; 37(4):1053–1059.
7. World Health Organization. The global burden of disease: 2004 update. 2008. Geneva: World Health Organization.
8. Statistics Korea. The annual report on the cause of death statistics. 2011. Daejeon: Statistics Korea.
9. Strazzullo P, D'Elia L, Kandala NB, Cappuccio FP. Salt intake, stroke, and cardiovascular disease: meta-analysis of prospective studies. BMJ. 2009; 339:b4567.
10. Blaustein MP. How salt causes hypertension: the natriuretic hormone-Na/Ca exchange--hypertension hypothesis. Klin Wochenschr. 1985; 63:Suppl 3. 82–85.
11. He FJ, MacGregor GA. A comprehensive review on salt and health and current experience of worldwide salt reduction programmes. J Hum Hypertens. 2009; 23(6):363–384.
12. Son SM, Huh GY, Lee HS. Development and evaluation of validity of dish frequency questionnaire (DFQ) and short DFQ using Na Index for estimation of habitual sodium intake. Korean J Community Nutr. 2005; 10(5):677–692.
13. Im JH, Yoon JS. A semi-quantitative frequency method for habitual Na intake in adult population. J Living Sci Res. 1994; 20:1–9.
14. Yon M, Lee Y, Kim D, Lee J, Koh E, Nam E, Shin H, Kang BW, Kim JW, Heo S, Cho HY, Kim CI. Major sources of sodium intake of the Korean population at prepared dish level - based on the KNHANES 2008 & 2009 -. Korean J Community Nutr. 2011; 16(4):473–487.
15. Oh K, Lee J, Lee B, Kweon S, Lee Y, Kim Y. Plan and operation of the 4th Korea National Health and Nutrition Examination Survey (KNHANES IV). Korean J Epidemiol. 2007; 29(2):139–145.
16. Korea Centers for Disease Control and Prevention. Korea National Health Statistics - KNHANES. 2010. Cheongwon: Korea Centers for Disease Control and Prevention.
17. Korea Health Industry Development Institute. The Third Korea National Health & Nutrition Examination Survey (KNHANES III), 2005 - Nutrition Survey (I). 2006. Cheongwon: Korea Health Industry Development Institute.
18. Korea Health Industry Development Institute. 2001 National Health and Nutrition Survey-Nutrition Survey. 2002. Cheongwon: Korea Health Industry Development Institute.
19. Korea Health Industry Development Institute. Report on 1998 National Health and Nutrition Survey(dietary intake survey). 1999. Cheongwon: Korea Health Industry Development Institute.
20. The Korean Nutrition Society. Dietary reference intakes for Koreans, 1st revision. 2010. Seoul: The Korean Nutrition Society;p. 367.
21. Son SM, Park YS, Lim HJ, Kim SB, Jeong YS. Sodium intakes of Korean adults with 24-hour urine analysis and dish frequency questionnaire and comparison of sodium intakes according to the regional area and dish group. Korean J Community Nutr. 2007; 12(5):545–558.
22. Yu KW, Hwang JH. Fermentative characteristics of low-sodium kimchi prepared with salt replacement. Korean J Food Nutr. 2011; 24(4):753–760.
23. Chang SO. The amount of sodium in the processed foods, the use of sodium information on the nutrition label and the acceptance of sodium reduced Ramen in the female college students. Korean J Nutr. 2006; 39(6):585–591.
24. Shin AG, Lee YK, Jung YK, Kim SD. Quality and storage characteristics of low salted onion and five cereals-Doenjang. Korean J Food Preserv. 2008; 15(2):174–184.
25. Lee JY, Mok C. Changes in physicochemical properties of low salt soybean paste (Doenjang) during fermentation. Food Eng Prog. 2010; 14(2):153–158.
26. Lee JO, Ryu CH. Preparation of low salt Doenjang using by Nisin-producing lactic acid bacteria. J Korean Soc Food Sci Nutr. 2002; 31(1):75–80.
27. Lim SI, Song SM. Fermentation properties of low-salted Doenjang supplemented with licorice, mustard, and chitosan. Korean J Food Sci Technol. 2010; 42(3):323–328.
28. Anderson CA, Appel LJ, Okuda N, Brown IJ, Chan Q, Zhao L, Ueshima H, Kesteloot H, Miura K, Curb JD, Yoshita K, Elliott P, Yamamoto ME, Stamler J. Dietary sources of sodium in China, Japan, the United Kingdom, and the United States, women and men aged 40 to 59 years: the INTERMAP study. J Am Diet Assoc. 2010; 110(5):736–745.
29. Kim HJ, Paik HY, Lee SY, Shim JE, Kim YS. Salt usage behaviors are related to urinary sodium excretion in normotensive Korean adults. Asia Pac J Clin Nutr. 2007; 16(1):122–128.
30. Oh BH. A study of utilization of Korean Jeot-Kals of housewives in Seoul area. J Hotel Resort. 2009; 8(2):155–169.
31. Kim JE, Kim JH, Jung IK. Perception and utilization of salted seafood in Korean women. J Korean Home Econ Assoc. 2009; 47(6):11–20.
32. Kim YM, Jeong YM, Hong JH. Processing conditions for low-salted squid Jeotkal. Bull Korean Fish Soc. 1993; 26(4):312–320.
33. Han JS, Cho HR, Cho HS. Study for the establishment of the quality index of low-salted Myungran-Jeot. Korean J Food Cookery Sci. 2005; 21(4):440–446.
34. Park SM, Park CK, Lee KT, Kim SM. Changes in taste compound of low salt fermented pollack tripe during controlled freezing point aging. Korean J Food Sci Technol. 1998; 30(1):49–53.
35. Shin EK, Lee HJ, Jun SY, Park EJ, Jung YY, Ahn MY, Lee YK. Development and evaluation of nutrition education program for sodium reduction in foodservice operations. Korean J Community Nutr. 2008; 13(2):216–227.
36. Kim HY. Activation of nutrition labeling in food and restaurant industry for sodium reduction. Food Sci Ind. 2011; 44(1):28–38.
37. Korea Food and Drug Administration [Internet]. Seven out of ten workers need to reduce sodium intake. 2012. 01. cited 2012 Jul 23. Cheongwon: Korea Food and Drug Administration;Available from: http://www.kfda.go.kr/index.kfda?mid=55&pageNo=21&seq=16987&cmd=v.
38. Willett W. Nutritional epidemiology. 1990. New York: Oxford University Press.
 XML Download