

 PDF
PDF ePub
ePub Citation
 Print
Print


Abstract
Nutritional researchers world-wide are using large-scale sample survey methods to study nutritional health epidemiology and services utilization in general, non-clinical populations. This article provides a review of important statistical methods and software that apply to descriptive and multivariate analysis of data collected in sample surveys, such as national health and nutrition examination survey. A comparative data analysis of the Korea National Health and Nutrition Examination Survey (KNHANES) was used to illustrate analytical procedures and design effects for survey estimates of population statistics, model parameters, and test statistics. This article focused on the following points, method of approach to analyze of the sample survey data, right software tools available to perform these analyses, and correct survey analysis methods important to interpretation of survey data. It addresses the question of approaches to analysis of complex sample survey data. The latest developments in software tools for analysis of complex sample survey data are covered, and empirical examples are presented that illustrate the impact of survey sample design effects on the parameter estimates, test statistics, and significance probabilities (p values) for univariate and multivariate analyses.
Figures and Tables
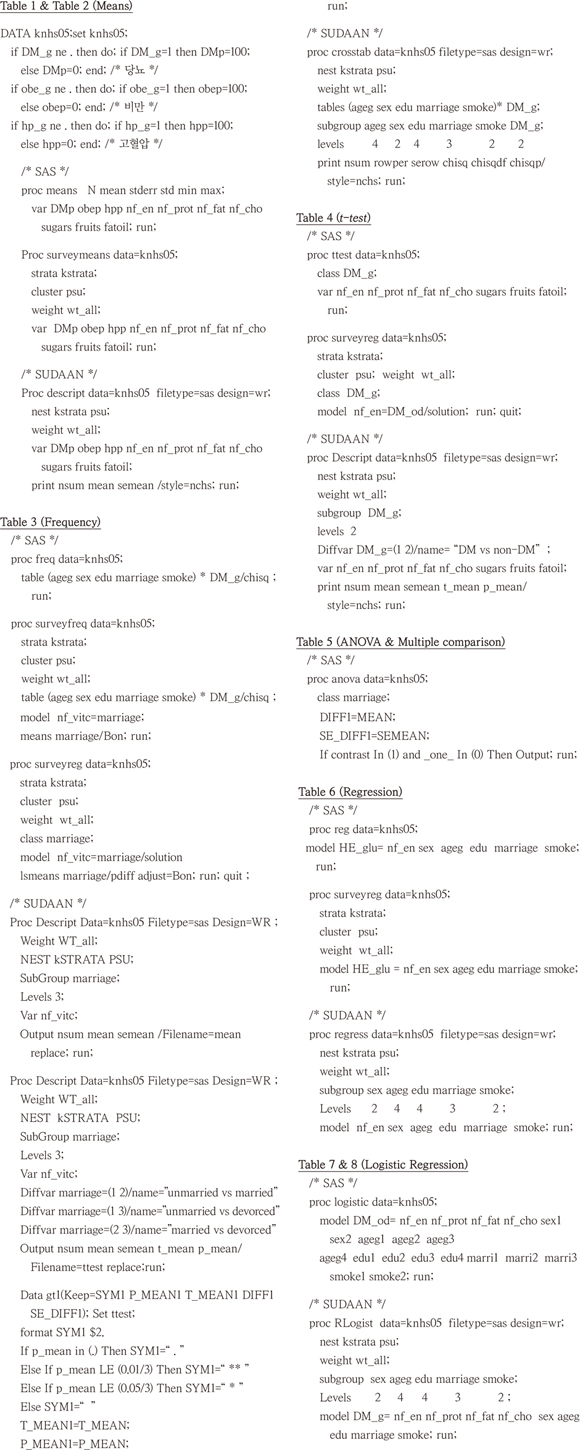
Table 1
Design effects for survey estimates of percentage of diseased population aged over 20, data from the KNHANES 2005
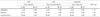
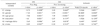
Table 2
Design effects for survey estimates of means of nutrients and foods consumption aged over 20, data from the KNHANES 2005
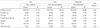
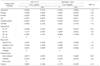
Table 3
Design effects for survey estimates of test statistics and p values from Chi-square tests between diabetes and socioeconomic variables aged over 20, data from the KNHANES 2005
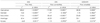
Table 4
Effect of weighting and sample design on test statistics (t) and p values by t-test for Diabetes and Non-Diabetes over 20 year, data from the KNHANES 2005
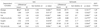
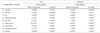
Table 5
Effect of sample design on Bonferroni's multiple comparison of Vitamin C consumption by marrital status aged over 201), data from the KNHANES 2005
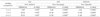
Table 6
Effect of weighting and sample design on test statistics and P values from multiple regression model of blood glucose aged over 20, data from the KNHANES 2005
References
1. Ministry of Health and Welfare. Korea National Health and Nutrition Examination Survey. Seoul: Ministry of Health and Welfare;Available from: http://knhanes.cdc.go.kr.
2. Heeringa SG, Liu J. Complex sample design effects and inference for mental health survey data. Int J Methods Psychiatr Res. 1998. 7(1):56–65.

3. Muthén BO, Satorra A. Complex sample data in structural equation modeling. Sociol Methodol. 1995. 25:267–316.
4. Koch GG, Lemeshow S. An application of multivariate analysis to complex sample survey data. Institute of Statistics Mimeo Series No. 802. 1972. Chapel Hill: University of North Carolina.
5. Chung CE. Evaluation of statistical methodology in national journals related with food science, cooking, and food culture. 2010. Seoul: Youlchon Foundation;591–703.
6. SAS version 9.3. 2011. Cary: SAS Institute Inc.;Available from: http://www.sas.com.
7. SPSS. 2012. Armonk: IBM;Available from: http://www.spss.com.
8. SUDAAN version 11. 2011. Research Triangle Park: RTI International.
9. Kish L, Groves RM, Krotki KP. World fertility survey. Sampling errors for fertility surveys. Occasional Paper, No. 17. 1975. Voorburg: International Statistical Institute.
10. Agresti A. Categorical data analysis. 2002. 2nd edition. New York: John Wiley & Sons.
11. Agresti A. An introduction to categorical data analysis. 2007. 2nd edition. New York: John Wiley & Sons.
12. Lee JH, Moon IO, Chung CE. Health statistics. 2008. Seoul: Power Book Co..
13. Roberts G, Rao JNK, Kumar S. Logistic regression analysis of sample survey data. Biometrika. 1987. 74(1):1–12.
14. Morel JG. Logistic regression under complex survey designs. Surv Methodol. 1989. 15:203–223.
15. Hosmer DW Jr, Lemeshow S. Applied logistic regression. 2000. 2nd edition. New York: John Wiley & Sons.
16. Cochran WG. Sampling techniques. 1977. New York: John Wiley & Sons.
17. Skinner CJ, Holt D, Smith TMF. Analysis of complex surveys. 1989. New York: John Wiley & Sons.
18. Särndal CE, Swensson B, Wretman J. Model assisted survey sampling. 1992. New York: Springer.
19. Binder DA, Roberts GR. Design-based and model-based methods for estimating model parameters. Analysis of Survey Data. 2003. New York: John Wiley & Sons.
20. Fuller WA. Sampling statistics. 2009. Hoboken: John Wiley & Sons.
21. Lohr SL. Sampling: design and analysis. 2010. 2nd edition. Boston: Brooks/Cole.
22. Kish L. Survey sampling. 1965. New York: John Wiley & Sons.
23. Goldstein H. Multi-level models in educational and social research. 1987. London: Oxford University Press.
24. Rust K. Variance estimation for complex estimators in sample surveys. J Off Stat. 1985. 1(4):381–397.
25. Wolter KM. Introduction to variance estimation. 1985. New York: Springer.
26. Woodruff RS. A simple method for approximating the variance of a complicated estimate. J Am Stat Assoc. 1971. 66(334):411–414.
27. Kish L, Frankel MR. Balanced repeated replications for standard errors. J Am Stat Assoc. 1970. 65(331):1071–1094.
28. Rao JNK, Shao J. Modified balanced repeated replication for complex survey data. Biometrika. 1999. 86(2):403–415.
29. Rao JNK, Wu CFJ. Resampling inference with complex survey data. J Am Stat Assoc. 1988. 83(401):231–241.
30. Rao JNK, Wu CFJ, Yue K. Some recent work on resampling methods for complex surveys. Surv Methodol. 1992. 18:209–217.
31. Williams RL. A note on robust variance estimation for cluster-correlated data. Biometrics. 2000. 56(2):645–646.
32. Wolter KM. Introduction to variance estimation. 2007. 2nd edition. New York: Springer.
33. Stata Corp. Stata statistical software: release 5. 1997. College Station: Stata Corp..
34. Brick JM, Broene P, James P, Severynse J. A user's guide to Wes-Var PC. 1996. Rockville: Westat Inc..
 XML Download