

 PDF
PDF ePub
ePub Citation
 Print
Print


Abstract
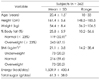
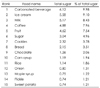
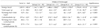
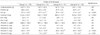
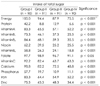
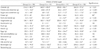
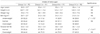
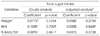
This study investigated the relationship between total sugar intake and obesity indices in 362 female university students. This study was conducted using an anthropometric checkup and 3-day dietary records. Subjects were categorized according to the total sugar intake as < 33.3 g (group I, n = 90), 33.3-56.1 g (group II, n = 91), 56.1-83.8 g (group III, n = 91), ≥ 83.8 g (group IV, n = 90). No significant differences in age, weight, height, body mass index (BMI), or the percentage of body fat were observed among the four groups. Based on BMI, 20.2% were overweight, and the percentage of body fat was > 30% in 67.1% of all students sampled. Energy intake in each groups was 1,164.7 kcal, 1,488.6 kcal, 1,590.0 kcal, and 1795.8 kcal, respectively (p < 0.001). Total sugar intake in the groups was 20.5 g, 44.6 g, 68.3 g, and 111.8 g, respectively (p < 0.001). Carbonated beverages were identified as the most significant food source for total sugar intake in female university students. The next major foods were ice cream, milk, coffee, fruit, sugar, cookies, bread, chocolate, corn syrup, rice, onion, maple syrup, pickle, and sweet potato. As intake of total sugar increased, intake of energy also increased significantly. Mean daily intakes of fat and calcium/1,000 kcal were significantly higher in group IV than those in the other groups. Mean daily intakes of vitamin C and vitamin E/1,000 kcal were significantly higher in group III than those in the other groups. The percentage of subjects who consumed nutrients below the estimated average requirement was less in the higher total sugar intake group than that in the lower intake group. The obesity indices (weight, BMI, % body fat) were not associated with total sugar intake in the subjects. We conclude that total sugar intake does not seem to influence obesity indices in female university students.
Figures and Tables
References
1. Chung CE. Dietary intakes and food sources of total sugars from Korean national health and nutrition examination survey 2001-2002. Korean J Nutr. 2007. 40:Suppl. 9–21.
2. Cho S, Kim WK. Sugar intakes and metabolic syndrome. Korean J Nutr. 2007. 40:Suppl. 39–49.
3. Chung CE. Association of total sugar intakes and metabolic syndrome from Korean national health and nutrition examination survey 2001-2002. Korean J Nutr. 2007. 40:Suppl. 29–38.
4. Havel PJ. Dietary fructose: implications for dysregulation of energy homeostasis and lipid/carbohydrate metabolism. Nutr Rev. 2005. 63(5):133–157.

5. Bantle JP, Raatz SK, Thomas W, Georgopoulos A. Effects of dietary fructose on plasma lipids in healthy subjects. Am J Clin Nutr. 2000. 72(5):1128–1134.
6. Lee RD, Nieman DC. Nutritional assessment. 1996. 2nd ed. St. Louis: Mosby.
7. Korean Society for the Study of Obesity. Diagnosis and therapy of obesity: the Asia-Pacific area guideline. 2000. Seoul:
8. Putnam J, Allshouse J, Scott Kantor L. U.S. per capita food supply trends: more calories, refined carbohydrates, and fats. Food Rev. 2002. 25(3):2–15.
9. Chun OK, Chung CE, Wang Y, Padgitt A, Song WO. Changes in intakes of total and added sugar and their contribution to energy intake in the U.S. Nutrients. 2010. 2(8):834–854.
10. Krebs-Smith SM. Choose beverages and foods to moderate your intake of sugars: measurement requires quantification. J Nutr. 2001. 131(2S-1):527S–535S.
11. Johnson RK, Frary C. Choose beverages and foods to moderate your intake of sugars: the 2000 dietary guidelines for Americans--what's all the fuss about? J Nutr. 2001. 131(10):2766S–2771S.
12. Kim HJ, Oh HM, Cho YJ, Yoon JS. Relationships between nutrient intake status and sugar-containing food intake of elementary school students in Daegu-Kyungbook area. Korean J Community Nutr. 2010. 15(5):573–581.
13. Vermunt SH, Pasman WJ, Schaafsma G, Kardinaal AF. Effects of sugar intake on body weight: a review. Obes Rev. 2003. 4(2):91–99.
14. Kant AK. Consumption of energy-dense, nutrient-poor foods by adult Americans: nutritional and health implications. The third National Health and Nutrition Examination Survey, 1988-1994. Am J Clin Nutr. 2000. 72(4):929–936.
15. Teff KL, Elliott SS, Tschöp M, Kieffer TJ, Rader D, Heiman M, Townsend RR, Keim NL, D'Alessio D, Havel PJ. Dietary fructose reduces circulating insulin and leptin, attenuates postprandial suppression of ghrelin, and increases triglycerides in women. J Clin Endocrinol Metab. 2004. 89(6):2963–2972.
16. Welsh JA, Sharma A, Cunningham SA, Vos MB. Consumption of added sugars and indicators of cardiovascular disease risk among US adolescents. Circulation. 2011. 123(3):249–257.
17. Gibson SA. Non-milk extrinsic sugars in the diets of pre-school children: association with intakes of micronutrients, energy, fat and NSP. Br J Nutr. 1997. 78(3):367–378.
18. O'Neil CE, Fulgoni VL 3rd, Nicklas TA. Association of candy consumption with body weight measures, other health risk factors for cardiovascular disease, and diet quality in US children and adolescents: NHANES 1999-2004. Food Nutr Res. 2011. 55:doi: 10.3402/fnr.v55i0.5794.
19. Forshee RA, Anderson PA, Storey ML. The role of beverage consumption, physical activity, sedentary behavior, and demographics on body mass index of adolescents. Int J Food Sci Nutr. 2004. 55(6):463–478.
20. Hill JO, Prentice AM. Sugar and body weight regulation. Am J Clin Nutr. 1995. 62:1 Suppl. 264S–273S.
 XML Download