

 PDF
PDF ePub
ePub Citation
 Print
Print


Abstract
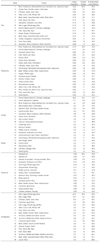
This study aimed to reanalyze energy and nutrient intakes of 2007 Korean Nutrition and Health Examination Survey (KNHANES) using CAN-Pro 3.0, a commonly used nutrient analysis software in Korea. Food items and their codes were selected from 2007 KNHANES dietary intake file and converted to food codes of CAN-Pro 3.0 nutrient database (NDB). Of the 1,324 total food items, 1,155 items were converted by direct matching, 123 items were matched using other items in CAN-Pro 3.0 NDB and 42 items were matched using external sources. Consumption frequencies of items converted by direct matching contributed 94.5% of total consumption. Nutrient intakes of 4,091 participants of 2007 KNHANES, over 1 year old, were recalculated using CAN-Pro 3.0 NDB and compared with intakes in 2007 KNHANES dietary intake file. Intakes for energy and all nutrients except protein and Vitamin C calculated by two NDBs were significantly different by paired t-test (p < 0.001), but significantly correlated by Pearson' correlation coefficients (p < 0.001). Percent differences between the NDBs ranged from 0.3% to 15.1%, low for protein, energy, vitamin C, iron, vitamin B2 (below 5%) but high for phosphorus, retinol, vitamin A, and β-carotene (over 10%). Age group, sex, and their interactions significantly influenced six nutrients (p < 0.05). Intake levels of zinc, vitamin B6, vitamin E, folate and cholesterol were not available in 2007 KNHANES but were calculated by CAN-Pro 3.0. Mean intake levels of zinc, vitamin B6, vitamin E, and folate by age and sex groups revealed that some groups had mean levels below RI (Recommended Intake) or AI (Adequate Intake) levels. Intake level of cholesterol was higher than the recommended level (below 300 mg/day) in some groups, especially males. Results of the present study indicate the need for comparable and more comprehensive NDB to be used for dietary assessment of KNHANES and other researches. More rigorous evaluation of nutrients which have not been reported in KNHANES is needed.
Figures and Tables


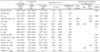
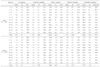
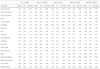
Table 4
Mean (SE) intake of energy and nutrients by age group and sex in 2007 KNHANES from KNHANES (A) and CAN-Pro 3.0 NDB (B)
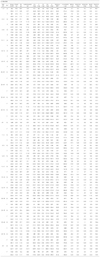
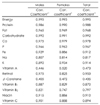
Table 5
Pearson's correlation coefficient for nutrient intakes of 2007 KNHANES subjects between KNHANES and CAN-Pro 3.0 NDB
References
1. Bazzano LA, He Jiang, Ogden LG, Loria CM, Vupputuri S, Myers L, Whelton PK. Agreement on Nutrient Intake between the Databases of the First National Health and Nutrition Examination Survey and the ESHA Food Processor. Am J Epidemiol. 2002. 156:78–85.

2. Matsuda-Inoguch N, Nakatsuka H, Watanabe T, Shimbo S, Higashikawaw K, Ikeda M. Estimation of Nutrient intake by the new version of Japanese food composition tables in comparison with that the previous version. Tohoku J Exp Med. 2001. 194:229–239.
3. Vaask S, Pomerleau J, Pudule I, Grinberga D, Abaravicius A, Robertson A, McKee M. Comparison of the Micro-Nutrica Nutritional Analysis program and the Russian Food Composition Database using data from the Baltic Nutrition Surveys. Eur J Clin Nutr. 2004. 58:573–579.
4. Hyun TS, Han YH. Comparison of Folate intake and food sources in College students using the 6th vs. 7th nutrient database. Korean J Nutr. 2001. 34(7):797–808.
5. Korea Centers for Disease Control and Prevention. The Fourth Korea National Health and Nutrition Examination Survey (KNHANES IV). 2009. Seoul:
6. The Korean Nutrition Society. CAN-Pro 3.0 software. 2005.
7. Shim YJ. Reanalysis of 2007 Korean National Health and Nutrition Examination Survey (2007 KNHANES) results by CANPRO 3.0 Nutrient Database [thesis]. 2009. Seoul: Seoul Nationl University;.
8. Paik HY, Kim KC, Kim YO, Kim JS, Moon HK, Oh SY, Lee SY, Lee SY, Joung HJ, Dwyer J. Health and nutrition survey of Koreans. 1997. Seoul: Publishing department of Seoul National University;302–304.
9. Schakel SF, Sievert YA, Buzzard IM. Sources of data for developing and maintaining a nutrient database. J Am Diet Assoc. 1998. 88:1269.
10. National Fisheries Research Development Institute (NFRDI) portal. Available from : http://nfrdi.re.kr.
11. Korea Biodiversity information system. Available from: http://www.nature.go.kr.
12. Merchant AT, Dehghan M. Food composition database development for between country comparisons. Nutr J. 2006. 5:2–10.
13. USDA National Nutrient Database for Standard Reference 21. Available from : http://www.nal.usda.gov/fnic/foodcomp/search/.
14. The Korean Nutrition Society. Korean Dietary Reference Intake. 2005. Seoul: Sidaegihoek.
15. Advance Data No. 341. Dietary Intake of Selected Minerals for the United States Population: 1999-2000. National Center for Health Statistics. 2004. Available from : http://www.cdc.gov/nchs/about/major/nhanes.
16. Advance Data No. 339. Dietary Intake of Selected Vitamins for the United States Population: 1999-2000. National Center for Health Statistics. 2004. Available from : http://www.cdc.gov/nchs/about/major/nhanes.
17. Kim YS, Kim KN, Chang NS. Dietary folate intake of Korean Women of childbearing age. Korean J Nutr. 1999. 32(5):585–591.
18. Ahn HS, Jeong EY, Kim SY. Studied on plasma homocysteine concentration and national status of vitamin B6, B12, and folate in college women. Korean J Nutr. 2002. 35(1):37–44.
19. Kondo A, Kamihira O, Shimosuka Y, Okai I, Gotoh M, Ozawa H. Awareness of the role of folic acid, dietary folate intake and plasma folate concentration in Japan. J Obstet Gynaecol Res. 2005. 31(2):172–177.
20. Zhao Y, Hao L, Zhang L, Tian Y, Cao Y, Xia H, Deng Y, Wang T, Yu M, Li Z. Plasma folate status and dietary folate intake among Chinese women of childbearing age. Matern Child Nutr. 2009. 5(2):104–116.
21. Brussaard JH, Lowik MR, van den Berg H, Brants HA, Goldbohm RA. Folate intake and status among adults in the Netherlands. Eur J Clin Nutr. 1997. 51:Suppl 3. S46–S50.
22. Shuaibi AM, House JD, Sevenhuysen GP. Folate Status of Young Canadian Women after Folic Acid Fortification of Grain Products. J Am Diet Assoc. 2008. 108(12):2090–2094.
23. Sauberlich HE, Kretsch MJ, Skala JH, Johnson HL, Taylor PC. Folate requirement and metabolism in nonpregnant women. Am J Clin Nutr. 1987. 46:1016–1028.
24. Min HS. Changes of Folate Content in Spinach by Cooking and Storage-The Comparisons of Thermal Destruction and Loss of Folate into Cooking Water by Blanching Time of Spinach. J Korean Soc Food Sci Nutr. 1998. 27(2):286–290.
25. Food and Nutrition Board. Institute of Medicine. Dietary Reference Intake for Energy, Carbohydrate, Fiber, Fat, Fatty Acids, Cholesterol, Protein, and Amino Acids. 2002. National Academies.
26. Advance Data No. 348. Dietary Intake of Fats and Fatty Acids for the United States Population: 1999-2000. National Center for Health Statistics. 2004. Available from: http://www.cdc.gov/nchs/about/major/nhanes.
27. Choi MK, Kim HS, Lee WY, Lee HM, Ze KR, Park JD. Comparative evaluation of dietary intakes of calcium, phosphorus, iron, and zinc in rural, coastal, and urban district. J Korean Soc Food Sci Nutr. 2005. 34(5):659–666.
28. Lee JY, Paik HY, Joung HJ. Supplementation of zinc nutrient database and evaluation of zinc intake of Korean adults living in rural area. Korean J Nutr. 1998. 31:1324–1337.
29. Cho YO, Yun MK. Estimation of Vitamin B6 Intake and Mjor Dietary Sources of Vitamin B6 in Elderly Korean in Seoul Area. J Food Sci Nutr. 2007. 9:85–91.
30. Cho YO, Kim YN. Dietary intake and major dietary sources of vitamin B6. J Food Sci Nutr. 2001. 4(1):20–25.
31. Jin HO, Lim HS. Major Foods for Folate and Their Folate Contents of Korean Child-bearing Women. J Korean Soc Food Sci Nutr. 2001. 30(1):152–158.
32. Hyun TS, Han UH. Comparison of Folate Intake and Food Sources in College Students Using the 6th vs. 7th Nutrient Database. Korean J Nutr. 2001. 34(7):797–808.
33. Choi HM, Kim JH, Jang KJ, Min HS, Yim KS, Byun KW, Lee HM, Kim JW, Kim HS, Kim HA. Essentials of Nutrtion. 2000. Kyomunsa.
34. Kim KN, Son MH, Kim MS. Consumption of dietary fats and anti-oxidant vitamins among college student in Cheongju city. J Hum Ecol. 2005. 9(1):205–218.
35. Han DN, Cho JS, Hong EJ, Shin ES, Park HS. A survey on the amount and sources of cholesterol intake in the comprehensive health chekup attendees. J Korean Acad Med. 1995. 16(9):630–635.
36. Choi YS, Kwak IS, Lee KA, Lee SY. Annual Changes in Cholesterol Intake and Serum Cholesterol Level of Korean from 1962 to 1995 Year. J Korean Soc Food Sci Nutr. 1999. 28(2):484–491.
37. Kim EY, Kim YN. A study on revision direction of Korean food composition table through international comparision. Korean J Nutr. 1994. 27(2):192–206.
 XML Download