

 PDF
PDF ePub
ePub Citation
 Print
Print


Abstract
Korean diet is high in plant foods but also high in salted vegetables. World Cancer Research Fund (WCRF) recommends consumption of fruits and vegetables excluding salted vegetables for prevention cancer. This study aimed to analyze relations between intakes of salted and non-salted vegetables and socioeconomic factors, providing a data for targeted groups in promotion of fruits and vegetables consumption. Dietary and socioeconomic status data of the 5,400 subjects over 30 years of age from the 2005 Korea National Health and Nutrition Examination Survey (KNHANESIII) were used. Dietary intake data from KNHANESIII was obtained by one day 24-hour recall method. Mean daily intakes of salted vegetables, non-salted vegetables and fruits of subjects were 151 g, 237 g, and 71 g respectively. Mean daily intake of salted vegetables was significantly higher in men than women for daily amount (173 g vs. 133 g) as well as percentage of total food intake (9.9% vs. 9.6%). Subjects living in rural area consumed more salted vegetables. Salted vegetables as percent of total food were lower in subjects with higher education levels (p < 0.001). Intakes of non-salted vegetables were significantly affected by age and gender. Intake levels of fruit were significantly higher in younger groups, in females, and subjects with higher income and education levels (p < 0.05). Average intake of fruits and non-salted vegetables was 307 g, lower than WCRF recommended level of 400 g for personal guideline. Intake of salted vegetables was positively correlated with sodium intake (Pearson's correlation coefficient, r = 0.43) but less so with potassium (r = 0.16) and other micronutrients intake (r < 0.1). On the other hand, non-salted vegetables had higher correlations with potassium (r = 0.45), carotene (r = 0.38), vitamin A (r = 0.37), iron (r = 0.34) and low for sodium (r = 0.13). Fruits intake was highly correlated with vitamin C intake (r = 0.46). Proportion of subjects satisfying WCRF personal guideline of fruits and non-salted vegetables was 25.7%. Results of this study indicate that intake of salted vegetable is considerably high among Koreans, and it is highly correlated with sodium intake and less so with other micronutrients.
Figures and Tables
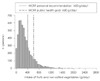
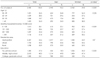
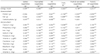
Table 2
Fruits and vegetables intake by socioeconomics status (g/day)
1) Non-salted vegetables contain green vegetables, mushrooms and seaweeds except for tomato juice and salted vegetables
2) Fruits except for fruit juice
3) Standard error
4) All the p values were calculated after adjusted for marital status, total food intake, total energy intake and all other socioeconomic variables in the table by ANCOVA
5) Non-significant
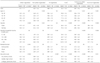
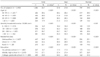
Table 3
Proportions of fruits and vegetables to total food intake by socioeconomic status (%)
1) Non-salted vegetables contain green vegetables, mushrooms and seaweeds except for tomato juice and salted vegetables
2) Fruits except for fruit juice
3) Standard error
4) All the p values were calculated after adjusted for marital status, total food intake, total energy intake and all other socioeconomic variables in the table by ANCOVA
5) Non-significant
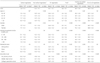
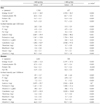
Table 4
Pearson's correlation coefficients of fruits & vegetables intake with energy and nutrients intake1)
References
1. The Third Korea National Health and Nutrition Examination Survey (KN-HANESIII). 2006. Korea Centers for Disease Control and Prevention.
2. Korea National Statistical Office. Available from; http://www.kosis.kr.
3. Lichtenstein AH, Appel LJ, Brands M, Carnethon M, Daniels S, Franch HA, et al. Diet and lifestyle recommendations revision 2006: A Scientific Statement from the American Heart Association Nutrition Committee. Circulation. 2006. 114:82–96.
4. Summary: Food, nutrition, physical activity, and the prevention of cancer: a global perspective. 2007. World Cancer Research Fund. American Institute for Cancer Research;9.
5. Ibiebele TI, Pols IC, Hughes MC, Marks GC, Williams GM, Green AC. Dietary pattern in association with squamous cell carcinoma of the skin: a prospective study. Am J Clin Nutr. 2007. 85:1401–1408.

6. Choi MK, Bae YJ. A study on blood lipids and blood pressure of adult men and women according to vegetable intake. Korean J Community Nutrition. 2007. 12(6):761–722.
7. Hung HC, Joshipura KJ, Jiang R, Hu FB, Hunter D, Smith-Warner SA, et al. Fruit and vegetable intake and risk of major chronic disease. J Natl Cancer Inst. 2004. 96(21):1577–1584.
8. Nöthlings U, Schulze MB, Weikert C, Boeing H, Schouw YT, Bamia C, et al. Intake of vegetables, legumes, and fruit, and risk for all-cause, cardiovascular, and cancer mortality in a European diabetic population. J Nutr. 2008. 138(4):775–781.
9. Serdula MK, Gillespie C, Kettel-Khan L, Farris R, Seymour J, Denny C. Trends in fruits and vegetable consumption among adults in the united states: Behavioral risk factor surveillance system, 1994-2000. Am J Public Health. 2004. 94:1014–1018.
10. Riediger ND, Shooshtari S, Moghadasian MH. The influence of sociodemographic factors on patterns of fruit and vegetable consumption in Canadian adolescents. J Am Diet Assoc. 2007. 107:1511–1518.
11. Taylor JP, Evers S, Mckenna M. Determinants of healthy eating in children and youth. Can J Public Health. 2005. 96:supple3. S20–S26.
12. Oliver LN, Hayes MV. Neighbourhood socio-economic status and the prevalence of overweight Canadian children and youth. Can J Public Health. 2005. 96:415–420.
13. Son SM, Park Y, Lim H, Kim S, Jeong Y. Sodium intakes of Korean adults with 24-hour urine analysis and dish frequency questionnaire and comparison of sodium intakes according to the regional area dish group. Korean J Community Nutrition. 2007. 12(5):545–558.
14. Striegel-Moore RH, Thompson D, Affenito SG, Franko DL, Obarzanek E, Barton BA, et al. Correlates of beverage intake in adolescent girls: the National Heart, Lung, and Blood Institute Growth and Health Study. J Pediatr. 2006. 148:183–187.
15. Milne DB, Nielsen FH. The interaction between dietary fructose and magnesium adversely affects macromineral homeostasis in men. J Am Coll Nutr. 2000. 19:31–37.
16. Sartorelli DS, Franco LJ, Gimeno SGA, Ferreira SRG, Cardoso MA. Dietary fructose, fruits, fruit juices and glucose tolerance status in Japanese-Brazilians. Nutr Metab Cardiovasc Dis. 2008. 19(2):77–83.
17. In-Depth Analysis on the 3rd (2005) Korea Health and Nutrition Examination Survey-NutritionSurvey-. 2007. Korea Centers for Disease Control and Prevention.
18. Moon HK, Park JH. Comparative analysis and evaluation of dietary intake between with and without hypertension using 2001 Korea National Health and Nutrition Examination Survey (KNHANES). Korean J Nutr. 2007. 40(4):347–361.
19. Umesawa M, Iso H, Date C, Yamamoto A, Toyoshima H, Watanabe Y, et al. Relation between dietary sodium and potassium intakes and mortality from cardiovascular disease: the Japan Collaborative Cohort Study for evaluation of cancer risks. Am J Clin Nutr. 2008. 88:195–202.
20. Casagrande SS, Wang Y, Anderson C, Gary TL. Have Americans increased their fruit and vegetable intake? The trends between 1988 and 2002. Am J Prev Med. 2007. 32(4):257–263.
21. Giskes K, Turrell G, Patterson C, Newman B. Socio-economic differences in fruit and vegetable among Australian adolescents and adults. Public Health Nutr. 2002. 5(5):663–669.
22. Drewnowski A, Specter SE. Poverty and obesity: the role of energy density and energy costs. Am J Clin Nutr. 2004. 79:6–16.
23. Riediger ND, Moghadasia MH. Patterns of fruit and vegetable consumption and the influence of sex, age and socio-demographic factors among Canadian elderly. J Am Coll Nutr. 2008. 27(2):306–313.
24. Paquette M. Perceptions of healthy eating: state of knowledge and research gaps. Can J Public Health. 2005. 96:supple3. S15–S19.
 XML Download