Journal List > J Nutr Health > v.51(1) > 1081562

Chung, Tong-Kyung, Kim, Kang, Lee, Chung, Kwon, Hwang, and Choi: Development of NQ-E, Nutrition Quotient for Korean elderly: item selection and validation of factor structure∗

Abstract

Purpose:

The purpose of this study was to develop a valid instrument for measuring the dietary quality and behaviors of Korean elderly.

Methods:

The development of the Nutrition Quotient for Elderly (NQ-E) was conducted in three steps: item generation, item reduction, and validation. The 41 items of the NQ-E checklist were derived from a systematic literature review, expert in-depth interviews, statistical analyses of the fifth Korean National Health and Nutrition Examination Survey data, and national nutrition policies and recommendations. Pearson's correlation was used to determine the level of agreement between the questionnaires and nutrient intake level, and 24 items were selected for a nationwide survey. A total of 1,000 nationwide elderly subjects completed the checklist questionnaire. The construct validity of the NQ-E was assessed using confirmatory factor analysis, LISREL.

Results:

The nineteen checklist items were used as final items for NQ-E. Checklist items were composed of four-factors: food behavior (6 items), balance (4 items), diversity (6 items), and moderation (3 items). The standardized path coefficients were used as the weights of the items. The NQ-E and four-factor scores were calculated according to the obtained weights of the questionnaire items.

Conclusion:

NQ-E would be a useful tool for assessing the food behavior and dietary quality of the elderly.

References

1. Ministry of Health and Welfare (KR); Korea Institute for Health and Social Affairs. A study on the living conditions and welfare needs of older Korean persons. Cheongju: Ministry of Health and Welfare;2014.
2. World Health Organization. Global action plan for the prevention and control of NCDs 2013–2020. Geneva: World Health Organization;2013.
3. Oh KW, Nam CM, Park JH, Yoon JY, Shim JS, Lee KH, Suh I. A case-control study on dietary quality and risk for coronary heart disease in Korean men. Korean J Nutr. 2003; 36(6):613–621.
4. Ko KP, Park SK, Yang JJ, Ma SH, Gwack J, Shin A, Kim YJ, Kang D, Chang SH, Shin HR, Yoo KY. Intake of soy products and other foods and gastric cancer risk: a prospective study. J Epidemiol. 2013; 23(5):337–343.
crossref
5. Park B, Shin A, Park SK, Ko KP, Ma SH, Lee EH, Gwack J, Jung EJ, Cho LY, Yang JJ, Yoo KY. Ecological study for refrigerator use, salt, vegetable, and fruit intakes, and gastric cancer. Cancer Causes Control. 2011; 22(11):1497–1502.
crossref
6. Kim HR. A study on the association of diet quality and risk of mortality and major chronic diseases from nationally representative longitudinal data. Health Soc Welf Rev. 2013; 33(3):5–30.
7. Kang MH, Lee JS, Kim HY, Kwon S, Choi YS, Chung HR, Kwak TK, Cho YH. Selecting items of a food behavior checklist for the development of nutrition quotient (NQ) for children. Korean J Nutr. 2012; 45(4):372–389.
crossref
8. Kim HY, Kwon S, Lee JS, Choi YS, Chung HR, Kwak TK, Park J, Kang MH. Development of a nutrition quotient (NQ) equation modeling for children and the evaluation of its construct validity. Korean J Nutr. 2012; 45(4):390–399.
crossref
9. Lee JS, Kang MH, Kwak TK, Chung HR, Kwon S, Kim HY, Hwang JY, Choi YS. Development of nutrition quotient for Korean preschoolers (NQ-P): item selection and validation of factor structure. J Nutr Health. 2016; 49(5):378–394.
crossref
10. Kim HY, Lee JS, Hwang JY, Kwon S, Chung HR, Kwak TK, Kang MH, Choi YS. Development of NQ-A, nutrition quotient for Korean adolescents, to assess dietary quality and food behavior. J Nutr Health. 2017; 50(2):142–157.
crossref
11. Patterson RE, Haines PS, Popkin BM. Diet quality index: capturing a multidimensional behavior. J Am Diet Assoc. 1994; 94(1):57–64.
crossref
12. Haines PS, Siega-Riz AM, Popkin BM. The diet quality index revised: a measurement instrument for populations. J Am Diet Assoc. 1999; 99(6):697–704.
13. Kennedy ET, Ohls J, Carlson S, Fleming K. The healthy eating index: design and applications. J Am Diet Assoc. 1995; 95(10):1103–1108.
14. Guenther PM, Reedy J, Krebs-Smith SM, Reeve BB, Basiotis PP. Development and evaluation of the healthy eating index-2005: technical report. Alexandria (VA): US Department of Agriculture, Center for Nutrition Policy and Promotion;2007.
15. McCullough ML, Feskanich D, Stampfer MJ, Giovannucci EL, Rimm EB, Hu FB, Spiegelman D, Hunter DJ, Coditz GA, Willett WC. Diet quality and major chronic disease risk in men and women: moving toward improved dietary guidance. Am J Clin Nutr. 2002; 76:1261–1271.
crossref
16. US Department of Agriculture, Center for Nutrition Policy and Promotion. Healthy Eating Index (HEI) [Internet]. Alexandria (VA): US Department of Agriculture, Center for Nutrition Policy and Promotion;2016. [cited 2017 Dec 24]. Available from:. https://www.cnpp.usda.gov/healthyeatingindex.
17. Bailey RL, Miller PE, Mitchell DC, Hartman TJ, Lawrence FR, Sempos CT, Smiciklas-Wright H. Dietary screening tool identifies nutritional risk in older adults. Am J Clin Nutr. 2009; 90:177–183.
crossref
18. Vellas B, Villars H, Abellan G, Soto ME, Rolland Y, Guigoz Y, Morley JE, Chumlea W, Salva A, Rubenstein LZ, Garry P. Overview of the MNA®-its history and challenges. J Nutr Health Aging. 2006; 10(6):456–463.
19. Posner BM, Jette AM, Smith KW, Miller DR. Nutrition and health risks in the elderly: the nutrition screening initiative. Am J Public Health. 1993; 83(7):972–978.
crossref
20. Lee HO, Lee JS, Shin JW, Lee GJ. Nutrition assessment of older subjects in a health care center by MNA (Mini Nutritional Assessment). J Korean Diet Assoc. 2010; 16(2):122–132.
21. Park HK, Lim BK, Choi SH, Lee HR, Lee DS. Verification of the appropriateness when a shortened version of the Mini Nutritional Assessment (MNA) is applied for determining the malnutrition state of elderly patients. J Korean Soc Parenter Enter Nutr. 2009; 2(1):13–18.
crossref
22. Son SM, Park JK. The changes of dish consumption frequencies, dietary attitudes and health-nutrition risk for single living female elderly on food-aid program. J Korean Diet Assoc. 2005; 11(3):286–298.
23. Kim HY, Kim MH, Hong SG, Hwang SJ, Park MH. A study on the nutrient intake, health risk factors, blood health status in elderly Korean women living alone. Korean J Community Nutr. 2005; 10(2):216–223.
24. Ministry of Health and Welfare, Korea Centers for Disease Control and Prevention. Korea Health Statistics 2012: Korea National Health and Nutrition Examination Survey (KNHANES V-3). Cheongwon: Korea Centers for Disease Control and Prevention;2013.
25. Ministry of Health and Welfare (KR). Dietary guidelines for Korean elderly. Seoul: Ministry of Health and Welfare;2010.
26. Kim OS, Ryu HS. The study on blood lipid levels according to the food habits and food intake patterns in Korean elderly. Korean J Food Nutr. 2009; 22(3):421–429.
27. Pala V, Sieri S, Masala G, Palli D, Panico S, Vineis P, Sacerdote C, Mattiello A, Galasso R, Salvini S, Ceroti M, Berrino F, Fusconi E, Tumino R, Frasca G, Riboli E, Trichopoulou A, Baibas N, Krogh V. Associations between dietary pattern and lifestyle, anthropometry and other health indicators in the elderly participants of the EPIC-Italy cohort. Nutr Metab Cardiovasc Dis. 2006; 16(3):186–201.
crossref
28. Heidemann C, Hoffmann K, Spranger J, Klipstein-Grobusch K, Möhlig M, Pfeiffer AF, Boeing H. A dietary pattern protective against type 2 diabetes in the European prospective investigation into cancer and nutrition (EPIC)-Potsdam study cohort. Diabetologia. 2005; 48(6):1126–1134.
crossref
29. Yang KM. A Study on nutritional intake status and health-related behaviors of the elderly people in Gyeongsan area. J Korean Soc Food Sci Nutr. 2005; 34(7):1018–1027.
30. Kim JE, Shin S, Lee DW, Park JH, Hong EJ, Joung H. Association between compliance with dietary guidelines and Alzheimer's disease in Korean elderly. J Nutr Health. 2015; 48(3):221–227.
crossref
31. Kim MH. Characteristics of nutrient intake according to metabolic syndrome in Korean elderly: using data from the Korea National Health and Nutrition Examination Survey 2010. Korean J Food Nutr. 2013; 26(3):515–525.
32. Park YK, Lee YJ, Lee SS. The intake of food and nutrient by the elderly with chronic disease in the Seoul area. Korean J Nutr. 2012; 45(6):531–540.
crossref
33. Oh C, No JK, Kim HS. Dietary pattern classifications with nutrient intake and body composition changes in Korean elderly. Nutr Res Pract. 2014; 8(2):192–197.
crossref
34. Reedy J, Krebs-Smith SM, Miller PE, Liese AD, Kahle LL, Park Y, Subar AF. Higher diet quality is associated with decreased risk of all-cause, cardiovascular disease, and cancer mortality among older adults. J Nutr. 2014; 144:881–889.
crossref
35. Amarantos E, Martinez A, Dwyer J. Nutrition and quality of life in older adults. J Gerontol A Biol Sci Med Sci. 2001; 56:Spec No 2:. 54–64.
crossref
36. Shatenstein B, Ferland G, Belleville S, Gray-Donald K, Kergoat MJ, Morais J, Gaudreau P, Payette H, Greenwood C. Diet quality and cognition among older adults from the NuAge study. Exp Gerontol. 2012; 47:353–360.
crossref
37. McNaughton SA, Ball K, Crawford D, Mishra GD. An index of diet and eating patterns is a valid measure of diet quality in an Australian population. J Nutr. 2008; 138(1):86–93.
crossref
38. van Lee L, Geelen A, Kiefte-de Jong JC, Witteman JC, Hofman A, Vonk N, Jankovic N, Hooft van Huysduynen EJ, de Vries JH, van't Veer P, Franco OH, Feskens EJ. Adherence to the Dutch dietary guidelines is inversely associated with 20-year mortality in a large prospective cohort study. Eur J Clin Nutr. 2016; 70(2):262–268.
crossref
39. Guenther PM, Casavale KO, Reedy J, Kirkpatrick SI, Hiza HA, Kuczynski KJ, Kahle LL, Krebs-Smith SM. Update of the healthy eating index: HEI-2010. J Acad Nutr Diet. 2013; 113(4):569–580.
crossref
40. National Cancer Institute (US). Epidemiology and genomics research program [Internet]. Bethesda (MD): National Cancer Institute;2017. [cited 2017 Dec 24]. Available from:. https://epi. grants.cancer.gov.
41. Han KH, Choi MS, Park JS. Nutritional risk and its related factors evaluated by the mini nutritional assessment for the elderly who are meal service participants. Korean J Nutr. 2004; 37(8):675–687.
42. Kim SH, Choi-Kwon S. Nutritional status among elderly Korean women and related factors. J Korean Biol Nurs Sci. 2012; 14(1):16–24.
crossref
43. Moon HK, Kong JE. Reliability of nutritional screening using DETERMINE checklist for elderly in Korean rural areas by season. Korean J Community Nutr. 2009; 14(3):340–353.
44. Lee JW, Kim KE, Kim KN, Hyun TS, Hyun WJ, Park YS. Evaluation of the validity of a simple screening test developed for identifying Korean elderly at risk of undernutrition. Korean J Nutr. 2000; 33(8):864–872.

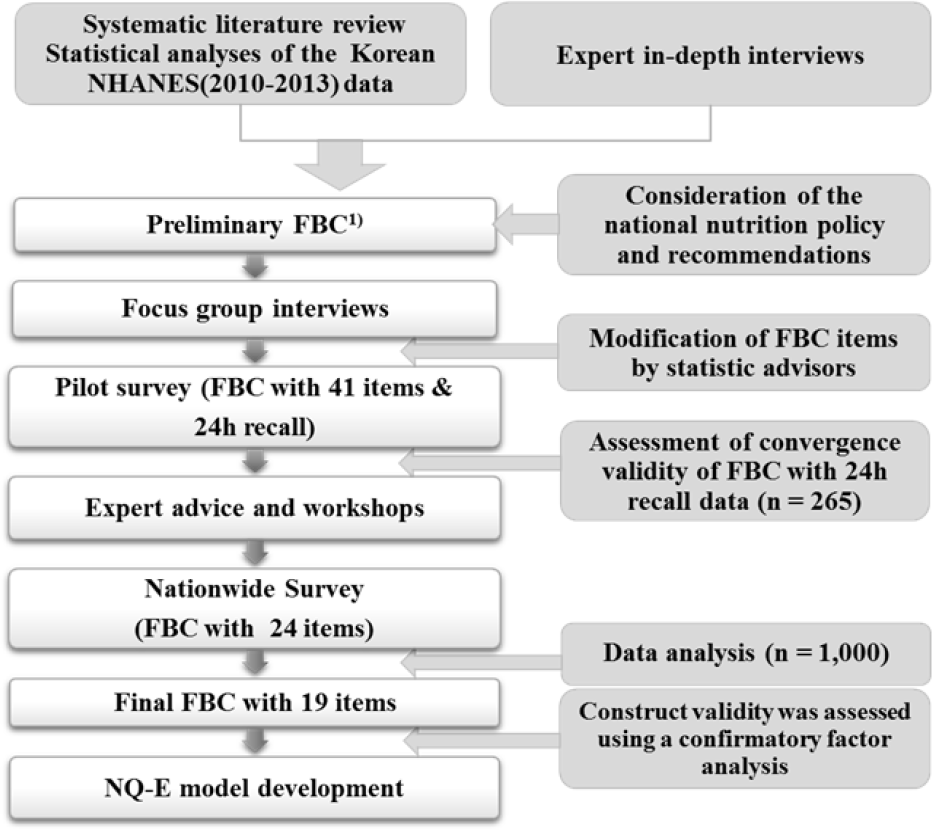
Fig. 1.
Process of NQ-E development. 1) FBC, Food Behavior Checklist
jnh-51-87f1.tif
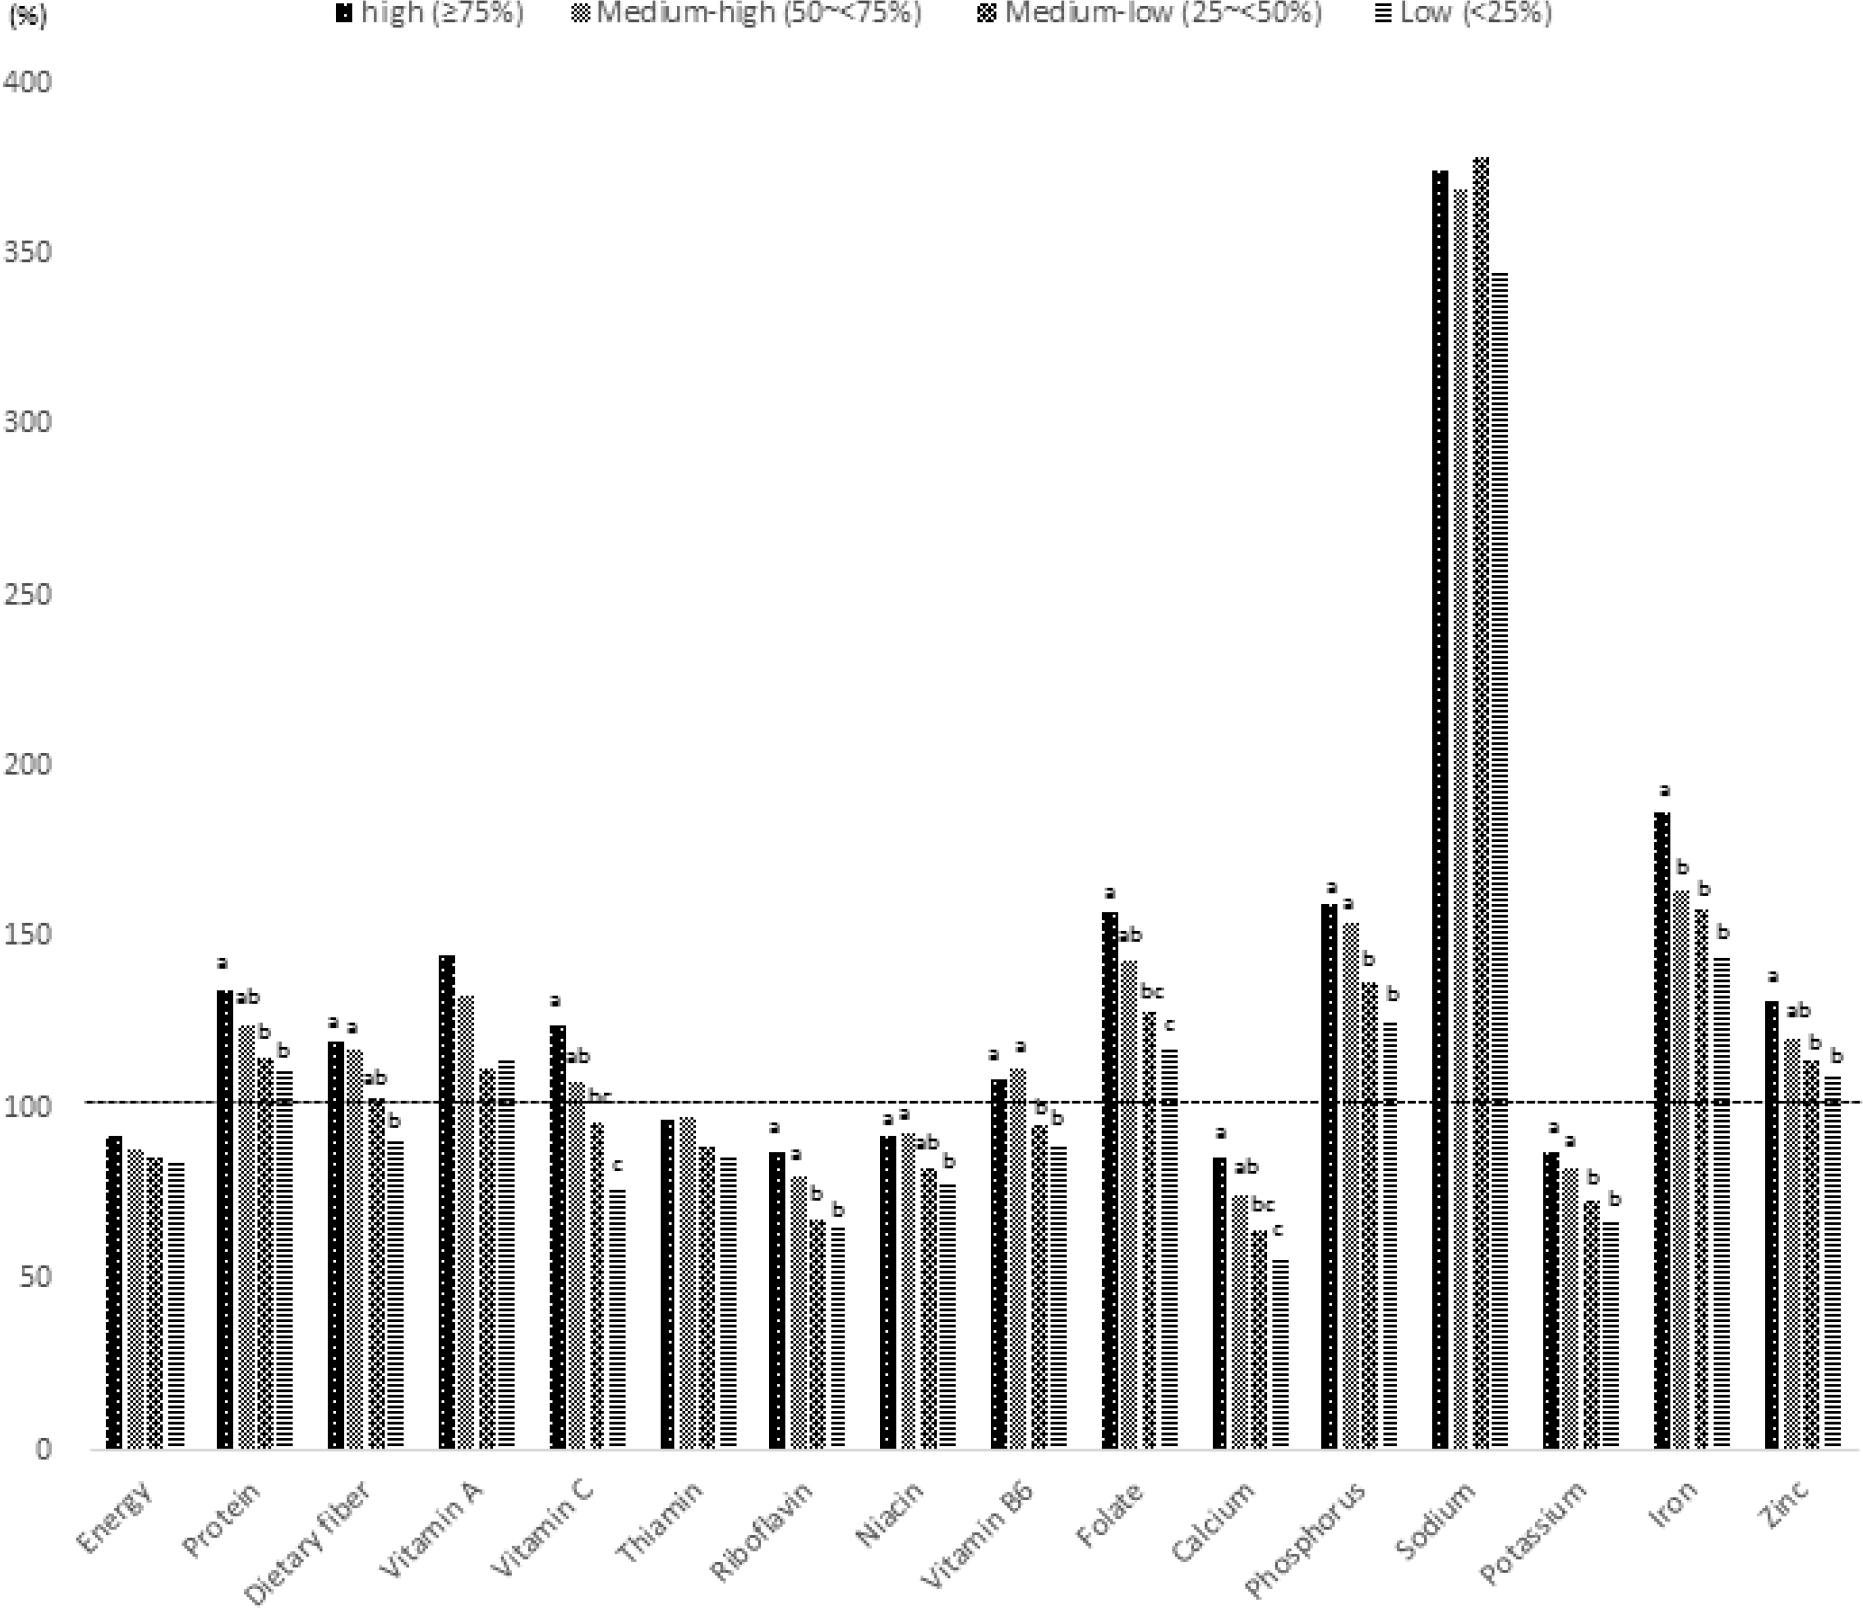
Fig. 2.
Comparison of percentage of nutrient intake of the elderly from the pilot study to recommended nutrient intake (RNI) or adequate intake (AI) according to NQ-E score four-grade criterion. a, b: Means with different alphabets are significantly different by Duncan's multiple-range test (p < 0.05).
jnh-51-87f2.tif
Table 1.
Checklist items selected for the pilot survey
Items regarding food intakes Items regarding eating behaviors
1. Cooked rice with mixed grains 1. Meal eating frequency
2. Number of vegetable dishes excluding Kimchi at each meal 2. Meal regularity
3. Intake frequency of Kimchi 3. Intake frequency of snack
4. Intake amount of Kimchi at a meal 4. Balanced consumption of side dishes
5. Intake frequency of beans or bean products 5. Overeating behavior
6. Intake frequency of meats 6. Mood at meal time
7. Intake frequency of eggs 7. Eating alone frequency
8. Intake frequency of fishes or shellfishes 8. Dietary supplements intake
9. Intake frequency of nuts 9. Smoking
10. Intake frequency of fruits 10. Drinking frequency of more than 3 cups of alcohol a day
11. Intake frequency of milk or dairy products 11. Healthy teeth and gums
12. Intake frequency of water 12. Difficulties in chewing foods
13. Intake frequency of sugar added beverages 13. Check the expiration date when purchasing processed foods
14. Intake frequency of sweet and greasy baked products 14. Experience in nutrition education and counseling
15. Intake frequency of instant noodle, ramyeon 15. Efforts to have healthy eating habits
16. Degree of gravy and sauce consumption of main dishes 16. Exercise hours
17. Intake frequency of salted foods 17. The type of chronic diseases
18. Degree of consumption of salted foods 18. Depressed condition
  19. Perception level for one's health
  20. Regular food aid beneficiaries
  21. Proper cold holding practices for foods and meals
  22. Proper washing hands practices before eating meals
  23. Dietary life circumstances
Table 2.
Items selected for a nationwide survey checklist
      Pearson's correlation coefficients with data from the pilot survey1) Rationales of selection
Criteria Items DDS2), Nutrient intake per 1,000 kcal %RNI or %AI Significant correlation coefficient Guideline & policy
  Vegetable 1. Number of vegetable dishes excluding Kimchi at each meal Fat & oil (+0.125), protein (+0.134), dietary fiber (+0.199), vitamin A (+0.139), vitamin C (+0.160), riboflavin (+0.173), niacin (+0.219), vitamin B6 (+0.198), folate (+0.203), sodium (+0.131), potassium (+0.223), iron (+0.151) Dietary fiber (+0.170), vitamin A (+0.143), vitamin C (+0.158), riboflavin (+0.150), niacin (+0.199), vitamin B6 (+0.160), folate (+0.169), vitamin B12 (+0.129), potassium (+0.183)  
    2. Intake frequency of beans or bean products DDS (+0.140), protein (+0.133), dietary fiber (+0.144)    
    3. Intake frequency of eggs Carbohydrate (−0.230), fat & oil (+0.202), protein (+0.223), riboflavin (+0.206), sodium (+0.148), cholesterol (+0.345) Riboflavin (+0.122), sodium (+0.155)  
  Fish, eggs and beans 4. Intake frequency of fishes or shellfishes Carbohydrate (−0.193), fat & oil (+0.163), protein (+0.228), riboflavin (+0.197), folate (+0.178), vitamin B12 (+0.194), calcium(+0.154), potassium (+0.164), iron (+0.164), cholesterol (+0.243) Vitamin B12 (+0.175  
    5. Intake frequency of nuts DDS (+0.132), carbohydrate (−0.196), fat & oil (+0.251), protein (+0.131), dietary fiber (+0.133), riboflavin(+0.192), calcium(+0.142), potassium (+0.124) Dietary fiber (+0.131), riboflavin(+0.166), niacin (+0.122), calcium(+0.129)  
Food intake Fruit 6. Intake frequency of fruits DDS (+0.294), dietary fiber (+0.203), vitamin A (+0.132), vitamin C (+0.256), riboflavin (+0.290), vitamin B6 (+0.218), folate (+0.2141), calcium (+0.269), potassium (+0.292), iron (+0.154), cholesterol (+0.132) Protein (+0.133), dietary fiber (+0.199), vitamin A (+0.146), vitamin C (+0.262), riboflavin (+0.291), niacin (+0.131), vitamin B6 (+0.216), folate (+0.199), calcium(+0.258), potassium (+0.272), iron (+0.141)  
  MIlk and dairy products 7, Intake frequency of milk or milk products DDS (+0.181), fat & oil (+0.137), riboflavin (+0.226), calcium (+0.246), cholesterol (+0.134) Riboflavin (+0.236), calcium (+0.249)  
  water 8. Intake frequency of Water Protein (+0.155), dietary fiber (+0.127), vitamin C (+0.147), thiamin (+0.136), folate (+0.178), potassium (+0.132) Vitamin C (+0.155), folate (+0.174), potassium (+0.126)  
  Processed foods 9. Intake frequency of sugar added beverages Vitamin C (−0.176), thiamin (−0.176), niacin (−0.131), vitamin B6 (−0.205), sodium (+0.122), iron (−0.139), zinc (−0.140) Vitamin C (−0.138), riboflavin (−0.131), vitamin B6 (−0.156), sodium (+0.163), zinc (−0.143)  
    10. Intake frequency of sweets or greased pastries Dietary fiber (−0.172), vitamin C (−0.135), folate (−0.145), calcium (−0.133)    
  Salted foods/Strong flavored foods 11. Intake frequency of ramyeon Dietary fiber (−0.131), vitamin C (−0.125), calcium (−0.177), potassium (−0.141), zinc (−0.216) Dietary fiber (−0.206), vitamin C (−0.148), vitamin B6 (−0.122), folate (−0.131), calcium(−0.156), potassium (−0.136), iron (−0.127), zinc (−0.265)  
    12. Intake frequency of salted foods Folate (+0.169), sodium (+0.138), iron (+0.167) Folate (+0.143), vitamin B12 (+0.141), sodium (+0.138)  
  Meal frequency 13. Meal frequency Protein (+0.165), thiamin (+0.175), niacin (+0.157), calcium (+0.132), sodium (+0.147) Protein (+0.206), dietary fiber (+0.124), vitamin A (+0.126), thiamin (+0.225), niacin (+0.200), folate (+0.189), vitamin B12 (+0.128), calcium (+0.208), sodium (+0.241), potassium (+0.172), iron (+0.188), zinc (+0.128)  
    14. Intake frequency of snack DDS (+0.343), riboflavin (+0.215) Energy (+0.151), dietary fiber (+0.144), vitamin C (+0.162), riboflavin (+0.274), niacin (+0.153), vitamin B6 (+0.141), calcium (+0.167), potassium (+0.174)  
  Meal alone 15. Eating alone frequency DDS (−0.146), dietary fiber (−0.126), potassium (−0.138), iron (−0.123) Energy (−0.170), protein (−0.223), dietary fiber (−0.209), vitamin C (−0.139), niacin (−0.151), vitamin B6 (−0.196), folate (−0.209), vitamin B12 (−0.145), calcium (−0.190), sodium (−0.130), potassium (−0.263), iron (−0.227), zinc (−0.191)  
    16. Check the expiration date when purchasing processed foods DDS (+0.153), fat & oil (+0.135), protein (+0.128), riboflavin (+0.143), niacin (+0.127) Riboflavin (+0.172), niacin (+0.122)
  Food selection 17. Experience in nutrition education and counseling Zinc (−0.129), Vitamin B6 (−0.127), sodium (−0.170), zinc (−0.127)
Dietary behavior & attitude   18. Efforts to have healthy eating habits DDS (+0.125), dietary fiber (+0.165), riboflavin (+0.215), vitamin B6 (+0.173), folate (+0.129), calcium (+0.127), potassium (+0.177), iron (+0.134) Dietary fiber (+0.176), vitamin A (+0.158), vitamin C (+0.168), riboflavin (+0.210), vitamin B6 (+0.177), folate (+0.172), calcium (+0.150), potassium (+0.196), iron (+0.131)
  Physical activity 19. Exercise hours DDS (+0.168), carbohydrate (−0.138), fat & oil (+0.142), protein (+0.126), thiamin (+0.153), calcium (+0.148) Dietary fiber (+0.127), thiamin (+0.128), calcium (+0.144), iron (+0.128)
  Personal hygiene 20. Proper washing hands practices before eating meals Vitamin B6 (+0.125), calcium (+0.145), potassium (+0.137), iron (+0.155), zinc (+0.179)    
    21. Difficulties in chewing foods Protein (−0.181), vitamin B12 (−0.152), calcium (−0.180), potassium (−0.126), iron (−0.154), zinc (−0.172) Protein (−0.207), dietary fiber (−0.154), niacin (−0.135), vitamin B6 (−0.146), folate (−0.130), vitamin B12 (−0.152), calcium(−0.222), sodium (−0.152), potassium (−0.202), iron (−0.198), zinc (−0.184)
    22. Depressed condition Protein (−0.155), dietary fiber (−0.124), potassium (−0.156), zinc (−0.166) Protein (−0.138), vitamin C (−0.122), calcium (−0.134), potassium (−0.175), zinc (−0.124)
Others   23. Perception level for one's health 24. Dietary life circumstances DDS (+0.168), dietary fiber (+0.156), vitamin C (+0.147), calcium (+0.183), zinc (+0.159) DDS (+0.345), protein (+0.202), dietary fiber (+0.226), vitamin A (+0.152), vitamin C (+0.156), niacin (+0.168), folate (+0.155), vitamin B12 (+0.161), calcium (+0.243), potassium (+0.227), iron (+0.120), Zinc (+0.155), cholesterol (+0.125) Dietary fiber (+0.154), vitamin C (+0.170), calcium (+0.197), potassium (+0.159), zinc (+0.124) Energy (+0.260), protein (+0.327), dietary fiber (+0.343), vitamin A (+0.269), vitamin C (+0.283), thiamin (+0.178), riboflavin (+0.282), niacin (+0.290), vitamin B6 (+0.276), folate (+0.316), vitamin B12 (+0.202), calcium (+0.342), potassium (+0.374), iron (+0.329), zinc (+0.310)

1) p < 0.05 2) DDS, dietary diversity score

Table 3.
Results of exploratory factor analysis of the 19 items selected by LISREL analysis (n = 1,000)
Checklist items Factor 1 Factor 2 Factor 3 Factor 4
Difficulties in chewing foods 0.597 0.044 0.027 –0.020
Perception level for one's health 0.582 0.069 0.212 0.060
Depressed condition 0.578 –0.111 0.149 0.078
Washing hands practices before eating meals 0.428 0.254 –0.209 –0.233
Exercise hours 0.376 0.265 –0.024 0.013
Efforts to have healthy eating habits 0.337 0.238 0.139 –0.235
Intake frequency of milk or dairy products 0.118 0.530 0.022 –0.009
Intake frequency of fruits 0.294 0.480 –0.008 0.139
Intake frequency of eggs –0.045 0.473 0.316 –0.039
Intake frequency of snack 0.029 0.461 0.003 0.098
Intake frequency of water 0.038 0.404 –0.046 –0.054
Intake frequency of fishes or shellfishes –0.019 0.291 0.596 –0.045
Eating alone frequency 0.081 –0.197 0.553 0.121
Number of vegetable dishes excluding Kimchi at each meal 0.322 0.061 0.461 0.034
Intake frequency of beans or bean products –0.027 0.294 0.445 –0.224
Meal frequency 0.164 –0.217 0.387 0.111
Intake frequency of sweet and greasy baked products –0.153 0.317 –0.052 0.672
Intake frequency of sugar added beverages 0.237 0.073 –0.005 0.633
Intake frequency of ramyeon –0.034 –0.072 0.062 0.317
Eigen value 2.39 1.38 1.20 1.17
Cumulative % of variance 12.6 19.9 26.2 32.4
Table 4.
Weights and path coefficients of four-factor structure model
Groups and items selected for NQ-E checklist and their weights
Group (Group weight)1) Checklist items Path coefficient within each group Item weight within NQ
  1. Difficulties in chewing foods 0.227 0.068
  2. Perception level for one's health 0.201 0.060
Dietary behavior 3. Depressed condition 0.212 0.063
(0.30) 4. Washing hands practices before eating meals 0.099 0.030
  5. Exercise hours 0.122 0.037
  6. Efforts to have healthy eating habits 0.140 0.042
  1. Intake frequency of milk or dairy products 0.295 0.059
Balance 2. Intake frequency of fruits 0.432 0.086
(0.20) 3. Intake frequency of snack 0.189 0.038
  4. Intake frequency of water 0.084 0.017
  1. Intake frequency of eggs 0.147 0.029
  2. Intake frequency of fishes or shellfishes 0.198 0.040
Diversity 3. Eating alone frequency 0.209 0.042
(0.20) 4. Number of vegetable dishes excluding Kimchi at each meal 0.258 0.052
  5. Intake frequency of beans or bean products 0.135 0.027
  6. Meal frequency 0.053 0.011
Moderation (0.30) 1. Intake frequency of sweet and greasy baked products 2. Intake frequency of sugar addeed beverages 3. Intake frequency of ramyeon 0.339 0.316 0.345 0.102 0.095 0.104

1) Group weights were adjusted by opinions of expert advisors.

Table 5.
NQ-E score and group score calculation using response point of the checklist
Group group Items Scale Item score: B tem weight within group: C Item weight within NQ: D
weight: A Question Response point
Dietary behavior 0.3 Difficulties in chewing foods Never 5 (response point-1) × 100/4 0.227 0.068
Seldom 4
Moderate 3
Often 2
Always 1
Very low 1
Perception level for one's health low 2 (response point-1) × 100/4 (response point-1)
Moderate 3 0.201 0.060
High 4
Very high 5
Never 5
Seldom 4
Depressed condition Moderate 3 (response point-1) × 100/4 (response point-1) 0.212 0.063
Often 2
Always 1
Never 1
Washing hands practices before eating meals Seldom 2
Moderate 3 (response point-1) × 100/4 0.099 0.030
Often 4 × 100/4
Always 5  
Seldom 1  
Less than 30 minutes 2 (response point-1) × 100/4
Exercise hours 30 minutes ∼ 1 hour 3 0.122 0.037
1 ∼ 2 hours 4
More than 2 hours 5
Never 1
Efforts to have healthy eating habits Seldom 2 (response point-1) × 100/4
Moderate 3 0.140 0.042
Often 4
  Always 5
  Subtotal         1.000
Balance 0.2 Intake frequency of milk or dairy products Less than once every 2 weeks 1 0.295 0.059  
1 ∼ 3 times per week 2 (response point-1) × 100/4
4 ∼ 6 times per week 3
Intake frequency of fruits Once a day 4 0.432 0.086
Twice a day 5
Never 1
Intake frequency of snack Once a day 2 (response point-1) × 100/3 0.189 0.038
Twice a day 3
More than three times a day 4
Seldom 1
Intake frequency of water Once or twice a day 2 (response point-1) × 100/4
Three ∼ five times a day 3 0.084 0.017
Six ∼ seven times a day 4
More than eight times a day 5
Subtotal     1.000
Diversity 0.2 Intake frequency of eggs Once per two weeks 1 0.147 0.029
1 ∼ 3 times a week 2 (response point-1) × 100/4
4 ∼ 6 times a week 3
Intake frequency of fishes or shellfish Once a day 4 0.198 0.040
More than twice a day 5
Seldom 5
Once per 2 ∼ 3 days 4 (response point-1) × 100/4
Eating alone Once a day 3 0.209 0.042
Twice a day 2
3 times a day 1
Moderation 0.3 Number of vegetable dishes at each meal Never 1 1 2 (response point-1) × 100/4 0.258 0.052
2 3
3 4
    More than 4 5
        Once per two weeks 1
Intake frequency of beans or bean products 1 ∼ 3 times a week 2 (response point-1) × 100/4 (response point-1)    
4 ∼ 6 times a week 3 0.135 0.027
Once a day 4
More than twice a day 5
1 1
Meal frequency 2 2 (response point-1) × 100/2 0.053 0.011
More than 3 3
Subtotal     (response point-1) × 100/4 1.000 0.102
Intake frequency of sweet (candies, chocholate, etc.) or greasy baked goods Less than once per two weeks 5
1 ∼ 3 times a week 4
4 ∼ 6 times a week 3 0.339
Once a day 2
More than twice a day 1
Less than once per two weeks 5
Intake frequency of sugar added beverages 1 ∼ 3 times a week 4 (response point-1) × 100/4
4 ∼ 6 times a week 3 0.316 0.095
Once or twice a day 2
More than three times a day 1
Seldom 6
Once per two weeks 5
Intake frequency of ramyeon 1 ∼ 3 times a week 4 (response point-1) × 100/5 0.345 0.104
4 ∼ 6 times a week 3
Once a day 2
More than twice a day 1
Subtotal 1.000
Table 6.
6. NQ-E checklist
Nutrition quotient checklist for the elderly (over 65 years)
1. How many vegetable dishes (excluding kimchi) do you take at each meal? (귀하는 한 번 식사할 때 김치를 제외한 채소류를 몇 가지나 #xB4DC;십니까?)
① Never (먹지 않는다) ② 1 (1가지) ③ 2 (2가지) ④ 3 (3가지) ⑤ More than 4 (4가지 이상)
2. How often do you eat fruits? (귀하는 과일을 얼마나 자주 드십니까?)
① Less than once every 2 weeks (2주일에 1번 이하) ② 1 ∼ 3 times a week (일주일에 1 ∼ 3번)
③ 4 ∼ 6 times a week (일주일에 4 ∼ 6번) ④ Once a day (하루에 1번)
⑤ More than twice a day (하루에 2번 이상)  
3. How often do you have milk or milk product? (귀하는 우유 또는
① Less than once every 2 weeks (2주일에 1번 이하) 유제품을 얼마나 자주 드십니까?) ② 1 ∼ 3 times a week (일주일에 1 ∼ 3번)
③ 4 ∼ 6 times a week (일주일에 4 ∼ 6번) ④ Once a day (하루에 1번)
⑤ More than twice a day (하루에 2번 이상)  
4. How often do you eat beans or tofu (including soymilk)? (귀하는 콩이나 콩제품을 얼마나 자주 드십니까?)
① Less than once every 2 weeks (2주일에 1번 이하) ② 1 ∼ 3 times a week (일주일에 1 ∼ 3번)
③ 4 ∼ 6 times a week (일주일에 4 ∼ 6번) ④ Once a day (하루에 1번)
⑤ More than twice a day (하루에 2번 이상)  
5. How often do you eat eggs? (귀하는 달걀을 얼마나 자주 드십니까?)
① Less than once every 2 weeks (2주일에 1번 이하) ② 1 ∼ 3 times a week (일주일에 1 ∼ 3번)
③ 4 ∼ 6 times a week (일주일에 4 ∼ 6번) ④ Once a day (하루에 1번)
⑤ More than twice a day (하루에 2번 이상)
6. How often do you eat fishes or shellfishes? (귀하는 생선이나 조개류를 얼마나 자주 드십니까?)
① Less than once every 2 weeks (2주일에 1번 이하) ② 1 ∼ 3 times a week (일주일에 1 ∼ 3번)
③ 4 ∼ 6 times a week (일주일에 4 ∼ 6번) ④ Once a day (하루에 1번)
⑤ More than twice a day (하루에 2번 이상)  
7. How often do you eat ramyeon? (귀하는 라면류를 얼마나 자주 드십니까?)
① Seldom (거의 먹지 않는다) ② Once every 2 weeks (2주일에 1번)
③ 1 ∼ 3 times a week (일주일에 1 ∼ 3번) ④ 4 ∼ 6 times a week (일주일에 4 ∼ 6번)
⑤ Once a day (하루에 1번) ⑥ More than twice a day(하루에 2번 이상)
8. How often do you eat snacks (including chocolate, candies) or sweet and greasy baked goods (cake, donut, etc)? (귀하는 과자 (초콜릿, 사탕 포함) 또는 달거나 기름진 빵 (케이크, 도넛, 단팥빵 등)을 얼 마나 자주 드십니까?)
① Less than once every 2 weeks (2주일에 1번 이하) ② 1 ∼ 3 times a week (일주일에 1 ∼ 3번)
③ 4 ∼ 6 times a week (일주일에 4 ∼ 6번) ④ Once a day (하루에 1번)
⑤ More than twice a day (하루에 2번 이상)  
9. How often do you drink sweetened beverages? (귀하는 가당 음료를 얼마나 자주 마십니까?)
① Less than once every 2 weeks (2주일에 1번 이하) ② 1 ∼ 3 times a week (일주일에 1 ∼ 3번)
③ 4 ∼ 6 times a week (일주일에 4 ∼ 6번) ④ Once or twice a day (하루에 1 ∼ 2번)
⑤ More than 3 times a day (하루에 3번 이상)  
10. How often do you drink water? (귀하는 하루에 물을 얼마나 자주 마십니까?)
① Seldom (거의 마시지 않는다) ② Once or twice a day (하루에 1 ∼ 2번)
③ 3 ∼ 5 times a day (하루에 3 ∼ 5번) ④ 6 ∼ 7 times a day (하루에 6 ∼ 7번)
⑤ More than 8 times a day (하루에 8번 이상)  
11. How often do you eat meals a day? (귀하는 하루에 식사를 몇 번 하십니까?)
① Once (1번) ② Twice(2번) ③ More than 3 times (3번 이상)
12. How often do you eat snacks a day? (귀하는 하루에 간식을 몇 번 하십니까?)
① Never (하지 않는다) ② Once (1번) ③ Twice (2번) ④ More than 3 times (3번 이상)
13. How often do you eat your meals alone? (귀하는 얼마나 자주 혼자서 식사를 하십니까?)
① Seldom (혼자 식사하는 경우가 거의 없다) ② 1 ∼ 3 times a week (일주일에 1 ∼ 3번)
③ 4 ∼ 6 times a week (일주일에 4 ∼ 6번) ④ Once a day (하루에 1번)
⑤ Twice a day (하루에 2번) ⑥ 3 times a day (하루에 3번)
14. How much efforts do you make to have healthy eating habits? (귀하는 평소에 건강에 좋은 식생활을 하려고 얼마나 노력하십니까?)
① No efforts (전혀 노력하지 않는다) ② Seldom make efforts (노력하지 않는 편이다)
③ Average (보통이다) ④ Trying to make efforts (노력하는 편이다)
⑤ Trying very hard to make efforts (매우 노력한다)  
15. Do you have any difficulties in chewing foods due to the problems of your teeth, dentures, or gums? (귀하는 현재 치아나 틀니, 잇몸 등의 문제로 인해 음식을 씹는 것이 어느 정도 불편하십니까?)
① Never uncomfortable (전혀 불편하지 않는다) ② Not uncomfortable (불편하지 않는 편이다)
③ So-so (보통이다) ④ Uncomfortable (불편한 편이다)
⑤ Very uncomfortable (매우 불편하다)  
16. Do you wash your hands before eating your meals? (귀하는 음식을 먹기 전에 손을 씻으십니까?)
① Never wash (전혀 씻지 않는다) ② Do not wash (씻지 않는 편이다)
③ So-so (보통이다) ④ Trying to wash (씻는 편이다)
⑤ Wash always (항상 씻는다)  
17. How many hours do you exercise a day? (귀하는 하루에 운동을 얼마나 하십니까?)
① Seldom (거의 하지 않는다)  
② Less than 30 minutes (30분 이내)  
③ More than 30 minutes ∼ Less than 1 hour (30분 이상 ∼ 1시간 이내)
④ More than 1 hour ∼ Less than 2 hours (1시간 이상 ∼ 2시간 이 내)
⑤ More than 2 hours (2시간 이상)  
18. How often do you feel depressed condition in a day? (귀하는 평상 시 우울함을 어느 정도 느끼십니까?)
① Never (전혀 느끼지 않는다) ② Not depressed (느끼지 않는 편이다)
③ So-so (보통이다) ④ Depressed (느끼는 편이다)
⑤ Very depressed (매우 느낀다)  
19. How healthy do you think it is? (귀하는 본인이 얼마나 건강하다고 생각하십니까?)
① Never (전혀 건강하지 않다) ② Not healthy (건강하지 않는 편이다)
③ So-so (보통이다) ④ Healthy (건강한 편이다)
⑤ Very healthy (매우 건강하다)
Table 7.
NQ-E score range by the four-grade criterion
Mean score1) Grade criterion2)
  (N = 1,000) High Medium-high Medium-low Low
NQ-E score 57.6 ± 8.7 63.5–100 57.6–63.4 51.9–57.5 0–51.8
Dietary behavior 55.0 ± 14.5 64.9–100 55.1–64.8 45.2–55.0 0–45.1
Balance 41.4 ± 19.0 55.2–100 41.6–55.1 25.8–41.5 0–25.7
Diversity 50.0 ± 14.4 60.0–100 50.5–59.9 40.3–50.4 0–40.2
Moderation 76.5 ± 15.8 91.5–100 76.3–91.4 67.8–76.2 0–67.7

1) mean ± SD 2) High: 75% ≤ NQ-E percentile ≤ 100%, Medium-high: 50% ≤ NQ-E percentile < 75%, Medium-low: 25% ≤ NQ-E percentil < 50%, Low: 0% ≤ NQ-E percentile < 25%

TOOLS
Similar articles