

 PDF
PDF ePub
ePub Citation
 Print
Print


Abstract
Figures and Tables
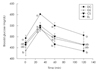 | Fig. 1Blood glucose curves in oral glucose tolerance test in C57BL/KsOlaHsd-db/db mice. At the 5th week of the experimental period, the db/db mice were administered with glucose solution (0.1 g/100 g B.W) and the plasma glucose was determined at 0, 30, 60, 120 min after glucose load. DC: Diabetic control, GS: Genistein (3.75 mg/100 g diet), CS: Coumesterol (3.75 mg/100 g diet), EL: Enterolactone (3.75 mg/100 g diet). Values are mean ± S.E. Different letters on the top of the vertical bars indicate significant difference (p < 0.05) among 4 groups by Duncan's multiple comparison test.
|
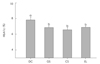 | Fig. 2The effect of phytoestrogen supplementation on HbA1c level in C57BL/KsOlaHsd-db/db mice. The glycosylated hemoglobin values (HbA1c) are expressed as % of total hemoglobin. DC: Diabetic control, GS: Genistein (3.75 mg/100 g diet), CS: Cou-mesterol (3.75 mg/100 g diet), EL: Enterolactone (3.75 mg/100 g diet). Values are means with their standard errors indicated by vertical bars. Different letters on the top of the bars indicate significant difference (p < 0.05) among 4 groups by Duncan's multiple comparison test.
|
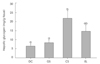 | Fig. 3The effect of phytoestrogen supplementation on hepatic glycogen level in C57BL/KsOlaHsd-db/db mice. DC: Diabetic control, GS: Genistein (3.75 mg/100 g diet), CS: Coumesterol (3.75 mg/100 g diet), EL: Enterolactone (3.75 mg/100 g diet).Values are means with their standard errors indicated by vertical bars. Different letters on the top of the bars indicate significant difference (p < 0.05) among 4 groups by Duncan's multiple comparison test.
|
 | Fig. 4The effect of phytoestrogen supplementation on renal Nε-(carboxymethyl) lysine level in C57BL/KsOlaHsd-db/db mice. DC: Diabetic control, GS: Genistein (3.75 mg/100 g diet), CS: Coumesterol (3.75 mg/100 g diet), EL: Enterolactone (3.75 mg/100 g diet). CML: Nε-(carboxymethyl) lysine. Values are means with their standard errors indicated by vertical bars. 'ns' on the top of the bars indicates no significant difference (p < 0.05) among 4 groups by Duncan's multiple comparison test.
|
Table 1
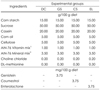
1) AIN-76 vitamin mix (g/kg mix): thiamin HCl 0.6, riboflavin 0.6, pyridoxine HCl 0.7, nicotinic acid 3, D-calcium pantothenate 1.6, folic acid 0.2, cyanocobalamin 0.001, retinyl palmitate 0.8 (500,000 IU/g), DL-α-tocopheryl acetate 20 (2,500 IU/g), cholecalciferol 0.0025, menaquinone 0.005, sucrose to make 1 kg 2) AIN-76 mineral mix (g/kg mix): calcium phosphate dibasic 500, sodium chloride 74, potassium citrate monohydrate 220, potassium sulfate 52, magnesium oxide 24, manganous carbohydrate 3.5, ferric citrate 6, zinc carbonate 1.6, cupric carbonate 0.3, potassium iodate 0.01, sodium selenite 0.01, chromium potassium sulfate 0.55, sucrose to make 1 kg. DC: Diabetic control, GS: Genistein supplemented group, CS: Coumesterol supplemented group, EL: Enterolactone supplemented group
![]()
Table 2

![]()
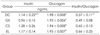
Table 3

DC: Diabetic control, GS: Genistein (3.75 mg/100 g diet), CS: Coumesterol (3.75 mg/100 g diet), EL: Enterolactone (3.75 mg/100 g diet), ns: not significantly different among 4 groups (p < 0.05)
Different superscripts in the same column indicate significant difference (p < 0.05) among 4 groups by Duncan's multiple comparison test
*Mean ± S.E.
![]()
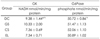
Table 4

DC: Diabetic control, GS: Genistein (3.75 mg/100 g diet), CS: Coumesterol (3.75 mg/100 g diet), EL: Enterolactone (3.75 mg/100 g diet), AUC: Area under the curves in oral glucose tolerance test
Different superscripts in the same column indicate significant difference (p < 0.05) among 4 groups by Duncan's multiple comparison test
*Mean ± S.E.
![]()
Table 5
DC: Diabetic control, GS: Genistein (3.75 mg/100 g diet), CS: Coumesterol (3.75 mg/100 g diet), EL: Enterolactone (3.75 mg/100 g diet), ns: not significantly different among 4 groups (p < 0.05)
Different superscripts in the same column indicate significant difference (p < 0.05) among 4 groups by Duncan's multiple comparison test
*Mean ± S.E.
![]()
 XML Download