

 PDF
PDF ePub
ePub Citation
 Print
Print


INTRODUCTION
Early childhood is an important period for physical growth and cognitive development. Health status in childhood tends to be associated with the risk of morbidity and mortality in adulthood [12]. Therefore, nutrition in early childhood is of great importance to the wellbeing of the child as well as to their health status later in life.
Dietary fat and fatty acids play an essential role in supporting healthy growth and development in young children [3]. Adequate intake of total fat and fatty acids represents a dense energy source, which helps children meet high energy needs for rapid growth [3]. In particular, polyunsaturated fatty acids (PUFA) are involved in the formation and function of cell membranes, visual and neural development, and immune function [45]. Reduced intake of saturated fatty acids (SFA) has been associated with decreased total cholesterol, low-density lipoprotein cholesterol, and blood pressure among both children and adolescents [67].
Previous studies conducted in the US and Europe have documented young children's intakes of total fat and fatty acids [891011121314151617]. Based on the National Health and Nutrition Examination Survey from 2013 to 2014, US children aged 2–5 years consumed 55.7 g of total fat (32% of their energy) and 20.1 g of SFA (11% of their energy) among males and consumed 51.9 g of total fat (33% of their energy) and 18.8 g of SFA (12% of their energy) among females [8]. Based on recent data collected in the Netherlands, children aged 1–3 years obtained about 30% of their energy from total fat, 11% from SFA, 10% from monounsaturated fatty acid (MUFA), and 6% from PUFA [1415]. In a Belgian study of 6-36-month-old children, total fat intake was estimated to be 39–45 g per day (31-33% of their energy) [16].
However, there have been few studies conducted on total fat and fatty acid intake among young children in Asian countries. In the 2015 Japan National Health and Nutrition Survey, children aged 1–6 years consumed 40.4 g of total fat (28% of their energy) and 12.8 g of SFA [18]. A Malaysian study reported that 1-6-year-old children gained 30–33% of their energy from total fat, with 11–13% of their energy being from SFA [19], whereas a study in Bangladesh showed much lower intake of total fat and SFA among children aged 24–48 months [20].
Notably, sociodemographic status contributors such as living area, maternal education level, and household income are known to be critical determinants of diet composition among children [19212223]. Children with a low household income status [1922] or with less-educated mothers [2123] showed a higher risk of having inadequate diets. However, limited information on dietary disparities according to sociodemographic characteristics in terms of dietary fats is available.
Despite the important role of dietary fat and fatty acids in young children, there have been few studies that have assessed total fat and fatty acid intake in Korean toddlers and children due to the limited information on the fatty acids composition of Korean foods. Recently, a comprehensive database of fatty acid for Korean foods was developed [24], and so it is now possible to produce more precise estimates of the consumption of total fat and fatty acids in the Korean population. To our knowledge, no studies have examined food sources of total fat and fatty acids among young children in Korean, which may differ from food sources in adults.
Identifying the current status of total fat and fatty acids intakes along with their food sources among young children is necessary to provide specific dietary guidelines and tailor nutrition policies for improvement of children's health. Therefore, the aim of this study was to evaluate the intake of total fat and fatty acids and their major food sources among 1-5-year-old Korean children using national data. We also examined sociodemographic factors that may relate to the intake of fat and fatty acids in young children, such as living area, household income, and maternal education level.
SUBJECTS AND METHODS
Data and subjects
This study used data from the sixth Korea National Health and Nutrition Examination Survey (KNHANES VI; conducted from 2013 to 2015), which was administered by the Korea Centers for Disease Control and Prevention. The KNHANES is a cross-sectional and nationally representative survey that employs multistage stratified cluster sampling and consists of a health interview survey, a health examination survey, and a nutrition survey [25]. Survey participants are recruited from a nationally representative sample of non-institutionalized Korean individuals aged 1 year or older.
A total of 1,386 children aged 1–5 years participated in the KNHANES VI. With regard to these individuals, the current study excluded them if they had missing variables for dietary variables, living area, household income, and/or mother's education level; if they had a history of diagnosis of diabetes or congenital heart disease; and if total energy intake was not within ± 3 standard deviation of the mean energy intake for each sex and age group, in order to avoid the inclusion of individuals with implausible intake [19]. The final subjects considered in the analyses in this study were 1,041 children (1–2 years old, n = 401; 3–5 years old, n = 640). This study was approved by the Institutional Review Board of the Korea Centers for Disease Control and Prevention (2013-07CON-03-4C, 2013-12 EXP-03-5C) for the years 2013 and 2014. Since the 2015 KNHANES has been exempted from review about research ethics based on Bioethics and Safety Act. Written informed consent was obtained from parents or guardians of all study subjects.
Assessment of dietary variables
Dietary intake data were obtained by use of a 24-h dietary recall protocol as part of the nutrition survey. The dietary data were collected by trained dietitians at the participant's home, one week after the health interview survey and health examination survey were completed. Total energy and macronutrient intake were calculated using a food composition table published by the Rural Development Administration of Korea [26]. Fatty acid intake was calculated using a newly developed database containing fatty acid content information for 5,144 foods items [24]. The detailed process of the database development is described elsewhere [24]. Children's total fat and fatty acid intake were evaluated as absolute intake in grams (g) and percentage of total energy intake (%kcal). The ratio of PUFA to SFA was calculated as PUFA intake divided by SFA intake. The ratio of n-6 fatty acids (n-6 FA) to n-3 fatty acids (n-3 FA) was calculated as n-6 FA intake divided by n-3 FA intake. To identify major food sources of total fat and fatty acids, the tertiary food codes of the KNHANES were used. Food sources of total fat and fatty acids were identified based on the amounts of total fat and fatty acids consumption by each food. The major food sources were determined by taking the ratio of total fat and fatty acids provided by each food over the total intake of fat and fatty acids from all foods.
Measurement of other variables
Demographic (e.g., sex, age) and socioeconomic (e.g., living area, household income, mother's education level) variables were measured during the health interview survey by a questionnaire. Children's living area was classified into two groups: urban and rural. Household income was classified into two groups: low (quartiles 1 and 2) and high (quartiles 3 and 4). In the KNHANES VI data, mother's educational level was determined by four categories in accordance with their graduation status (either elementary school, middle school, high school, or college or more). Based on the distribution of the mother's education level, the data were re-categorized into the following two groups in this study: ≤ high school graduation and ≥ college graduation.
Statistical analyses
All statistical analyses were performed using the SAS software version 9.4 (SAS Institute, Cary, NC, USA). All analyses accounted study subjects by age group1) for the complex survey design, which consisted of multistage, stratified, and clustered samples, and survey weights to reflect the estimates of the entire Korean population. The analyses were separately conducted for the 1-2-y and 3-5-y groups, respectively. Intake of total energy, macronutrients, and fatty acids were expressed as mean ± standard error (SE) and the food sources of total fat and fatty acids were presented with percentages and cumulative percentages of total consumption. Children's characteristics were expressed as frequencies and percentages and compared between the two age groups using the Rao-Scott chi-square test. Intake of total fat and fatty acids by living area, household income, and mother's education level were analyzed using the analysis of covariance test after adjustment for sex and energy intake. All tests of significance were two-tailed and P-values < 0.05 were considered to be significant.
RESULTS
Characteristics of the study subjects
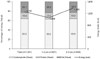
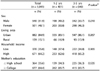
Table 1 shows the characteristics of the children by age group. Among 1,041 children included in this study, 52% were male, and about 85% of the children lived in urban areas. Children with higher household income status composed about 64% of this study population, and 64% of the children had mothers who had completed college or more. The distribution of sex, living area, household income, and mother's education level did not differ by age group. Fig. 1 presents the total energy and macronutrient intake by age group. Children in the 3-5-y group had higher energy intake but lower protein intake than did children in the 1-2-y group (1,386 kcal vs. 1,058 kcal, P-value < 0.001 for energy intake; 13.2% vs. 13.7%, P-value = 0.042 for protein intake). The percentages of energy obtained from carbohydrates and fat did not statistically differ by age group.
Total fat and fatty acids intake by age group
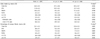
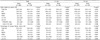
Table 2 shows the total fat and fatty acids intake according to age group. The mean intake of total fat was 27.1 ± 0.8 g in the 1-2-y group and 35.5 ± 0.7 g in the 3-5-y group, and about 23% of the children's energy was obtained from total fat in both age groups. The mean intake of SFA was 10.5 ± 0.3 g in the 1-2-y group and 12.7 ± 0.3 g in the 3-5y group, whereas children in the 1-2-y group obtained more energy from SFA than did children in the 3-5-y group (9.2% vs. 8.3%). The mean intake of PUFA was 6.3 ± 0.1 g in the 1-5-y group, with 0.8 ± 0.03 g of n-3 FA and 5.5 ± 0.1 g of n-6 FA being consumed. The percentages of energy from PUFA, n-3 FA, and n-6 FA were higher in the 3-5-y group than in the 1-2-y group.
Major food sources of total fat and fatty acids
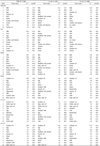
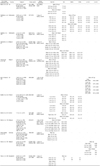
Main food sources of total fat and fatty acids are presented in Table 3. Milk, pork, and eggs were the major food sources of total fat, SFA, and MUFA in this study. In the 1-2-y group, cheese and modified milk powder also provided 6.0% and 5.4% of SFA intake, respectively. Soybean oil was the main contributor to PUFA intake in both age groups, providing 14.3% and 21.6% of PUFA in the 1-2-y and 3-5-y groups, respectively. Eggs, tofu, and bread were also major food sources of PUFA in children aged 1 year to 5 years. Children in both age groups mainly obtained n-3 FA from the consumption of perilla seed oil and rapeseed oil.
Total fat and fatty acids intake by socioeconomic characteristics
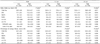
Among children in the 1-2-y group, those living in rural areas had significantly higher PUFA and n-3 FA intakes and PUFA: SFA ratio than did children living in urban areas. In comparison, in the 3-5-y group, there was no difference in total fat and fatty acids intake observed according to living area (Table 4). Total fat and fatty acids intakes except the n-6:n-3 FA ratio did not differ with respect to household income or mother's education level (Tables 5 and 6).
DISCUSSION
The current study evaluated the intake of total fat and fatty acids and their food sources among 1-5-year-old Korean children using nationally representative data. We also estimated fat and fatty acids consumption according to sociodemographic characteristics, such as living area, household income, and maternal education level.
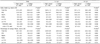
As a fatty acids database for common Korean foods was established in 2014 [24], population-level estimations of fatty acids consumption can now be performed in the Korean population. Consequently, we compared total fat and fatty acids intakes by Korean children to studies in other countries (Table 7). This study showed much lower intakes of total fat, SFA, and MUFA in comparison with findings from the US [827] or Europe [9111214151617]. Average levels of PUFA and n-3 FA consumption were similar to those in Western studies [910121728]. Only a small number of Asian studies have been published on dietary fat and fatty acids intakes in young children. Malaysian children aged 1–6 years showed higher intakes of total fat and SFA [19], whereas Bangladeshi children aged 1–5 years consumed much lower fat and fatty acids amounts compared with children in the current study [20]. The performance of a direct comparison of fat and fatty acids consumption among identified studies was limited due to differences in the age of the study population, study period, dietary assessment tools, and food composition tables of total fat and fatty acids. In future studies, population-specific dietary recommendations on total fat and fatty acid intakes should be determined for young children to evaluate their intakes of total fat and fatty acids.
In this study, the major food sources for total fat, SFA, and MUFA among young children included milk, pork, and eggs. Children aged 1–2 years in this study also reported cheese and modified milk powder as sources of SFA consumption. In European studies, milk, dairy products, and meat products demonstrated high contributions to total fat, SFA, and MUFA intake among children [152930]. According to the Healthy Lifestyle in Europe by Nutrition in Adolescence study, European adolescents also obtained considerable amounts of total fat, SFA, and MUFA from cake, pies and biscuits, cheese, and chocolate [30].
In Korean children of this study, the major food sources for PUFA were soybean oil, followed by eggs and tofu. In particular, n-3 FA were obtained from several types of oils, such as soybean oil, rapeseed oil, and perilla seed oil, which are frequently used in Korean dishes. Similar to our study, Bangladeshi children aged 24–48 months had soybean oil as their main food source of PUFA intake. Among Indonesian children aged 4–12 years, vegetable dishes and soup were the major contributing foods for alpha-linolenic acid (ALA) intake, followed by legumes, nuts, and seeds [31]. Among young children in US and Belgium, the greatest contributing food group was milk and yogurt for ALA; fish and sea foods for eicosapentaenoic acid (EPA) and docosahexaenoic acid (DHA); and meat, poultry, and eggs for arachidonic acid (AA) [1028]. The development and updating of food-based dietary guidelines will be necessary to ensure appropriate intakes of total fat and individual fatty acids in young children.
In this study, children aged 1–2 years showed differences in intake of PUFA and n-3 FA by living area. In addition, disparity in the ratio of n-6 to n-3 FA intake was observed based on mother's education level. Disparities in children's diets by socioeconomic status have been reported. Children with low household income status or who live in disadvantaged communities had higher intake of total fat or SFA due to consuming low-quality and energy-dense foods [3233]. Besides presenting data on fat and fatty acids, the Malaysian study also showed that low-income preschoolers had lower intake of most nutrients and high percentages of children did not meet the recommended levels [19]. Generally, low socioeconomic status places limitations on access to grocery stores and diverse and high-priced foods as well as nutrition-related information, often resulting in the consumption of low-quality diets [34]. However, little information on the association between socioeconomic characteristics and dietary intake in young children has been published. The effects of socioeconomic status on young children's diets should be examined to tailor specific nutrition education and programs targeting vulnerable populations.
The current study has several limitations. The use of a single 24-h dietary recall might not reflect the usual nutrient intake of children and could be subject to under- and over-reporting by parents or caregivers. Our analysis of energy and nutrients also did not include the consumption of breast milk or dietary supplements, which could lead to an underestimation of reported values. Despite these limitations, to the best of our knowledge, this is the first study that has described current national data on dietary fat and fatty acid intake of preschool-aged children in Korea.
In conclusion, our findings provide current information on total fat and fatty acid intake of young children in Korea. The assessment of fat and fatty acid consumption among young children may be helpful in efforts to improve their health status through the development and implementation of national nutrition policies and programs. Future research should focus on establishing specific recommendations for fatty acid intake to examine gaps between the recommended levels and current intakes of young children. In addition, further investigation of the associations of dietary fat intake with health status is necessary.
 XML Download