

 PDF
PDF ePub
ePub Citation
 Print
Print


INTRODUCTION
Indigenous people in Peninsular Malaysia are called Orang Asli. As defined by the United Nations Development Programme, “Indigenous people are the minority social group that share similar characteristics and maintenance of cultural, social, economic and political institutions within ancestral territories” [1]. They are officially classified into three main ethnics groups: Negrito, Senoi, and Proto-Malay [2]. Mah Meri people, fall under the Senoi sub-ethnic group who are internationally well known for their cultural dance with traditional wood-carved masks. Mah Meri are known as “forest people” or “sea people” because they live near the forest and sea in Selangor, and many work as fishers [2]. Like indigenous people around the world, for almost every social indicator, the Orang Asli lag behind other ethnic groups, and are among the most marginalized communities in Malaysia [3].
According to the Rome declaration on world food security, “poverty is a major cause of food insecurity, and food security exists when all people, at all times, have physical and economic access to sufficient, safe and nutritious food to meet their dietary needs and food preferences for an active and healthy life” [4]. Poverty and food insecurity are usually associated with malnutrition, and malnourishment is defined as having poor or inadequate diet that lead to undernutrition [5]. Several studies among the Orang Asli communities in Malaysia have found that more than one third of Orang Asli were living in poverty and experiencing household food insecurity, resulting in malnutrition and chronic energy deficiency among women [67]. However, a study conducted by Saibul et al. [8] on the dual burden of malnutrition in Orang Asli households reported that half of the women were either obese or overweight. This observation was supported by the suggestion that poverty and food insecurity are paradoxically linked to overnutrition, causing overweight and obesity [7].
In light of the high burden of malnutrition and its consequences, the National Plan of Action for Nutrition of Malaysia III (NPANM III), 2016–2025 highlighted “the second Sustainable Development Goals (SDGs) which is “zero hunger” to end hunger, achieve food security, and improved nutrition” [9]. Collectively, various studies reported associations between food insecurity, diet quality, and body weight; however, discrepancies exist between the severity level of food insecurity and the complex inter-relationships with ethnicity, culture, socioeconomic, and nutritional transition [101112131415]. Since these associations have never been fully described among Orang Asli women, this study aimed to determine the food security status, diet quality, and weight status relationships to other socio-demographic variables of interest among Mah Meri women.
SUBJECTS AND METHODS
Study population and design
This cross-sectional study was carried out on Carey Island and Tanjung Sepat, which are situated in the district of Kuala Langat, located on the Selangor southwest coast, Peninsular Malaysia. Cluster sampling was used to select households from one indigenous tribe, the Mah Meri of the Senoi ethnic group. In Kuala Langat district, there are three counties with Mah Meri villages (a total of eight villages). Three villages on Carey Island and one village in Tanjung Sepat were randomly selected and all the households within the villages were invited to participate in this study. The villages on Carey Island were situated approximately 30 km from a small town (Banting) while village in Tanjung Sepat was near (within 5 km) a town (Tanjung Sepat) in the Kuala Langat district of Selangor.
The required total sample size of this study was 216 subjects as a 20% non-responsive rate was expected. All households were visited to identify women aged 19 to 59 years old who were not pregnant, not lactating, not vegetarian, not suffering from any acute or chronic diseases, and had not changed their food habits in the past six months for specific purposes (e.g., for weight reduction, muscle building, or disease control). Upon screening for inclusion and exclusion criteria, a total of 222 households were eligible for participation. All subjects provided informed consent and data collection was performed between August 2015 and January 2016. Prior to data collection, permission to conduct the research was obtained from the Department of Orang Asli Development, and the research protocol was approved by Ethics Committee for Research involving Human Subjects, Universiti Putra Malaysia, IRB No. UPM/TNCPI/RMC/1.4.18.1(JKEUPM)/F2.
Socio-demographic characteristics and household food security status
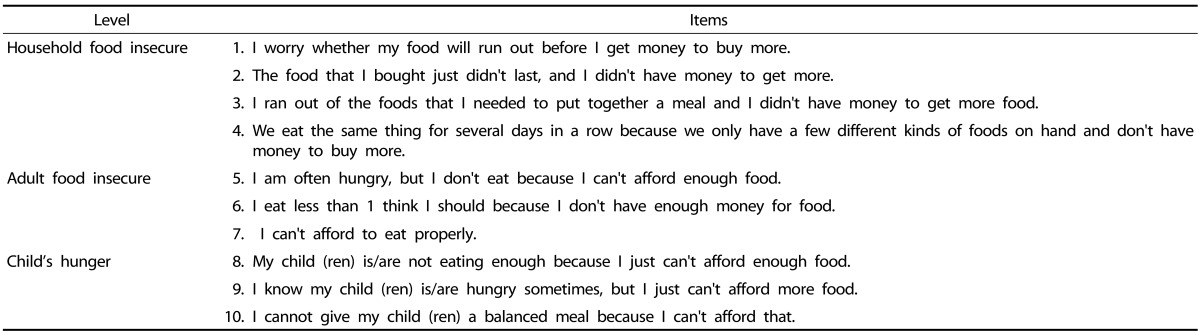
Socio-demographic data were collected by trained enumerators through face-to-face interviews. The background data for the subjects included age, marital status, education level, number of children, household size, household income, and food expenditure. The Radimer/Cornell Hunger and Food Insecurity Instrument (10 items) was used to examine the severity level of food insecurity of a household [16]. The level of food insecurity was categorized into four levels based on responses to 10 items as shown in Table 1. The first level was food security: negative answer “never happen” to all items. The second level was household food insecurity: positive answer “sometimes or always happen” to at least one of items 1 to 4. The third level was individual food insecurity: positive answer to at least one of items 5 to 8. The most severe level was child hunger: positive answer to items 9 and 10. The text of each of the 10 items was translated into Malay. The translations were used in previous local studies [7] with reported good internal consistency (Cronbach's α = 0.8-0.9). Cronbach's alpha in this study was 0.89.
Dietary intake assessment
Food intake information was obtained through two 24-hour diet recalls (one weekday and one weekend). Subjects were asked to recall all foods and beverages consumed in the preceding 24 hours. Household measures including spoons, cups, bowls, glasses, and plates were used to estimate the serving size of the food intake. The dietary intake data were transformed into energy and nutrient intakes using Nutritionist Pro® Software Version 4.0 (Axxya Systems, Stafford, Texas, United States) based on the Malaysian food composition database [17]. The serving size for each food group was determined based on the recommended serving size in the Malaysian Dietary Guidelines 2010 [18].
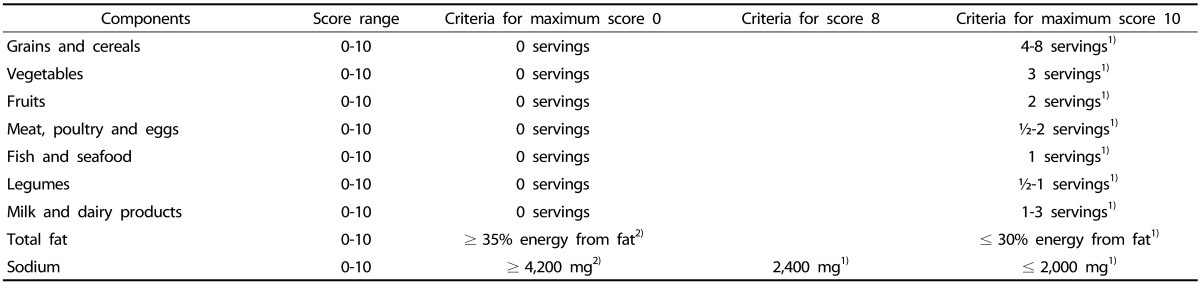
The Malaysian Healthy Eating Index (HEI) was developed by Lee et al. [19] and validated by Goh and Norimah [20] to assess overall diet quality of the subjects. The Malaysian HEI consists of seven components of food groups (grains and cereals, vegetables, fruits, meat, poultry and eggs, fish and seafood, legumes, and milk and dairy products) and two components of nutrients (percentage of energy from fat and sodium intake). The scoring of components was calculated based on the subjects' compliance with the recommended serving size and the nutrient intake in the MDG. As presented in Table 2, the score of each component ranged from 0 to 10 and was calculated proportionately for in-between whole number responses. The total HEI score was obtained by summing the scores of each of the components. The composite score (in percent) was calculated using the formula: (total score obtained from 9 components / maximum score of 90) × 100%. A composite score less than 51% indicated poor diet, a score between 51% to 80% indicated diet requiring improvement, and a score of more than 80% indicated a good diet [19].
Anthropometric measurements
Anthropometric measurements (height and weight) were measured twice and the average used in the analyses. The height and weight of subjects were measured by using a Seca portable stadiometer model 213 (Seca GmbH & Co. KG., Hamburg, Germany) and a TANITA digital weighing scale model HD-309 (Tanita Corporation, Tokyo, Japan), respectively. The obtained height and weight were used to calculate body mass index (BMI) to determine the weight status of the subject. The BMI cut-off point was based on the WHO (1998) guideline [21].
Statistical analysis
Data were analyzed by using IBM SPSS Statistics version 22.0 (International Business Machines Corporation, Armonk, New York, United States). All variables were presented first as descriptive statistics such as mean, standard deviation, median, interquartile range, frequency, or percentage. Mean differences and associations between socio-demographic characteristics and components of Malaysian HEI with food security status were assessed by using one-way analysis of variance (ANOVA) and chi-squared tests. The Welch test was conducted when the assumption of homogeneity of variances was violated in the one-way ANOVA test. However, for data that were not normally distributed, the non-parametric Kruskal-Wallis test was performed.
To identify significant mean differences among food security groups, Tukey's honestly significant differences (HSD) post hoc test was applied for the one-way ANOVA test, while the Games Howell post hoc test was applied for the Welch test. For Kruskal-Wallis testing, six pairwise differences among the groups were determined by using the Mann-Whitney test, controlling for type I error across tests by using Bonferroni approach. Multivariate analysis of covariance (MANCOVA) was used to determine mean differences in the Malaysian HEI and BMI according to food security status after controlling for covariates. For MANCOVA testing, Bonferroni corrections were applied to adjust the p value of two dependent variables and to compare each of the food security groups [22]. The acceptable level of statistical significance for all tests was p < 0.05 except for the Mann-Whitney test, which was p < 0.008, and the MANCOVA test, which was p < 0.025, after Bonferroni adjustment.
RESULTS
Socio-demographic characteristics
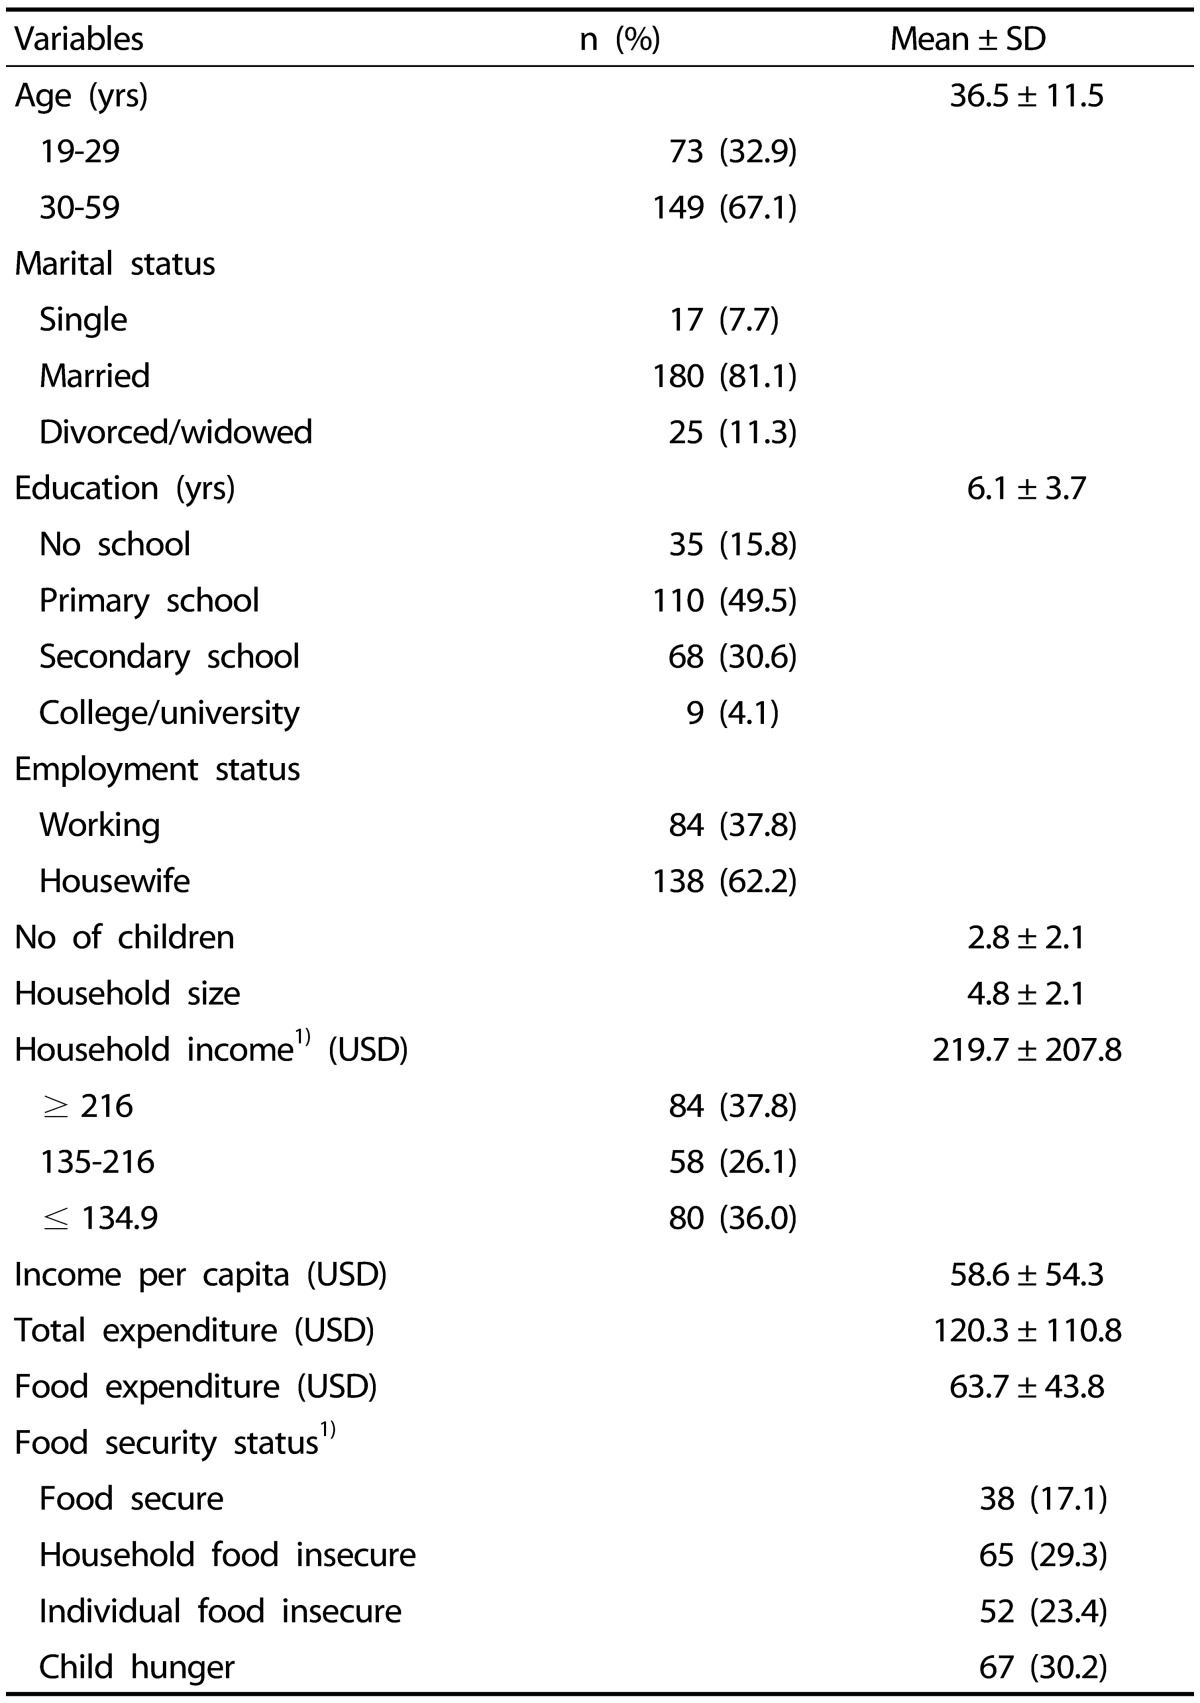
A total of 222 subjects participated in this study, and their mean age was 36.5 ± 11.5 years old (Table 3). The majority of subjects were married (81.1%). The mean education level of the subjects was low (6.1 ± 3.7 years), with approximately half receiving a primary education (49.5%). Although most subjects were housewives (62.2%), at times they engaged in fishing, rubber, coconut, and palm oil planting, or in culture-related jobs, such as dancing, weaving, and carving. The mean number of children and mean household size were 2.8 ± 2.1 and 4.8 ± 2.1, respectively. The mean monthly household income was USD 219.7 ± 207.8. About 26.1% of the households reported as poor had a monthly income below USD 216, while so-called “hard-core” poor had a monthly income below USD 135 (36.0%) [23]. The mean household income per capita was USD 58.6 ± 54.3. Meanwhile, the mean total expenditure and food expenditure were USD 120.3 ± 110.8 and USD 63.7 ± 43.8, respectively.
Household food security status
As presented in Table 3, about 82.9% households reported some form of food insecurity, with 29.3% subjects experiencing a mild level of food insecurity (i.e., household food insecure). This result was followed by 23.4% subjects experiencing individual food insecurity, while 30.2% of the women were in the child-hunger category (i.e., severe level of food insecurity).
Socio-demographic characteristics by food security status
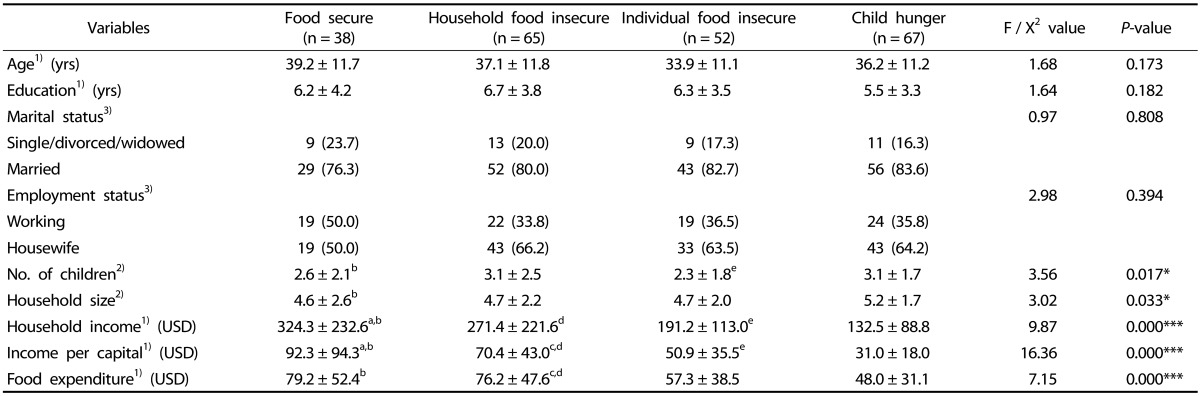
Subjects from the child-hunger group had a significantly greater number of children than that in the food-secure group and the individual food-insecure group (p < 0.05; Table 4). In addition, the child-hunger group had a significantly larger household size than the food-secure group (p < 0.05). Household income, income per capita, and food expenditure decreased significantly from that in the households experiencing food security group to that in the child-hunger group (p < 0.001).
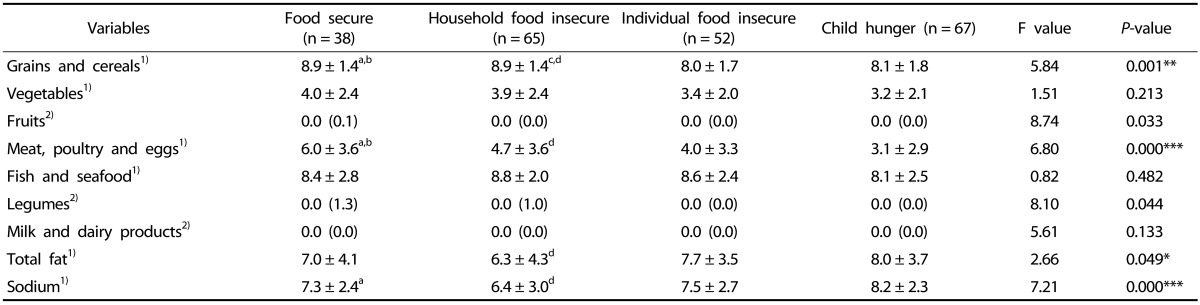
Component scores of Malaysian Healthy Eating Index by food security status
The component scores of the Malaysian HEI by food security status are presented in Table 5. Compared to subjects from the food-secure and household food-insecure groups, subjects from the individual food-insecure and child-hunger groups had significantly lower scores for the grains and cereals (p < 0.01) and meat, poultry, and eggs (p < 0.001) components. With regard to nutrient components, the fat nutrient score of the child-hunger group was significantly higher than that of the household food-insecure group (p < 0.05). The mean sodium nutrient score of the subjects in the child-hunger group was significantly higher than those of the food-secure and household food-insecure groups, respectively (p < 0.001). Higher scores for fat and sodium nutrients indicate lower consumptions of fat and sodium, respectively.
Diet quality and weight status according to food security status
The MANCOVA results are shown in Table 6. The Multivariate Wilks' Lambda indicated that, overall, there was an association between food security status and Malaysian HEI and BMI after controlling for age (p < 0.01). The analysis also showed that the subjects from the individual food-insecure and child-hunger groups were significantly associated with lower mean Malaysian HEI scores than that of the food-secure group after controlling for age (p < 0.025). The subjects from the household food-insecure group were significantly associated with a higher mean BMI than those of the individual food-insecure and child-hunger groups after controlling for age (p < 0.025).
DISCUSSION
The present study showed that members of the individual food-insecure and child-hunger groups had lower mean Malaysian HEI scores; specifically for grains and cereals as well as meat, poultry and egg components. In addition, subjects in the household food-insecure group had higher BMI than that in individual food-insecure and child-hunger groups.
The prevalence of overall household food insecurity in this study was higher than that reported in previous studies conducted among non-indigenous women (Malay and Indian ethnic groups) in Peninsular Malaysia [2425]. The higher proportions of household food insecurity shown in this study could be attributed to the high percentage of poor and hard-core poor households in this study. According to the Central Bank of Malaysia, food inflation tends to be higher in lower income households as a larger proportion of the expenditure of lower income households is for food [26]. In addition to economic changes (e.g., the Consumer Price Index increased by 4.2% from February 2015 to February 2016), a higher cost of living and frequent unexpected expenses (both food and non-food items) may put these lower income households at more risk of experiencing food shortage [27]. Another cause of high food insecurity could be related to cultural sources of income instability, such as bad weather can affect fishing and agricultural crops, and difficulty in securing culture-related jobs.
Among the socio-demographic characteristics examined, food-insecure households were shown to have more children and a larger household size compared to their food-secure counterparts [242829]. The number of children may contribute to food insecurity because having more children will increase not only expenses on child education and healthcare but also general expenses in a household [24]. Due to the limited resources, a larger household size can tend to experience more food insufficiency as food requirement increase linearly with the number of members in a household, thus causing the family to be at greater risk of food insecurity [2429]. Moreover, the results showed that household income, income per capita, and food expenditure significantly decreased as food insecurity worsened. These results support those in many other studies in developed and developing countries, which reported that low household income was a risk for food insecurity [122930]. Due to inadequate income, poor households have lesser purchasing power, not allowing them to provide sufficient food to the household or to be able to purchase a variety of foods [1431].
Similar to results in previous Western and local studies, food insecurity at the individual and child level was associated with lower diet quality as shown by the lower consumption of components grains and cereals, as well as poultry and meat [1032333435]. This result could be due to a lack of economic access to a variety of food choices and/or to increasing food prices limiting the ability to afford adequate food, causing an overall reduction in food intake and diet quality [3536]. Women from the household food-insecure group (mild food insecurity) consumed more fat and sodium, which may be the result of a coping strategy aimed at cooking and consuming whatever food is available in the household, such as fried rice with oil, soy sauce and salted fish or anchovies [37]. With regard to the child-hunger group, those women seemed to experience severe food insecurity as they reduced the number of meals eaten or skipped meals to provide for their children's needs, even reducing their expenditure on basic food, such as oil and salt, to cope with food insecurity, thus resulting in a decrease of total fat and sodium intake [3437].
Although food insecurity was reported to be consistently associated with a lower intake of vegetables, fruits, legumes, and dairy products in America, Canada, and the general population of Peninsular Malaysia, this trend was not observed in this study [101131323334]. This could be explained by financial constraint and differing social and cultural norms of Orang Asli, which logically explain their different dietary patterns [38]. The low intake of vegetables and fruits among Orang Asli could be due to the lack of availability of wild plants and seasonal fruits around their settlement [39]. In addition, Orang Asli communities generally have a low level of acceptability of milk powder or fresh milk, instead they prefer sweetened condensed milk to add to their beverages [40]. Regardless of food security status, the subjects in this study had a relatively high intake of fish and seafood, presumably because of ease of access to an adequate supply of seafood as they resided in close proximity to the sea.
This study indicated that women experiencing food insecurity at household level tended to be overweight or even obese [1215]. A possible reason for this observation could be that this phenomenon is cyclic [41], which means that during a period of food inflation (high food prices), climate change (drought or raining), and/or economic crisis, access to food is limited and the household may experience food scarcity [36]. However, when household food supply is adequate, individuals may binge due to perceived anxiety about future food shortages [42]. Anxiety, depression, and a disrupted eating pattern due to seasonal changes in household food insecurity can put food-insecure women at risk of weight gain and obesity [2542]. Another plausible mechanism is the alteration of the pattern of dietary intake quality to cope with household food insecurity [374344]. Due to income constraint, household food-insecure women may choose less expensive, high calorie dense food instead of nutrient dense food items to maintain their quantity of food intake, which can subsequently increase energy intake and lead to weight gain [3344].
Being limited to the cross-sectional nature of the available data, this study lacks the ability to conclude a causal inference. Moreover, the results of this study cannot be generalized to the Orang Asli community in Malaysia due to the small sample size, restricted study locations, and a sample design that did not represent all Orang Asli sub-tribes. The two-day 24-hour dietary recall data used to estimate the dietary intake of subjects could not provide an accurate estimate of intake level, most likely due to misreporting as subjects either under-reported or over-reported their recalled dietary intakes. In addition, the Malaysian HEI used in this study did evaluate the adequacy of each food group, and excess dietary intake, such as that from carbohydrate, protein, and sugar, was not taken into consideration. Regardless, as there is limited published data on this sub-tribe, the information gathered on the diet quality and weight status of Mah Meri women does add to the current literature on this sub-tribe.
In conclusion, this study found that most Orang Asli women experienced household food insecurity. Food insecurity at the individual and child level was associated with poor diet quality, while household level food insecurity was associated with higher body weight. To improve the current level of food insecurity, it is recommended that an intervention program focus on enabling Orang Asli women to gain control over access to their own food supply by providing financial planning, nutrition intervention, or education focusing on strategic buying of healthy food choices and attaining a balanced diet. To address the food insecurity-obesity paradox, future longitudinal studies that include a wide range of economic (food prices), environmental (climate change), psychological (anxiety and depression), social, and cultural variables are required to elucidate the effects of prolonged food insecurity on nutritional outcomes within this vulnerable group.

 XML Download