

 PDF
PDF ePub
ePub Citation
 Print
Print


INTRODUCTION
Kimchi is a traditional Korean fermented food and basic side dish of the Korean diet. It was published in a famous health magazine that Kimchi is one of the five healthiest foods in the world [1]. Kimchi is made from various vegetables, red pepper, other spices, and fermented seafood and is rich in various vitamins, minerals, dietary fiber, and other biological components [2]. Moreover, the annual tradition Gimjang involves preparing and storing a large quantity of kimchi for the winter season [3]. Gimjang culture was registered in the Intangible Cultural Heritage of Humanity list of United Nations Educational, Scientific and Cultural Organization (UNESCO) in 2013. This achievement can be used to draw international attention to Korean kimchi. Many studies have reported the beneficial effects of kimchi, including its anti-obesity [4], anti-asthma [5], anti-cancer [6], anti-oxidative [7], anti-atherosclerotic [8], and cholesterol-lowering effects [9].
Diets rich in vegetables and fruit are associated with healthy effects based on studies examining trends in vegetable intake [1011121314] and effects on disease prevalence [151617]. The World Health Organization (WHO) and World Cancer Research Fund/American Institute for Cancer Research (WCRF/AICR) recommend at least 400 g of vegetable and fruit daily [1819]. In Korea, the objectives of the National Health Plan 2020 included increasing vegetable and fruit intake up to 50% in Koreans, who already eat more than 500 g of vegetables and fruit per day [20]. Since kimchi is an important source of vegetable intake in Korea, assessing vegetable intake through changes in kimchi consumption is important.
Many researchers have reported the perception and preferences of consumers related to kimchi [21], development of kimchi menu items for school foodservice [2223], physicochemical, sensory, and functional qualities of ingredients [2425262728293031], and the functional properties of lactic acid bacteria from kimchi [132].
The Korea National Health and Nutrition Examination Survey (KNHANES) is used to obtain stratified, multistage probability data on Korean households. These data could reflect characteristics of the general Korean population. Studies on food intake based on KNHANES data have examined Korean dietary patterns [33], including consumption of rice and whole grains [3435], eggs [36], beef and processed meat [3738], ramen and noodles [39], and vegetables and fruit [14404142]. However, studies on average kimchi intake in the Korean population have never been performed other than to examine physicochemical, sensory, or preference characteristics using a convenient sampling method.
Therefore, the purpose of this study was to analyze daily kimchi consumption by general characteristics and vegetable and fruit consumption from 1998 to 2012 in the Korean population based on data from the KNHANES.
SUBJECTS AND METHODS
Study population
The study was based on the 1998-2012 KNHNES. Analysis data on 54,700 subjects (1998: n = 7,501, 2001: n = 7,092, 2005: n = 6,526, 2007: n = 2,939, 2008: n = 6,274, 2009: n = 6,974, 2010: n = 5,944, 2011: n = 5,884, 2012: n = 5,566) aged 19 years and older by using a health behavior interview and 24-hour dietary recall method were obtained. Individuals who ate less than 500 kcal or more than 5,000 kcal of daily total caloric intake were excluded to minimize any biases.
General characteristics
General characteristics of subjects included gender, age, marital status, residential area, occupation status, educational level, and household income. We classified subjects into 19 to 29, 30 to 49, 50 to 64, 65 to 74, and 75 years and older for age and low, middle-low, middle-high and high for household income, city and rural area for residential area.
Categorization of meal occasion and serving place
For analysis of meal occasion, we categorized meal occasion into breakfast, lunch, and dinner by using the daily meal (N_meal) in the 24-hour recall method. Cooking location was categorized into home meal, commercial place meal, and institutional meal by meal type variable (N_mtype) based on studies of Chung et al. [39] and Kwon et al. [43]. Homemade meals consisted of home-prepared meals, lunch boxes, and meals prepared by neighbors and relatives. Commercial meals included Korean, Western, Japanese, and Chinese food, fast food, foods made of flour, snack bars, packed foods, instant noodles, bread/cookies, street food, and others. Institutional meals were classified as industry, school, day care/kindergarten, senior-citizen center, free, religious community, and others.
Analysis of kimchi intake
Kimchi intakes were analyzed by using the variables of secondary food name (n_fname2), dish name (n_dname), and food intake (nf_intk) based on the 24-hour recall method. Kimchi included baechu (chinese cabbage) kimchi, godulbaegi (Korean lettuce, lxeris sonchifolia H.) kimchi, gat (mustard leaf) kimchi, ggakdugi (diced radish kimchi), buchu (Korean-leek) kimchi, pa (scallion) kimchi, oisobaki (stuffed cucumber kimchi), seokbakji (radish and various vegetable kimchi), nabak kimchi (radish watery kimchi), dongchimi (water based radish kimchi), yeolmu (young summer radish) kimchi, altarimu (young radish) kimchi, bossam (wrapped kimchi) kimchi, sunmu (turnip) kimchi, yuchae (canola) kimchi, baek (white kimchi), geotjeoli (fresh kimchi), and ggaennip (perilla leaf) kimchi.
Intake of vegetables and fruits
To analyze intake of vegetables and fruit, starch vegetables (potato, sweet potato, corn, and etc.), dried vegetables, and salted vegetables (salted and pickled vegetables) were excluded. We analyzed and calculated on intakes of fresh fruit except canned fruits with sugar and fruit juice based on the study of Kwon et al. [44].
Statistical analysis
Analyses were performed with stratified sampling weights by using SAS software (version 9.2; SAS Institute, Cary, NC, USA), as the KNHANES consists of a multistage stratified cluster sampling design. The data results were in the form of weighted %, mean values, and standard errors. Chi-square test (χ2-test) was performed to identify significant differences among categorical variables through the surveyfreq procedure, and significant differences among continuous variables were verified through the surveymean procedure. Average age and kimchi intake by survey year were reported as mean values and standard errors and determined as P for trend by using the surveyreg procedure. When the results showed a significant difference (α = 0.05), Tukey test was performed for verification of significance. For analysis of nutrient intakes, descriptive statistics were generated for mean values and standard errors of nutrient intake using survey year as an independent variable and nutrient intake as a dependent variable. Trends in increased/decreased kimchi intake by survey year were determined after adjusting for age and energy intake. Based on the surveylogistic procedure, the odds ratio (ORs) and 95% confidence interval (CI) were obtained.
RESULTS
General characteristics
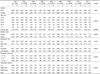
General characteristics of subjects are presented in Table 1. Among the 54,700 subject study sample, 50.5-50.8% were women. For distribution of age, those aged 30-40 years constituted more than 40% of subjects by survey year, whereas those aged 75 years and over constituted the least number. Percentage of individuals with 12 years of education decreased from 39.5% in 1998 to 30.9% in 2012, whereas the percentage of those with 12 years of education and over increased from 26.4% in 1998 to 43.1% in 2012. For residential area, approximately 81% of subjects lived in cities, whereas only 19% of subjects lived in rural areas. The proportion of employed individuals increased by around 3.5% from 1998 to 2012, whereas the proportion of unemployed declined from 40.2% in 1998 to 36.7% in 2012. For household income level, the proportion of the low household income group decreased by approximately 4.0% from 18.7 to 14.7%. However, the proportion of the middle-high and high household income group did not significantly change from 1998 to 2012. The proportion of obese individuals increased from 22.6% in 1998 to 30.6% in 2012.
Daily consumption of kimchi by general characteristics
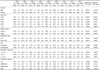
Daily mean consumption of kimchi by general characteristics from 1998 to 2012 is shown in Table 2. Daily mean consumption of kimchi decreased among all general characteristics (gender, age, residential area, marital status, job status, education level, and household income) from 1998 to 2012. With the unadjusted for age or energy intake, subjects with female, aged 19 to 29, married and unmarried, and unemployed among general characteristics showed reduction of daily mean consumption of kimchi from 1998 to 2012 (P for trend < 0.0001). Subjects with female, aged 19 to 29, married and unmarried showed reduction of daily mean consumption of kimchi with adjusting for energy and age from 1998 to 2012 (P for trend < 0.0001)
Daily kimchi consumption by meal occasion and cooking location and consumption of kimchi, fruit, and vegetables
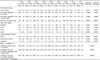
Table 3 presents daily kimchi consumption by meal occasion and cooking location, daily consumption of kimchi, non-salted vegetable and fruit, and portion size of kimchi from 1998 to 2012. Daily kimchi consumption for unadjusted and adjusted energy and age decreased in 2012 compared to 1998 (P for trend < 0.05).
Daily consumption of non-salted vegetable and fruit did not significantly change from 1998 to 2012, whereas that of kimchi and non-salted vegetable and fruit reached more than 400 g, which is the recommended guideline of the WCRF/AICR. Portion size of kimchi for adjusted and unadjusted instances significantly decreased in 2012 compared to 1998. For daily kimchi consumption by meal occasion, kimchi consumption at breakfast, lunch, and dinner also decreased in 2012 compared to 1998. Specifically, kimchi consumption at breakfast for adjusted and unadjusted instances significantly decreased (P for trend < 0.0001), and that at dinner for the adjusted instance significantly decreased in 2012 compared to 1998 (P for trend = 0.0021). Daily kimchi consumption of snacks increased in 2012 compared to 1998, whereas that for adjusted and unadjusted instances showed significant differences (P for trend < 0.0001). For daily kimchi consumption by cooking location, the kimchi consumption of home was significantly decreased in 2012 compared to 1998 for both adjusted and unadjusted instances (P for trend < 0.0001). However, daily kimchi consumption at commercial locations significantly increased in 2012 compared to 1998 for both adjusted and unadjusted instances (P for trend < 0.001). The subjects consumed non-salted vegetable and fruit with less than recommended level (400 g/day) tended to decrease since 2005 (n = 5,076, 78.4%). However, more than half in subjects insufficiently consumed as 67.6% of subjects in 2012. The subjects consumed non-salted vegetable and fruit including kimchi with < 400 g/day increased as 53.7% in 2012 compared to 48.5% in 1998 (P < 0.0001).
Daily kimchi consumption according to food intake, meal occasion, and cooking location by gender
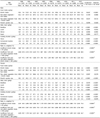
Table 4 presents daily kimchi consumption according to food intake (kimchi, non-salted vegetable and fruit, non-salted vegetable, fruit, and kimchi, and kimchi portion size), meal occasion, and cooking location by gender. For males, daily kimchi consumption significantly decreased in 2012 compared to 1998 for adjusted and unadjusted instances (P for trend < 0.05). Daily consumption of non-salted vegetable, fruit, and kimchi reached more than 400 g, which is recommended by the WCRF/AICR from 1998 to 2012, whereas daily consumption of non-salted vegetable and fruit did not significantly change in 2012 compared to 1998. Daily kimchi consumption at breakfast, lunch, and dinner decreased in 2012 compared to 1998 for both adjusted and unadjusted instances, whereas daily kimchi consumption of snacks significantly increased in 2012 compared to 1998 for both instances (P for trend < 0.0001). Daily kimchi consumption at home significantly decreased (P for trend < 0.0001), whereas that at commercial locations significantly increased in 2012 compared to 1998 for both instances (P for trend < 0.0001).
For females, daily kimchi consumption also significantly decreased in 2012 compared to 1998 for both adjusted and unadjusted instances (P for trend < 0.0001). Daily consumption of non-salted vegetable, fruit, and kimchi reached more than 400 g, which is recommended by the WCRF/AICR from 1998 to 2012, whereas daily consumption of non-salted vegetable and fruit showed no significant difference in 2012 compared to 1998. Daily kimchi consumption at breakfast, lunch, and dinner decreased in 2012 compared to 1998. Especially, daily kimchi consumption at lunch and dinner significantly decreased in 2012 compared to 1998 for both adjusted and unadjusted instances (P for trend < 0.0001). Daily kimchi consumption at home by females significantly decreased (P for trend < 0.0001), whereas that at commercial locations significantly increased in 2012 compared to 1998 for both instances (P for trend < 0.0001). The subjects consumed non-salted vegetable and fruit including kimchi with < 400 g/day increased as 56.7% in 2012 compared to 49.7% in 1998 (P < 0.0001).
Odds ratios of insufficient kimchi, vegetable, and fruit consumption by survey year
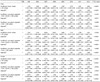
Odds ratios of kimchi, vegetable, and fruit consumption < 40 g per day (daily recommended amount) by survey year are shown in Table 5. The proportion of subjects with insufficient intake of kimchi increased 1.4 times at 2011 and 1.6 times in 2012 compared to 1998 (P for trend < 0.0001). After adjustment for age and energy intakes, the proportion of subjects with insufficient intake of kimchi increased 1.5 times in 2011 and 1.7 times in 2012 compared to 1998 (P for trend < 0.0001). The proportion of males with insufficient intake of kimchi increased more than 1.3 times in 2012 compared to 1998 after adjustment for age and energy intake (P for trend < 0.0001). The proportion of females with insufficient intake of kimchi increased approximately 2-fold in 2012 compared to 1998 after adjustment for age and energy intake (P for trend < 0.0001).
The proportion of subjects with insufficient intake of non-salted vegetable and fruit except kimchi increased more than 1.1 times in 2011 and 1.2 times in 2012 compared to 1998 (P for trend = 0.0098). After adjustment for age and energy intake, the proportion increased more than 1.3 times in 2011 and 1.4 times in 2012 compared to 1998 (P for trend < 0.0001). The proportion of males with insufficient intake of non-salted vegetable and fruit except kimchi showed no significant difference between 1998 and 2012 but increased 1.4 times in 2012 after adjustment for age and energy intake (P for trend < 0.0001). Meanwhile, the proportion of females with insufficient intake of non-salted vegetable and fruit consumption except kimchi increased 1.3 times in 2012 compared to 1998 for both instances (P for trend < 0.0001).
For subjects with insufficient intake of non-salted vegetable, fruit, and kimchi, all subjects showed no significant differences between 1998 and 2012. After adjustment for age and energy intake, it is shown that subjects with insufficient intake of non-salted vegetable, fruit, and kimchi increase 1.1 times in 2012 among total subjects (P for trend = 0.0017) and1.2 times in 2012 among males (P for trend < 0.0001) compared to 1998, whereas those of females showed no difference between 1998 and 2012.
DISCUSSION
This study shows trends in consumption of kimchi, vegetable, and fruit among Korean adults using data from the KNHANES from 1998 to 2012. Daily kimchi consumption and portion size of kimchi decreased significantly from 1998 to 2012 (adjusted P for trend < 0.0001). Meanwhile, daily consumption of both non-salted vegetable and fruit with and without kimchi did not significantly change between 1998 and 2012. Reduced consumption of kimchi was observed for both genders as well as daily meal episodes and cooking locations. All subjects consumed at least 400 g/day of non-salted vegetable, fruit, and kimchi in each survey year, although they consumed insufficient amounts (< 400 g/day) of non-salted vegetable and fruit without kimchi.
According to general characteristics of subjects (gender, age, residential area, marital status, job, educational level, and household income), daily mean consumption of kimchi tended to decrease from 1998 to 2012. In particular, women aged 19 to 29 years showed significantly decreased daily mean consumption of kimchi (P for trend < 0.0001). Lee et al. [45] reported that college students and young adults usually show irregular eating habits, such as skipping breakfast, frequent eating-out, smoking, and alcohol consumption. Moreover, as social and economic changes lead to more working women, higher household incomes, increasing number of single families, and greater accessibility to fast food outlets and restaurants, the dietary patterns of Koreans have changed from traditional meals such as rice, soup, side dishes, and kimchi to a Westernized meal pattern such as bread, meat, and fast or processed foods [46]. This change in dietary patterns is positively associated with a general decline in daily kimchi consumption among young adults. Regarding kimchi consumption by educational level, subjects with < 12 years of education showed significantly decreased from kimchi consumption 1998 to 2012 (unadjusted P trend = 0.0012, Adjusted P trend = 0.0018). Hong et al. [40] reported that kimchi intake by the low-educational group increased, whereas vegetable and fruit consumption except kimchi gradually decreased. Education may affect knowledge of good nutrition and appropriate food choices. On the other hand, kimchi is a traditional Korean side dish and easy to afford and access as a main dish for general Koreans.
The WHO and WCRF/AICF recommend no less than 400 g of fruit and non-starch vegetable every day [1819]. However, insufficient kimchi (< 40 g/day) and fruit and non-salted vegetable (< 400 g/day) intake in subjects ratio significantly increased from 1998 to 2012 (P < 0.0001). Lee et al. [41] reported that only 5.3% of subjects satisfied the recommended intake of vegetables and fruit in the 2008 KNHNES. Especially, consumption rates of adolescents aged 13 to 18 years and adults aged 19 to 39 years were shown to decrease compared to other aged groups.
Kwon et al. [44] reported 25.7% of Koreans satisfy the recommended vegetable and fruit intake of 400 g/day. It was reported that 33% and 27% of American adults satisfy the recommended intake of vegetable and fruit, respectively, by the Centers for Disease Control and Prevention (CDC) [47]. Many studies have suggested that vegetable and fruit intake can prevent chronic diseases such as cancer, diabetes, and cardiovascular disease since they contain essential vitamins, minerals, fiber, and biological compounds [61011131415]. Therefore, sufficient intake of vegetables and fruit is very important to maintain health.
For kimchi consumption of subjects by meal occasion, kimchi consumption at breakfast decreased significantly from 1998 to 2012 (Unadjusted P trend < 0.0001, Adjusted P trend < 0.0001). This can be attributed to skipping or eating a light breakfast. Kwon & Ju [43] reported that proportions of skipping breakfast increased from 11.8% in 1998 to 22.3% in 2012 among Korean adults based on the KNHNES from 1998 to 2012. Regarding cooking location, daily kimchi, vegetable and fruit consumption of commercial and institutional places were increased significantly (unadjusted P trend < 0.0001, Adjusted P trend < 0.0001). This result can be attributed to a 2-fold increase in eating-out from 21.4% in 1990 to 46.6% in 2011 among Koreans [43]. The Korea Institute for Health and Social Affairs reported that approximately 25% of Korean people regularly eat meals provided by institutional foodservice, such as school, industry, office, hospital, military, and welfare facilities, at least once a day [48]. This result is closely associated with reduced kimchi consumption at breakfast, which is usually eaten at home. Therefore, kimchi consumption is increased when meals are consumed at commercial or institutional places.
Regarding daily kimchi consumption by gender, both male and female subjects showed significantly decreased kimchi consumption between 1998 and 2012 (Adjusted P trend < 0.0001). In particular, kimchi consumption by females decreased more than 2-fold from 1998 to 2012 (P for trend < 0.0001). Daily consumption of non-salted vegetable, fruits, and kimchi by both genders reached more than 400 g as recommended by the WCRF/AICR from 1998 to 2012. Male and female subjects with insufficient non-salted vegetable and fruit intake were increased 1.4 times and 1.3 times, respectively, in 2012 than 1998. Based on this result, it is necessary to promote consumption of kimchi among the Korean population and research the development of low sodium kimchi in the future.
This study has some limitations. First, this study may not be extrapolated to the general Korean population since it excluded children and adolescents. Second, it is difficult to measure general kimchi consumption due to the convenient sampling survey of the one day 24-hour recall method, food intake frequency, and within-person variation. Lastly, since many studies have shown that kimchi contains a high amount of sodium, it is necessary to investigate excellence and improvement of kimchi based on objective data and experiments by analyzing the relationship between kimchi intake and sodium-associated diseases.
 XML Download