

 PDF
PDF ePub
ePub Citation
 Print
Print


INTRODUCTION
Growth is one relevant indicator of a child's nutritional status and is a tool for assessing health and well-being of children [1]. Generally, child growth status is based on length, height, weight, and age and is generally assessed based on the combined indicators of length/height for age (stunting), weight for length/height (wasting), and weight for age (under-weight) etc. [2]. One of the most important risk factors of growth failure is poor nutritional status, especially in early age. Adequate nutrition supply during childhood also strongly promotes cognitive achievement and prevents onset of chronic diseases in later life [3].
Given the growing burden of non-communicable diseases (NCDs) in both industrialized and developing countries, the double burden of malnutrition including under-nutrition and overweight has also increased worldwide [45]. Chronic under-nutrition during childhood could lead to increased risk of developing a thrifty phenotype resulting in adverse health outcomes later in life, especially if the growing child is exposed to over-nutrition [678]. Specifically, in early life, malnutrition problems such as obesity related to stunting are known to promote growth retardation [91011].
There are many studies that have demonstrated hunger and food insecurity as causes of malnutrition as well as an association with both overweight and growth failure. Recently, children from households with low economic status tend to be affected by food insecurity and are more likely to consume unhealthy foods [12] and be overweight [1314].
However, studies on the relationships among dietary intake, growth development, and overweight by socioeconomic status in toddlers and preschoolers are still limited. Therefore, this study aimed to examine the effect of dietary intake on growth status in toddlers and preschoolers by household income level using the cross-sectional surveys of the 2009-2011 Korea National Health and Nutrition Examination Survey (KNHANES).
SUBJECTS AND METHODS
Study design and subjects
This study used data from the KNHANES conducted by the Korean Ministry of Health and Welfare. This cross-sectional survey has been conducted periodically since 1998. The participants were recruited among non-institutionalized civilians, and a stratified, multistage probability sampling design was applied for the selection of household units. Detailed description of the survey has been reported elsewhere [15].
This study was based on data from a total of 1,870 children aged 1 to 5 years that participated in the surveys from 2009 to 2011. Those without complete information for all variables considered in this analysis were excluded: First, children without information on household income were excluded (16 cases excluded). Second, those without dietary intake and anthropometric data were excluded (167 cases excluded). Finally, an analytic data set on 1,687 eligible children was constructed to investigate the association between household income and nutrition and growth in young children.
Measures and study variables
Survey data included children's gender, age in months, household income, weight, height, and energy and nutrient intake. Socio-demographic data were collected by an interviewer-administered questionnaire. Average monthly household income was divided into quartile groups (low, mid-low, mid-high, or high). The anthropometric data were measured according to standardized protocol: each participant dressed in light clothing without shoes; weight was determined to the nearest 0.1 kg on a medical balance (GL-6000-20, CAS, Seoul, Korea); height was measured to the nearest 0.1 cm with a wall-mounted stadiometer (Seca 220, Seca, Hamburg, Germany). For growth assessment of children, growth indices of height for age (HFA) and weight for height (WFH) were used. Study children were classified into three groups according to children's HFA and WFH compared to the 10th and 90th percentiles of the 2007 Korean Children and Adolescent Growth Standard. Children with growth percentiles less than the 10th percentile were classified into the low group while those with growth percentiles equal to the 90th percentile or higher were in the high group. Unfavorable growth status was defined as low HFA, low WFH, or high WFH. Dietary intake data were obtained by using the one day 24-hr recall method. All participants were requested to maintain their usual diets, and experienced interviewers instructed participants to recall and describe every food and beverage consumed during the previous 24 hr. Food models and measuring bowls, cups, and spoons were used to assist estimation of portion sizes. Micronutrient intakes were compared to Estimated Average Requirement (EAR) and Recommended Nutrient Intake (RNI) to evaluate nutrient adequacy according to age and sex.
Statistical analysis
All estimates were produced to represent the Korean population using sample weight. Descriptive statistics were presented as percentage frequency or mean and standard error (SE). Analysis of covariance (ANCOVA) was applied using a multivariate regression model to control for confounding variable, age, in comparison with nutrient intake according to growth status. The risk estimates of inadequate nutrients below EAR and unfavorable growth status were presented as odds ratios (ORs) and 95% confidence intervals by household income levels. The logistic regression model was used for multivariate analysis to calculate ORs controlling for sex, age, region, and energy intake. Statistical significance was set at P < 0.05. Pooled weight was calculated to analyze the combined data set of the 2009-2011 KNHANES with consideration for the number of sample units. Taylor series method was applied to account for the multistage clustered sampling design. All analyses were performed by using SAS 9.3.
RESULTS
Characteristics of subjects
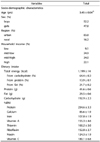
The general characteristics of the subjects are shown in Table 1. Average monthly household incomes in each income group were 1,135,838 won for low, 2,244,401 won for mid-low, 3,563,878 won for mid-high, and 9,686,570 won for high. The subjects were aged approximately 3 years, and the proportion of boys was 52.2%. About 69% of subjects were in the middle level of household income, and the proportion of those with low household income was relatively low at 9%. The mean value of total energy was 1,198.9 kcal, and the percentages of carbohydrates, protein, and fat from energy intake were 64.4%, 13.9%, and 21.7%, respectively. Lower percentage of RNI was measured for calcium at 85.6 ± 1.9%.
Nutrient intakes and growth
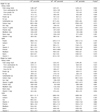
Nutrient intakes according to growth status are presented in Table 2. The nutrients showing significantly different intakes by HFA status were total energy, carbohydrates, and thiamin. The low HFA group had lower intakes of nutrients as compared with the high HFA group. In terms of WFH status, vitamin C intake was lower in the low group than high group (62.2 mg versus 80.3 mg). The percentage of RNI was different for thiamin between groups by HFA status (P = 0.033) as well as vitamin C between groups by WFH status (P = 0.036), which showed relatively lower intakes in the low than high group.
Income status, nutrient intakes, and growth status
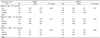
Table 3 presents the effects of household income on unfavorable growth status. Household income level was not related to low HFA. However, in terms of WFH, risk of high WFH was associated with lower household income status (P for trend = 0.038). Children in the lowest household income level were 2.34 times more likely to have high WFH than those from higher household income (95% confidence interval 1.15-4.75).
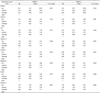
The effects of household income on inadequate nutrient intakes less than EAR are shown in Table 4. Household income level was not associated with energy intake (data not shown), whereas children from lower household income tended to have higher odds of inadequate nutrient intakes than those from higher household income. Lower household income status was significantly related to increased risk of inadequate protein (P for trend = 0.021), thiamin (P for trend = 0.018), and vitamin C (P for trend = 0.001) intakes. Logistic regression model adjusted for sex, age, and region shows similar risk estimation as the unadjusted model (data not shown). After controlling for energy intake, significance of risk for inadequate protein intake disappeared while those for thiamin (P for trend = 0.032) and vitamin C (P for trend = 0.002) remained.
DISCUSSION
There are avoidable differences in health status that are mostly due to living and working conditions, and inequalities cause prominent differences in quality of life among people. Therefore, the WHO commission on social determinants of health has recommended several principles to close the health gap within this generation, one of which is to improve daily living conditions from early life since experiences in early childhood lay foundations for health in later life [16]. The current study examined the effects of dietary intake on growth status by income level, a social determinant of health. Study results show that energy intake determined linear growth, and thin children had lower intakes of micronutrients such as vitamin C. Children from lower income households had higher risks of inadequate intake of micronutrients and overweight tendency.
In early childhood, adequate energy and nutrient intakes result in healthy growth and development of the brain, bones, and immune system. Traditional studies on malnutrition of children have focused on extreme cases, but mild malnutrition also deserves attention. If inadequate intake is not temporary but prolonged, then it may lead to poor physical and intellectual development [17].
Furthermore, many studies have showed that episodes of hunger and food insecurity, which are important causes of malnutrition, are associated with risk of overweight or obesity as well as stunting or wasting [181920], which is known as the double burden of malnutrition. The reasons have been explained by metabolic changes from chronic under-nutrition such as higher susceptibility to lower fat oxidation, higher central fat, and higher body fat gain [21]. Another explanation could be that hunger, which is a stressor, make one eat uninhibitedly or excessively to cope with stress [2223]. Further, those who are often hungry may purchase cheap and high energy-dense foods due to their limited economic resources, resulting in weight gain [424].
At the national level, double nutritional burden weighs heavily on middle income countries under rapid nutrition transition. While underweight remains a major nutritional and health problem, the burden of overweight is emerging in these countries [25]. Further, the double burden phenomenon is more apparent in populations of low socioeconomic status in industrialized countries [262728]. Many studies have showed that children in lower socioeconomic households consume more unhealthy foods [12293031], and this disparity among socioeconomic groups could widen the gap in health outcomes such as obesity [30].
Interestingly, the double burden is observed at an individual level. Stunting and obesity may coexist within a person in different stages of life (i.e. stunting in early life has been observed to be associated with obesity in later life.) [28] Several studies have suggested that risk of obesity in childhood according to socioeconomic status increases the risk of adolescent overweight and obesity and cannot be modified by socioeconomic status acquired in adulthood [323334]. The more prevalent type of double burden is overweight accompanied by under-nutrition of micronutrients, which is of concern since micronutrient deficiencies increase risk of chronic diseases [35].
Recently, problems associated with malnutrition have increased in Korea. Children from households of low economic status or food insecurity are more likely to consume unhealthy foods [12] and be overweight [1314]. Therefore, in future research, understanding the mechanism of their malnutrition with persistent monitoring of development outcomes for children, especially those in lower income households, is necessary to prevent further increases in health inequalities through nutritional disparity among different socioeconomic status groups.
There were several limitations in this study. First, this study used data from the KNHANES with one-day dietary intake. Thus, dietary intake data could not represent usual intakes and may actually misclassify the nutritional status of the subject. Although misclassification of the subject might weaken any association, it might not distort the direction of the association. Second, a causal relationship could not be established due to the nature of the cross-sectional study design of the KNHANES. Further, the observed associations may not be free from counter causality. Third, associations of socioeconomic status with nutritional status or growth were tested independently but did not guarantee nutritional status of the association between socioeconomic status and growth.
Nevertheless, to the best of our knowledge, this is the first study that evaluates the associations among socioeconomic status, nutritional status, and growth among Korean toddlers and preschoolers using population level data. The current study confirms that nutritional and health disparities exist in younger children and suggests that collective actions in public sector are required from early life in order to address health inequities beyond inequalities. Study results will shed light on intervention strategies to advocate healthy growth for children in all socioeconomic groups.
 XML Download