

 PDF
PDF ePub
ePub Citation
 Print
Print


INTRODUCTION
Water is vital for all known forms of life, including humans, and the largest single component of the human body; further it is an important vehicle for nutrients. To prevent metabolic and functional abnormalities, therefore, adequate water intake is imperative. For this reason, many countries established the Adequate Intakes (AIs) for daily water intake. The Korean nutrition society suggests AIs for water intake, including plain water, food water, beverage and alcohol drinks [1]. The AI of water intake for women at the ages 19-29yrs, 30-49yrs and 50-64yrs are 2,100 ml, 2,000 ml, and 1,900 ml, respectively. The AI of water intake for men at the ages 19-29yrs, 30-49yrs, and 50-64yrs are 2,600 ml, 2,500 ml, and 2,200 ml, respectively. The European Food Safety Authority (EFSA) sets AIs of 2 L/day for adult women and 2.5 L/day for adult men, including water from all drinks and foods, in the European Dietary Reference Values (DRVs) for nutrient intakes [2]. The panel on the Dietary Reference Intakes for Electrolytes and Water established the reference of water intake in its 2004 report. In DRIs, AIs of water intake are 2.7 L/day for adult women and 3.7 L/day for adult men, including all beverages, as well as moisture in foods [3]. It should be noted that AIs for water intake were established in the light of total water intake, including solid foods, free water and other fluids. Therefore, plain water intake may account for 30 to 40% of its AIs [1].
In contrast, the exhortation, drinking at least eight glasses of water a day, which is used in order to enhance health and gain advantages of water intake in body weight management, encourages more water intake than recommended by the AIs for daily water intake. However, obvious evidences concerning the benefits of drinking 8 cups of water have not been found [4].
Several studies suggest that many factors, including physiological, geographical and socio-cultural characteristics, influence plain water intake. According to the study of Ji et al. [5], the total amount of water showed a decreasing tendency in adults older than 50, males had a tendency to drink more than females, and people had a tendency to drink more plain water in the summer than in the winter among Koreans. Kant et al. [6] suggest that plain water intake was unrelated to sex, race, BMI (Body Mass Index), energy intake, energy from fat, caffeine, alcohol and smoking, but was positively related to year of education, protein, dietary fiber and sodium and inversely related to age, beverages, carbohydrate, sugars and the energy density of foods in NHANES 2005-2006. In another study, water consumers who consumed water as a beverage drank fewer soft/fruit beverages, consumed less energy per day, consumed more fruits, vegetables, and low- and medium-fat dairy products, and showed distinct healthy dietary patterns [7].
However, although many studies have examined the association of beverage consumption with various demographic, eating behaviors, dietary intake, physical activity, etc. [8,9,10,11,12,13,14,15], a few studies have been conducted to examine the association between plain water intake and these factors [5,6,7,16]. Furthermore, there is only limited understanding of how much people who have particular characteristics, such as life style, anthropometric, dietary, and food consumption characteristics, consumed plain water. There is also limited information on the extent to which various demographic, life style, anthropometric and dietary characteristics are associated with plain water intake among Koreans.
Therefore, the present study was conducted to provide the basic information on the plain water intake of Korean adults: 1) plain water intake status of Korean adults; 2) the relationship between plain water intake and life style characteristics; 3) the relationship between plain water intake and anthropometric characteristics; 4) the relationship between plain water intake and dietary characteristics.
SUBJECTS AND METHODS
Study population
The data used in this study were from the Korea National Health and Nutrition Examination Survey (KNHANES) conducted by the Ministry of Health and Welfare. The KNHANES was conducted in order to assess Korean health and nutritional status as well as health-related awareness and behavior. KNHANES has been operated by a 3 year cycle survey system from 1998 to 2005, and since 2007, it has been carried out annually. The KNHANES consists of a health interview, health examination and dietary interview. The subjects were aged ≥ 1 and were from stratified multistage samples of the South Korean population from multiple geographic areas, ages and both genders. The sample does not include persons residing in nursing homes, members of the armed forces, prison, etc. This study was conducted with the data from 2008, 2009 and 2010 KNHANES.
Participants who were aged 20-64 years and completed a 24-hour dietary recall were included in this study (n = 14,516). We excluded subjects who reported implausible calories less than 500 kcal (n = 88). The final subjects were 5,917 men and 8,511 women.
The present study was conducted according to the guidelines laid down in the Declaration of Helsinki and all procedures involving human subjects were approved by the Institutional Review Board of the Korea Centers for Disease Control & Prevention. Written informed consent was obtained from all subjects.
General characteristic, anthropometrics and biochemical variables
Data from a health interview and a health examination survey were used in order to obtain information on smoking, alcohol intake, education, moderate physical activity, presence of chronic disease, hours of sunlight exposure and anthropometric measurements. Participants were weighed in kilograms using a digital weight scale to the nearest 0.01 kg in light clothing without shoes, and height was measured within 0.1 cm using an anthropometer with a fixed vertical backboard and an adjustable head piece. Body mass index (BMI) was calculated as weight (kg)/height (m2). Classification of weight by BMI was underweight (< 18.5 kg/m2), normal range (18.5- < 23 kg/m2), preobese (23- < 25 kg/m2) and obese (≥ 25 kg/m2) [17]. Waist circumference (WC) was measured according to the World Health Organization (WHO) guidelines at the end of a normal expiration. Lean body mass and percentage of body fat were measured by DXA (DISCOVERY-W fan-beam densitometer, Hologic, Inc., USA). In men, the classification of weight by percentage of body fat was underweight (< 10%), normal range (10- < 20%) and obese (≥ 20%) [18,19]. In women, the classification of weight by percentage of body fat was underweight (< 18%), normal range (18- < 28%) and obese (≥28%) [18,19].
Dietary data
Water and nutrition intake and food consumption frequency data were obtained by a nutrition survey. Detailed procedures were explained elsewhere [20,21]. The subjects were asked "How much water do you usually consume per day?" in the dietary survey. Due to the fact that Korean people drink barley tea, cassia seed tea and corn tea as plain water, water intake included plain water, barley tea, cassia seed tea, corn tea, etc. Based on determinants of water requirements in the Institute of Medicine report, we selected dietary variables such as intakes of energy, fat, carbohydrate, protein, fiber, sodium, and 24-h alcohol except for caffeine [3]. Since KNHANES did not estimate caffeine intake, we could not use the data on caffeine intake.
Statistical analysis
All statistical analyses were performed using the SAS software (version 9.3; SAS Institute, Cary, NC). The data were expressed as Means ± SD. Analysis of Covariance (ANCOVA) was applied to determine the differences in means of plain water intake. Tukey's multiple comparison test was applied to search for specific differences between pairs of groups at P < 0.05. Nutrient intakes were adjusted for a total energy intake by the residual method [22]. Individual Nutrient Adequacy Ratio (NAR) was calculated based on the Recommended Nutrition Intake (RNI) of each nutrient, including protein, calcium, iron, phosphorus, vitamin A, thiamine, riboflavin, niacin and vitamin C [1]. Mean Adequacy Ratio (MAR) was the mean of nine NARs. MAR was an index representing diet quality. High MAR scores implied high quality diet.
RESULTS
Plain water intake according to the general characteristics
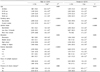
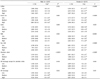
Men comprised 41% of the total subjects, and consumed more plain water than women. The mean plain water intake for men and women were 6.3 cup/day (17.9 ml/kg body weight) and 4.6 cup/day (15.9 ml/kg body weight), respectively. Plain water intake of subjects, according to the general characteristics, is shown in Table 1. The means of plain water intake decreased with increasing age in men and women. Current smokers and current alcohol drinkers consumed more plain water than non-smokers and non-drinkers. People who exercised more drank more plain water for both men and women. In men, the high sunlight exposure group consumed more plain water. In women, those who had chronic diseases consumed more plain water.
Plain water intake according to anthropometric measurements
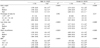
Plain water intake increased as weight, lean body mass and WC increased and BMI levels increased in women, except for the percentage of body fat (Table 2). Plain water intake did not differ by the percentage of body fat in men and women.
Plain water intake according to nutrients intake and diet quality
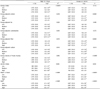
Plain water intake of subjects according to nutrient intake and diet quality (MAR) estimated by a 24-hr recall are presented in Table 3. Plain water intake increased as sodium intake, water in food and MAR increased in men and women. However, plain water intake decreased as the energy density of food consumption increased. It should be noted that 'water in foods' included beverages, such as soda, milk, alcoholic drink, etc. in KNHANES. Plain water intake increased as energy and alcohol intake increased, whereas energy-adjusted fat and energy-adjusted carbohydrate consumption decreased in men. Plain water intake increased as energy-adjusted protein and energy-adjusted fiber consumption increased in women.
Plain water intake according to food intake and type of foods
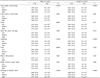
Depending on the weight of food, the volume of food and types of foods, the subjects had different plain water intakes (Table 4). Plain water intake significantly increased as the weight of food (males and females), the volume of food (males), and consumption of protein foods (males) increased. Plain water intake was increased as consumption of vegetable was increased in men and women. Plain water intake decreased as fruit intake increased in men. In beverage and alcoholic drinks, men and women showed different patterns. As consumption of beverage and alcoholic drinks was increased, men consumed more plain water while women consumed less plain water.
Plain water intake according to frequencies of beverage and alcoholic drink consumption
Plain water intakes of subjects according to frequencies of beverage and alcoholic drink consumption are shown in Table 5. In male subjects, plain water intake increased as frequencies of green tea, alcoholic drink and all beverages were increased. In female subjects, plain water intake increased with increased frequencies of green tea, milk, soy milk, and alcoholic drinks and decreased frequencies of coffee and soda.
DISCUSSION
The present study was conducted to provide useful insights into plain water intake of Korean adults according to life style, anthropometric and dietary characteristics. Plain water intake decreased with increasing age; however, plain water intake increased with drinking alcohol. Current smokers consumed more plain water than non-smokers. Plain water intake of subjects having larger waist circumference or lean body mass and female subjects with high BMI level consumed more plain water; yet, plain water intake did not differ by the percentage of body fat. The more the subjects ate large amounts of foods or balanced meals, the more the subjects consumed plain water. Plain water intake was different according to particular types of foods or nutrients.
The means of usual plain water intake for men and women were 6.3 cup/day (1,260 ml) and 4.6 cup/day (920 ml), respectively. Plain water intake differed by age group. In particular, the means of water intake decreased with increasing age in men. Ji et al. [5] also observed a gradual decrease of water consumption in the Korean older population. What We Eat In America reported that water consumption decreased gradually depending on the increasing age in men and women after their 20s [23]. Increased thirst is natural defense mechanisms against dehydration and hypernatremia under normal physiological conditions. However, compared with the young group, the old group was less thirsty and drank less water [24,25]. Disturbances in homeostasis are a phenomenon of the ageing process. Evidences suggest that the elderly have a higher baseline osmolality and thus a higher osmotic operating point for a sense of thirst with little or no change in sensitivity, and indicate dwindled thirst in response to hypovolemia and hypervolemia of baroreceptors [26]. Several studies have shown that the sense of thirst was dwindled in the elderly with high serum sodium and osmolality levels even in healthy old persons [24,25,27,28]. For this reason, the means of water intake might be decreased as age increased.
In the present study, plain water intake increased as frequency of alcohol intake and amount of alcohol intake increased in men and women. Current smokers had a higher intake of plain water than non-smokers, which was a different result from a previous study. Kant et al. [6] observed that current smokers had a higher intake of beverages and total water; however, the intake of plain water was not different between current smokers and non-current smokers. Smoking status seems to have relevance to the increase in the weight of fluids ingested per day [16]. Smokers consumed more alcohol [29,30,31,32,33,34,35,36], coffee and tea [30,35,36] compared to non-smokers. Further studies on the relationship between plain water intake and smoking are necessary.
Subjects with high body weight, lean body mass or waist circumference and female subjects with high level BMI consumed more plain water than subjects with low body weight, lean body mass, waist circumference or BMI; however, any significant associations between percentage of body fat and plain water intake were not found. Kant et al. [6] reported that plain water intake was positively related to BMI in NHANES 1999-2004; yet, this association was not found in NHANES 2005-2006. The relation of body composition or body size to water intake remains controversial.
Plain water intake increased as energy adjusted protein intake consumption increased in female subjects and intake of protein rich food increased in male subjects. As for men, there was no association between water intake and energy adjusted protein intake. In another study, dietary protein (as percentage of energy) was positively related to plain water intake [6]. In experiments on laboratory cats, water intake and urine volume increased as intake of dietary protein increased during the consumption of the same amount of food. To excrete urea, which is the end product of protein metabolism, water is required 40 to 60 ml per 2.2 g urea. High-protein diets could stimulate water intake by increasing plasma osmolality or failing to concentrate from increased urinary urea excretion. However, since urine volume can be also various in accordance with the other macronutrients, salt and water load [3], it is hard to say that the cause of increased water intake was dietary protein.
In the present study, people who consumed more vegetables and fiber or less energy density foods showed higher plain water intake, whereas the male subjects with low fruit intake showed higher water intake. Popkin et al. [7] have found that twice the amount of vegetables was consumed by water consumers who consumed water as a beverage in comparison with non-consumers of water. However, there was no difference in the amount of fruit intake between water consumers and water non-consumers, which attribute to the fact that people may eat fruits instead of water.
People who ingested more sodium consumed more plain water in the present study. Several studies reported that sodium intake affected water intake in human subjects. A study demonstrated that the renal excretion of water increased as salt intake increased, which explained that salt intake is a major factor in regulating urinary volume and fluid intake [37]. However, Luft et al. [38] have reported that there was no provable effect of sodium intake on water consumption and urine volume. In addition, other study reported that the association between plain water intake and energy-adjusted sodium intake was not significant, and there was an inverse association between moisture in beverages and energy-adjusted sodium [6].
Plain water intake increased as energy intake (males), the weight of food (males and females) and the volume of food (males) increased. However, several studies have shown different results. Dietary energy intake was not associated with plain water intake [6], whereas total daily energy intake of water consumers was much smaller than water non-consumers [7].
People with a high MAR score, which is a diet quality index, consumed more plain water, implying that people fulfilling their dietary requirements on various nutrients drank more plain water. People who consumed more green tea, milk and soy milk drank more plain water. In female subjects, people who consumed more coffee or soda drank less water.
The limitations of the study need to be considered when interpreting the findings. Plain water intake was obtained by asking the question "How much water do you usually drink on a daily basis?" while nutrients intake and foods intakes were estimated by a 24-h recall method. In addition, food consumption frequencies of beverage and alcoholic drink were additionally obtained by the food frequency questionnaire. Therefore, the reference periods for plain water intake and 24-hr recall method were different. In addition, because of the large day-to-day variability of food and nutrient intakes, a single 24-h recalls does not provide precise estimates of usual intake. Second, because it was a cross-sectional study, we cannot conclude the causality of plain water intake and anthropometry, nutrient intake or food intake. Third, the season of examination was not considered in the data analysis, even though relatively little seasonal variation in plain water intake among adults were found in other national surveys [39].
Despite these limitations, our results conveyed that plain water intakes for male and female Korean adults were 1,260 ml/day and 920 ml/day, respectively. Current smokers, current alcohol drinkers or people who exercised more drank more plain water. People who had high waist circumference or lean body mass and women with high BMI level consumed more plain water. People eating a high quality diet, or those who consumed more vegetables, green tea, milk, soy milk or alcoholic drinks consumed more plain water. Because the present study was based on a large, nationally representative sample, it provides the basic information on water intake of Korean adults. Further investigations, including clinical trials and longitudinal studies, are required to confirm these findings.
 XML Download