

 PDF
PDF ePub
ePub Citation
 Print
Print


INTRODUCTION
The daily sodium intake target for adults in Korea is 2,000 mg, while the adequate intake is 1,500 mg [1]. However, the daily sodium intake for children > 1 year of age has increased to 322.1% (4,830.5 ± 53.2 mg) in 2010 from 296.9% (4,452.9 ± 63.3 mg) in 2007 after peaking at 350.7% (5,260.2 ± 55.6 mg) in 2005 from 331.2% (4,966.9 ± 55.5 mg) in 2001 and 305.5% (4,581.6 ± 62.4 mg) in 1998 [2]. Excessive sodium intake is closely correlated with diseases since it raises one's risk of developing hypertension, cardiovascular diseases, and kidney diseases [3,4] and causes osteoporosis [5,6] by increasing calcium excretion [7,8,9]. The findings of one study on sodium metabolism indicating that 28% of 101 adults had salt sensitivity [10] prove the need to reduce sodium intake.
It is reported that if sodium intake is reduced, blood pressure will be reduced [11], as will the risks of heart attack and stroke [12]. In addition, if average sodium intake in Korea is decreased to 3 g per day, the direct and indirect financial benefit will be estimated at 3.14 trillion won owing to reduced disease prevalence [13]. However, research has shown that Koreans consume 57.8-60% or more of their sodium intake from kimchi, soups, stews, and hard-boiled dish owing to a growing increase in processed food consumption and the high salinity of Korean foods such as kimchi, sauces, pasts, and fermented fish as well as the intake of liquid-based foods such as soups, broths, and stews [14,15]. The sodium content of foods includes the sodium added during processing, cooking, and eating (discretionary sodium intake) as well as the amount in the food itself (nondiscretionary sodium intake). While the discretionary sodium in sauces accounts for 35-40% of the average daily salt intake in the US [16], it stands at a relatively high 72.8% in Korea [17].
Preliminary research on the sodium content in Korean foods revealed that the amount of sodium per portion was 1.4-3.5 g in soup, 1.5-4.4 g in stew, 0.6-1.5 g in kimchi, 0.5-3.5 g in hard-boiled foods, 0.8-2.4 g in stir-fried food, 0.4-1.1 g in boiled sang che, 1.4-3.6 g in fermented fish, and 1.5-5.0 g in one-dish meals [14]. In this regard, effort is required to reduce individuals' preferences for such salty foods. When attempting to consume foods with low sodium content for a certain period, the salt preference and sodium excretion was decreased [18], and it was possible that the preference of food was not affected by the reduced salt intake [19]. Therefore, it is necessary to seek measures to provide low sodium choices both at cafeterias and at home.
Cafeteria workers commonly use salinometers to measure the salinity of foods and reduce their content, but such results are not always accurate. Chemical analysis provides an accurate measurement but is uncommon owing to its high cost. Alternatively, it is possible to easily measure salinity by diluting the foods with water and multiplying by the dilution factor [20]. However, no data to date have determined the correlation between the measured and actual amounts of sodium using this method.
This study aimed to compare the sodium content determined by chemical analysis with the measured values of workplace and homemade meals and present the results as baseline data for reducing sodium intake.
SUBJECTS AND METHOD
Target selection and survey period
A survey was conducted on the workplace and homemade meals of the employees of 15 cafeterias of 8 districts in Daegu between July and December 2007. The cafeterias were selected in cooperation with the Public Health Division of Daegu Metropolitan City and provided official notices.
Food collection
A single portion of each workplace meal was collected during the lunch break for a total of 103 items: 19 rice, 3 one-dish meals, 6 soups, 5 broths, 6 stews, 4 steamed foods, 4 roasted foods, 4 stir-fried foods, 3 hard-boiled foods, 5 fried foods, 2 namuls, 8 sang ches, 2 salads, 20 kimchi, 6 sauces, 2 fruits, and 4 beverages.
A partial portion (30-50 g) of each meal consumed daily by each target subject in the program was collected and classified as a single portion based on the diet record. Each sample was placed in a labeled zipper-lock bag (name, date, meal type, food name, food intake per meal) and frozen. The collected foods included a total of 337 items: 65 rice, 4 one-dish meals, 25 soups, 3 broths, 11 stews, 9 steamed foods, 36 roasted foods, 20 stir-fried foods, 24 hard-boiled foods, 2 fried foods, 16 namuls, 20 sang ches, 3 salads, 45 kimchi, 9 sauces, 12 fruits, and 33 beverages.
Sodium content analysis
Sodium content was analyzed using chemical analysis and salinity measurement. The chemical analysis measured single food portions using an inductively coupled plasma optical emission spectrometer (IRIS II XSP; Thermo Scientific, USA) after preprocessing in accordance with the Association of Official Analytical Chemists act. The salinity measurement was taken using a salinometer (GMK-530; G-Won Hitech Co., Korea) after grinding it in the mixer with water and calculating the amount of sodium using the dilution rate [20]. The salinity of soups was measured after both liquid and solid ingredients were ground in the mixer.
Statistical analysis
Data processing was completed using SPSS version 19 (Statistical Package Social Science). The relevance of singleportion salinity and sodium content was proven by analysis of variance and Duncan's multiple range test for comparison by food group (P < 0.05), while the t-test was used to compare the 2 different analysis methods (P < 0.05).
RESULTS
Cafeteria characteristics
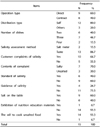
The characteristics of the participating cafeterias are shown in Table 1. The target cafeterias were composed of 60.0% directly operated food service providers and 40.0% contracted food service providers. Most (80.0%) were buffet style, and 3 side dishes was the most common offering (46.7%) with the exception of soups and kimchi. Most cafeterias (86.7%) depended on the chef's tasting for salinity measurement, while only 13.3% cafeterias actually conducted formal salinity measurements. As many as 66.7% of cafeterias regularly received complaints about the salinity of their foods (70.0% of responders complained about saltiness, while 30.0% complained about blandness). Most of the cafeterias (73.3%) failed to provide notices about the salinity of the foods they served, and more than half (60.0%) of the cafeterias allowed customers to arbitrarily add salt using saltshakers available on every table. Very few cafeterias (6.7%) provided educational materials about the benefits of eating bland foods, although 93.3% of cafeterias routinely refrained from using salt in cooking.
Sodium content in workplace menu items
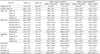
The sodium content by workplace menu item is shown in Table 2. The sodium content per 100 g was determined using salinity measurement and chemical analysis and revealed the following: sauces (3,126.7 ± 2,049.1 mg and 3,362.0 ± 1,983.6 mg), kimchi (652.0 ± 196.4 mg and 641.0 ± 397.2 mg), side dishes (352.0 ± 667.4 mg, 488.9 ± 592.3 mg), and soups (263.5 ± 57.6 mg and 244.4 ± 114.3 mg), respectively (P < 0.001).
The sodium content per portion via solidity measurement was the highest in sauces (707.0 ± 321.4 mg), followed by soups (495.9 ± 119.3 mg), kimchi (263.4 ± 112.7 mg), and one-dish meals (253.5 ± 122.2 mg) (P < 0.001). The sodium content through chemical analysis was the highest in sauces (792.6 ± 492.6 mg), followed by soups (458.5 ± 204.2 mg), one-dish meals (285.2 ± 151.6 mg), and kimchi (262.5 ± 176.7 mg) (P < 0.001).
The sodium content by food groups within the menu did not differ among soups, broths, and stews (Table 2), among side dish types, or between analytical methods. The sodium content by food groups did not differ significantly among soups, broths, and stews by the different methods. The chemical analysis value was the highest in stir-fried foods (333.8 ± 162.2 mg) among the general side dishes, followed by hard-boiled food (294.0 ± 69.4 mg), steamed food (221.9 ± 130.9 mg), roasted food (131.2 ± 46.9 mg), and fried food (116.3 ± 80.9 mg) (P < 0.05). Salinity measurements of the vegetable side dishes revealed that namul contained the highest amount of sodium (263.7 ± 236.3 mg), followed by sang che (55.2 ± 58.7 mg) and salads (53.6 ± 75.9 mg) (P < 0.05). In chemical analysis measurements, namul again had the highest sodium content (431.9 ± 74.7 mg), followed by sang che (109.5 ± 103.8 mg) and salads (84.5 ± 43.0 mg) (P < 0.01). The sodium content of the roasted foods per portion was 131.2 ± 46.9 mg by chemical analysis and 56.1 ± 27.5 mg by salinity measurement (P < 0.05).
Sodium content by homemade menu item
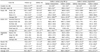
The sodium content by menu item of the homemade meals is shown in Table 3. On salinity measurement, sauces contained the highest amount of sodium (2,412.4 ± 2,555.5 mg), followed by kimchi (690.5 ± 387.6 mg), side dishes (396.4 ± 476.1 mg), and soups (361.9 ± 189.9 mg) (P < 0.001). On chemical analysis, sauces had the highest sodium content (2,209.0 ± 1,514.9 mg), followed by kimchi (862.7 ± 752.4 mg), side dishes (836.3 ± 1,032.6 mg), and soups (322.6 ± 27.8 mg) (P < 0.001).
The sodium content per 100 g of food through salinity measurement was the highest in sauces (2,412.4 ± 2,555.5 mg), followed by kimchi (690.5 ± 387.6 mg), side dishes (396.4 ± 476.1 mg), and soups (361.9 ± 189.9 mg) (P < 0.001).
The sodium content per portion using chemical analysis was the highest in sauces (2,209.0 ± 1,514.9 mg), kimchi (862.7 ± 752.4 mg), side dishes (836.3 ± 1,032.6 mg), and soups (322.6 ± 27.8 mg) (P < 0.001).
The sodium content per portion by salinity measurement was the highest in soups (420.4 ± 267.8 mg), sauces (327.4 ± 322.2 mg), kimchi (287.4 ± 215.3 mg), and one-dish meals (113.5 ± 37.2 mg) (P < 0.001).
Chemical analysis revealed that one-dish meals had the highest sodium content (451.8 ± 303.0 mg), followed by soups (376.9 ± 291.1 mg), kimchi (342.1 ± 333.6 mg), sauces (315.8 ± 264.4 mg), and side dishes (159.8 ± 146.3 mg) (P < 0.001).
The analysis of the different sodium contents by food group is shown in Table 3. The sodium content per 100 g of food differed among soups, broths, and stews according to salinity measurements and chemical analysis (P < 0.05): overall, 369.3 ± 8.3 mg vs. 252.3 ± 11.2 mg, respectively (P < 0.001); roasted foods, 496.9 ± 497.0 mg vs. 1,003.7 ± 1,204.0 mg, respectively (P < 0.05); and hard-boiled foods, 411.7 ± 533.6 mg vs. 1,012.7 ± 1,185.1 mg (P < 0.05).
In the comparison of sodium content per portion by food groups by measurement methods, broths had a measured value of salinity of 643.7 ± 19.3 mg and chemical analysis value of 440.0 ± 25.1 mg, demonstrating that the measured value of salinity was higher than the other (P < 0.001). Hard-boiled foods had 73.6 ± 73.5 mg as a measured value of salinity and 140.7 ± 87.8 mg as a chemical analysis value, showing that the chemical analysis value was higher than the other (P < 0.01).
Comparison of salinity and sodium content between workplace and homemade meals
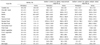
The comparison of sodium content by food groups in workplace meals and homemade meals is shown in Table 4.
Comparison of salinity by food groups in workplace and homemade meals revealed that workplace one-dish meals (0.3 ± 0.1%, 0.2 ± 0.1%) had higher salinity (P < 0.05) while homemade broths (0.6 ± 0.1%, 0.9 ± 0.0%) and stews (0.7 ± 0.2%, 1.2 ± 0.4%) had higher salinity (P < 0.01).
The sodium content per 100 g of foods by salinity measurement differed among one-dish meals (109.3 ± 20.1 mg and 60.0 ± 3.1 mg), broths (234 ± 44.2 mg and 369.3 ± 8.3 mg), and stews (268.7 ± 60.9 mg and 478.2 ± 166.0 mg), respectively. One-dish workplace meals had higher sodium content, while homemade broths and stews contained more sodium (P <0.05 and P <0.01, respectively). However, the sodium content per 100 g of foods detected by chemical analysis did not differ between workplace and homemade meals.
DISCUSSION
Research has shown that the sodium content in 100 g of each food group in workplace and homemade meals was the highest in sauces, followed by kimchi, side dishes, soups, broths, and stews, both in terms of measured salinity and by chemical analysis. Sauces, soups, kimchi, and one-dish meals contained higher levels of sodium per serving (P < 0.001) regardless of the setting or measurement method. This indicates that sauces, which had 10-20 times higher salinity and sodium content per 100 g, likely comprise a large proportion of an individual's daily sodium intake. One-dish meals and soups, which tend to have high salt content as well, also likely affect sodium intake compared to other foods.
According to one study on sodium intake using a diet record method in 236 female adults, the subjects consumed most of their sodium intake via sauces and spices [15]. This finding is similar to survey results showing that Koreans consume more of their daily sodium from kimchi (34.2%) than any other food category [15]. According to Moon et al. [21], in 162 seniors aged > 65 years, kimchi (28.3%) contributed most to sodium intake, followed by soups and broths (22.85%), stews (9.79%), sauces (8.23%), namul (6.01%), and roasted foods (4.55%). According to research on one-dish meals and sodium intake in Koreans based on 2008-2009 Nutrition Examination Survey data, consumers obtained the most sodium from kimchi (24.5%; 1,125 mg), followed by noodles and dumplings (12.4%; 572 mg), soups and broths (10.6%; 488 mg), and stews (8.7%; 399 mg) [22]. Since all of these results regarding sodium consumption in Koreans are similar, effort is required to reduce sodium intake by decreasing the salinity in the traditional foods and kimchi as well as reducing salinity and the quantity of liquid included in soups per serving.
At the cafeterias, the sodium content per portion of general side dishes was the highest in stir-fried foods, followed by hard-boiled, steamed, roasted, and fried foods (P < 0.05). Among the vegetable side dishes, namul had the highest sodium content both by salinity measurement and chemical analysis, followed by sang che and salads (P < 0.05 and P < 0.01, respectively), which indicates that the differences in serving size by food type affected the sodium content (P < 0.05).
The sodium content in 100 g of workplace food did not differ significantly between methods except for roasted foods, which had a value that was 233.9% higher on chemical analysis than using the salinity method (P < 0.05). Homemade broths had a 146.4% higher value of sodium content per 100 g by salinity measurement than by chemical analysis (P < 0.001), while roasted and hard-boiled foods had around 202.0% and 246.0% higher values of chemical analysis than the measured value of salinity (P < 0.05). These values appeared to differ between the 2 measurement methods as a result of food additives within the processed foods.
Comparison of the sodium content of homemade meals through these 2 analysis methods revealed significant differences between broths and hard-boiled foods. Again, broths had a 146.3% higher salinity value (P < 0.001) than chemical analysis value, while hard-boiled foods had a 191.2% higher value on chemical analysis (P < 0.01). Since Korean meatballs are among the roasted foods in workplace meals and roasted laver, Korean meatballs, and tteokgalbi (grilled short rib patties) among the homemade meals are processed foods, we suspect that they may have been the cause of the increased sodium content detected by chemical analysis. This may be further evidenced by the high sodium content of processed foods including hard-boiled saury, tofu, and fish cake included among the hard-boiled foods.
If the meal items included food additives or if the cooking method used a large amount of commercial sauces during processing, the sodium content level detected by chemical analysis increased more than that on salinity measurement. Kwon et al. [23] compared estimated and actual values of sodium in the Food Exchange System and Food Composition Table by food and food groups and reported a huge gap between them (53-252%).
On the other hand, fruits had a lower value on chemical analysis than on salinity measurement (2.5 ± 0.7 mg to 3.4 ± 1.8 mg vs. 24 ± 33.9 mg to 36.3 ± 54.9 mg per 100 g, respectively). Although differences by type were minor, grape, orange, and tomato juices had higher actual measured value than estimated value [23]. In terms of namul, sodium levels were not obtained prior to cooking but were definitely increased by the addition of sauces during the cooking process.
Despite multifaceted efforts to reduce sodium intake, it is not easy to accurately measure the sodium content in foods except for processed foods in daily life. If Koreans are willing to reduce their sodium consumption by checking the sodium content before eating foods, a consequent increase in benefits is expected.
Increasing one's potassium intake by consuming more vegetables and fruits to reduce sodium intake is recommended. However, since the addition of extra sauce during cooking may encourage a rather higher sodium intake, extra care is required. Care should be taken to not add a large amount of sodium while cooking dried fish or seaweed, which is already high in sodium. In consuming such high sodium foods, the inclusion of sang che, which is high in potassium and low in sodium, in one's diet is desired.
Given the commonly accepted idea that foods are best served properly seasoned, the promotion via mass media of how to eat bland foods and the emphasis on developing and supplying sauces with reduced sodium content is required in the food industry. The food items proposed in this study were limited since they were measured on the basis of employees' workplace and homemade meals. The use of a salinometer to measure salinity and estimate the sodium content in foods is also recommended to help individuals control their sodium intake. However, differences between the estimated and actual measured values are possible.
 XML Download