

 PDF
PDF ePub
ePub Citation
 Print
Print


INTRODUCTION
As a physical transition period, adolescence is characterized by speedy growth and vigorous activity, which require increased intake of nutrients. The dietary habits formed during this time not only affect long-term health and dietary behaviors but also play a crucial role in maintaining mental and emotional stability [1]. Students usually judge their choice of foods on convenience and palatability rather than on balanced nutrition. Recently, intake of convenient foods by students has rapidly increased along with avoidance of vegetables [2]. It was previously shown that middle and high school students that eat alone do not intake as many essential nutrients as those eating meals with their families. Especially, intake levels of calcium, folic acid, and vitamin C were shown to be lower than half of recommended intakes [3]. Such nutritional imbalance can be attributed to frequent skipping of meals, poor breakfast habits, irregular meal times, excessive pressure on academic and career issues, and excessive intake of junk food [4]. The 2008 Korean National Health and Nutrition Examination Survey showed that the percentages of boys and girls aged 12 to 18 who eat breakfast, lunch, and dinner without their families at least 4 days per week are 44.5%, 98.7%, and 37.7%, respectively [5]. Under these circumstances, proper care and dietary habits are neglected, which induces nutritional imbalance and increases the risk of various adult illnesses. Further, bad dietary habits are known to have adverse effects on personality development. Previous research has suggested that proper education in both the home and school promoting good dietary habits is critical to personality development in adolescence [6]. Personality factors that are correlated with dietary habits include conscientiousness, extroversion, agreeableness, emotional stability, and openness/intellect, in descending order. Previously, a study found that general personality traits such as safety, dominance, sociability, responsibility, and thoughtfulness are positively correlated with improved dietary habits in elementary school students, whereas activity is not [7]. Further, negative psychological behaviors such as juvenile delinquency rapidly increase during teenage years in association with intake of junk food due to increased anger rather than the normal emotional instability or impulses of youth [7]. According to a study on the effects of family meals on dietary habits in middle and high school students, the frequency of family meals positively affects emotions, attitudes, and behaviors, and as frequency of family meals increases, so does life satisfaction, psychological comfort, and positive family bonding [3]. Food neophobia is the fear of eating new or unfamiliar foods. It differs from selective eating disorder. Food neophobia is particularly common in toddlers and young children. It is often related to an individual's level of sensation seeking, meaning a person's willingness to try new things and take risks. Not only do people with high food neophobia resist trying new food, they also rate new foods that they do try as lower than neophilics [8]. If family meal frequency is indeed correlated with good dietary habits, then a higher family meal frequency will elevate dietary behaviors in adolescents. Assuming that family meals are a starting point for maintaining a mentally and physically healthy life, this study focused on the relationships between family meal frequency as well as food neophobia and personality development in adolescents.
SUBJECTS AND METHODS
Subjects
This study conducted a survey targeting 495 male and female middle school students in Seoul from May 10, 2010 to June 5, 2010. Except for eight poorly completed questionnaires, 487 questionnaires (98.4%) were used for the data analysis.
Contents of survey
The questionnaire used in this study was constructed using questions suitably developed specifically for the purpose of this study and based on previous studies [3,6,8,9,10,11,12]. There were a total of 88 questionnaires containing 10 questions on general subject characteristics, 24 questions on family meal patterns, 14 questions on dietary habits, 30 questions on personality, and 10 questions on food neophobia.
We surveyed each subject's family meal patterns, including meaning of family meals, number of meals eaten with family per week, reasons for lack of family meals, family meal location, etc. based on a previous questionnaire [3,9]. We also measured perception of family meals using Likert five-point scale criteria.
To measure each subject's dietary habits, 14 questions on dietary habits were included based on other studies [10,11]. We also created a point scale based on the frequency of family meals per week in which '0-2 days' is 1 point, '3-5 days' is 2 points, and '6-7 days' is 3 points. Some items were reversely coded. Using our scale, a higher average score means better dietary habits.
To survey the personality traits, we measured five factors of personality using the California Q-set (John, 1994) modified based on previous models [6,12]. Six items for each of the five factors were measured using the Likert five-point scale. A higher score means favorable personality traits.
With respect to food neophobia, we revised the 10 items of the food neophobia scale (FNS) from Pliner, Hobden (1992) [14].
Statistical analysis
This study performed descriptive statistics and hypothesis testing using the SPSS package (version 18.0) program. We calculated the total numbers and percentages of family meals. One-way ANOVA was performed in order to investigate differences among dietary habits and food neophobia according to family meal frequency. Regarding personality traits, the mean and standard deviation (SD) were calculated for each of the five factors, and after which multivariate analysis of variance (MANOVA) was performed to investigate the differences among personality traits according to family meal frequency. We also performed Pearson's product-moment correlation analysis to investigate the relationships among dietary habits, personality traits, and food neophobia.
RESULTS
General characteristics of study participants
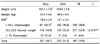
The subjects in this study included 237 boys (48.7%) and 250 girls (51.3%). According to the BMI (body mass index) classification standard for Asian adults, 52.8% (boys 49.8%, and girls 55.6%) were normal weight, 38.8% were underweight, and 8.4% were overweight (Table 1). The percentage of girls who were in the underweight and normal weight groups was higher than that of boys, whereas the percentage of girls in the overweight group was significantly lower than that of boys (P < 0.001). According to the survey, the average height of male subjects was 163.10 ± 7.8 cm, whereas that of females was 159.4 ± 5.8 cm. Further, the average weight of male subjects was 52.35 ± 9.57 kg while that of females was 48.60 ± 6.35 kg.
Conditions of Family Meals
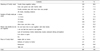
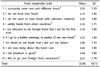
Regarding the meaning of family meals, 339 (69.6%) respondents selected 'family living together and eating' (Table 2). Regarding the number of family meals per week, 164 (33.7%) respondents selected '5-6 times a week', 113 (23.2%) selected 'more than one time per day', and 98 (20.1%) selected '3-4 times a week', in descending order. Regarding the reason for lack of family meals, 461 (94.7%) responded they 'do not have time to gather with their family', which can likely be attributed to differences in activities among family members. Regarding the location of family meals, 263 (54.0%) answered 'restaurants' while 173 (35.5 %) answered 'dishes made at home'.
Regarding perception of family meals, subjects with higher family meal frequency also showed significantly higher scores for 'family meals are fun', 'family meals encourage fellowship', and 'meal times provide time for talking to each other' compared to other groups (P < 0.001) (Table 3). On the other hand, subjects with higher family meal frequency showed lower scores for 'family meals do not mean more than filling the stomach' (P < 0.01). Subjects with higher family meal frequency showed positive perceptions of family meals, and conversation during family meals positively affected family intimacy.
Conditions of dietary habits
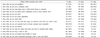
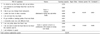
Conditions of dietary habits of study participants are shown in Table 4. The highest frequency of eating breakfast was 6-7 days per week (58.1%), frequency of eating moderate meals was 6-7 days per week (55%), skipping dinner due to after-school classes or tutoring was 1-2 days per week (69.2%), frequency of eating yellow green vegetables (such as carrots, spinach, etc.) was 3-5 days per week (50.9%), and frequency of eating fruit was 3-5 days per week (41.1%). White vegetables were eaten 3-5 days per week (47.6%), milk was consumed 6-7 days per week (36.6%), meat, fish, eggs, or soy products were eaten more than two meals a day 3-5 times per week (47.2%), seaweed (such as brown or laver seaweed) was eaten 3-5 days per week (43.7%), and kimchi was eaten 6-7 days per week (65.1%). Skipping meals due to concerns over body weight occurred 1-2 days per week (82.3%), snacks were eaten 1-2 days per week (49.5%), instant food (noodle or soup) was eaten 1-2 days per week (53.4%), carbonated beverages (such as cola or cider) were consumed 1-2 days per week (60.2%).
Personality Traits
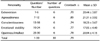
Reliability and descriptive statistics on personality traits are shown in Table 5. Cronbach's alpha coefficients for the five personality traits were as follows: extraversion 0.70, Agreeableness 0.85, Conscientiousness 0.74, Emotional stability 0.77, and Openness/intellect 0.78. Therefore, the data of this study showed high reliability. Average points were extroversion 20.44, agreeableness 21.31, conscientiousness 18.23, emotional stability 17.05, and openness/intellect 20.94.
Food neophobia
Table 6 shows the descriptive statistics from the 10 questions on food neophobia. The total average points of subjects indicating food neophobia was 32.96 ± 10.1.
We performed exploratory factor and reliability analyses on the 10 items of the food neophobia scale (FNS), and the results are shown in Table 7. The items were divided into two groups. Items 1, 2, 4, 5, 6, 7, and 10 were placed into the first group, whereas 3, 8, and 9 were placed into the second group. This classification supports the results of other studies [13,17]. The reliability coefficient of the second group was very low at 0.468 for items 3, 8, and 9. We derived the seven items in the first group showing unidimensionality and used them in the correlation test.
Dietary habits, personality traits, food neophobia and family meal
The effects of family meal frequency on dietary habits are presented in Table 8. There was a significant difference among the five groups classified by family meal frequency (P < 0.001). As family meal frequency increased, dietary habits improved.
Personality traits significantly differed according to family meal frequency (P < 0.001). As family meal frequency increased, extroversion, agreeableness, conscientiousness, emotional stability, and openness/intellect also increased (Table 9).
Food neophobia significantly differed according to family meal frequency (P < 0.001), except for the group that replied 0 times per week. As family meal frequency increased, index of food neophobia decreased (Table 10).
Relationships among food dietary habits, personality traits, and food neophobia
Pearson's product moment correlation was used to analyze the relationships among dietary habits, personality traits, and food neophobia. The results of the test are shown in Table 11.
The correlation between dietary habits and personality traits was positive, which implies that improved dietary habits are associated with positive personality traits. On the other hand, the correlations between dietary habits and food neophobia as well as between food neophobia and personality traits were negative. This implies that improved dietary habits and personality traits are associated with an increased tendency to try new foods.
DISCUSSION
This study investigated the relationships among dietary habits, personality traits, and food neophobia according to family meal frequency. According to statistics from the Ministry of Education in 2010 [15], the average heights of boys and girls in middle school were 163.4 cm and 158.1 cm while average weights were 56.0 kg and 50.6 kg, respectively. In comparing this survey with the national survey, both height and weight of boys were lower than national averages. In the case of girls, height was higher than average while weight was lower.
Regarding the meaning of family meals, 69.6% of subjects replied that family meals mean eating with their families. The most common day for eating family meals was the weekend or national holidays. The main reason for not eating family meals was lack of time. Despite having intentions to eat family meals, differences in scheduling disallowed it. Students who ate family meals often ate at the scheduled time and watched less TV than other students. Regarding attitudes, eight items (family meals are important, nutrition, family solidarity, personality traits, eating manners, eating etiquette, gathering at the table, eating out) showed significant differences according to family meal frequency. As family meal frequency increased, nutrition became more balanced with improved personality traits. Attitudes of the subjects improved with increased family meal frequency and family meals were more pleasant (P < 0.01).
Regarding personality traits of the subjects, agreeableness scored the highest, whereas openness/intellect, extraversion, integrity, and emotional stability followed. Regarding openness/intellect and emotional stability, scores of female subjects were significantly higher than those of male subjects (P < .05).
In this study, the total average points of subjects indicating food neophobia was 32.96 ± 10.1. In a previous study, the total average points of Korean college students and salarymen in their twenties was 33.46 ± 8.99 [13]. Further, according to an Australian study, the total average points of Australian youths were 34.68 ± 0.64 in rural areas and 29.35 ± 0.38 in urban areas [16]. The results show that total average points for youths indicating food neophobia were similar to those of people in their 20s and 30s while slightly higher than those of Australian youth in urban areas.
We performed exploratory factor and reliability analyses on the 10 items of the food neophobia scale (FNS). The items were divided into two groups which classification supports the results of other studies [13,17].
There were five groups of students based on family meal frequency, and improved dietary habits were associated with increased family meal frequency (P < 0.001). Personality traits were significantly different according to family meal frequency. Further, extraversion, agreeableness, integrity, emotional stability, and openness/intellect increased with higher family meal frequency (P < 0.001). The correlation between family meal frequency and food neophobia show was negative (P < 0.001).
Based on the results of this research, we determined that family meal frequency affects dietary habits, personality traits, and food neophobia in adolescents. Therefore, social efforts should emphasize the importance of family meals for the formation of proper dietary habits and personality. Parents should teach their children proper dietary and nutrition habits through eating of regular meals, whereas school should teach the importance of dietary habits in the classroom. Second, the attitudes, perception, dietary habits, personality traits, and food neophobia according to family meal frequency were investigated. In the future, it will be necessary to develop a systematic training program to promote family meals by analyzing the relationships among the factors related to family meals. Finally, we suggest intensive research on the effects of food neophobia on nutrition intake and eating disorders as there is not much research on food neophobia.


 XML Download