

 PDF
PDF ePub
ePub Citation
 Print
Print


Introduction
The food service industry in Korea has created a market of about 6.9 billion won as of 2009, which is four-times greater than that in 1990 (about 1.8 billion won) [1]. In addition, the 2011 KNHANES (Korea National Health and Nutrition Examination Survey) report showed that the proportion of eating-out more than once a day was over 25% for the total population [2]. The reasons for the increase in the scale and consumption of the food service industry in Korea include economic growth due to industrialization, an increased number of working couples and women entering the workforce, and increased numbers of nuclear families. It is expected that the scale of the food service industry will continue to increase [3].
Investigations of the nutritional quality of meals provided by eating-out have increased due to the increased rate of their consumption [4-9]. Moreover, since the proportion of the population eating-out more than once a day has increased to over 25% [2], an in-depth study of the quality of food provided by eating-out and the frequency of eating-out should be conducted. Chung et al.[7] compared home-prepared, commercial, or institution lunches and found that more calories were consumed from commercial lunches than home-prepared lunches. Moreover, an investigation of food intake and nutrient intake by frequency of eating-out in college students revealed that food intake and nutrient intake differed depending on the frequency of eating-out in both male and female college students. In the case of male students, the nutrient intake decreased as the number of eating-out increased to twice a day, and the protein intake was particularly low [8]. These findings are similar to those of foreign studies focusing on Americans that have indicated that the increase of calorie intake in the American population over the past 20 years was due to increased eating-out [10,11].
An investigation of the current status of eating-out in the USA based on the 1987-2000 USA dietary survey data indicated that energy intake increased as the frequency of eating-out increased, and that the ratio of protein, fat, and saturated fat intake to energy became low, while that of carbohydrates increased [12]. O'Dwyer et al. [13,14] analyzed nutrient intake by serving place using North/South Ireland Food Consumption Survey data and found that the intake of energy and macronutrients such as carbohydrates, proteins, and fat was higher when meals were consumed in restaurants than in other meal serving places, and that the fat intake ratio that contributed to energy in eating-out meals was higher than the recommended value. A study of Belgians over 15 years old using the BFCS (The Belgian Food Consumption Survey 2004) revealed that eating-out tended to decrease as age increased and that males had higher energy intake through eating-out than females [15].
Based on these previous studies, the intake of energy, macronutrients, and sodium from eating-out meals are closely related to the quality of meals. However, investigations of food and nutrient intake by serving place in Koreans have been limited, and, with the exception of a few investigations, studies of food and nutrient intake according to serving place throughout the population by year have also been insufficient [3,7,16-18]. Thus, this study was performed to evaluate the quality of meals consumed while eating-out and at other meal serving places using KNHANES data from the Ministry of Health and Welfare, and to provide basic data describing dietary intake by serving place to enable the development of menus by food service related companies, consumer marketing strategies, and nutrition related studies.
Subjects and Methods
Survey data and subjects
This study used KNHANES source data collected from 1998 to 2007-2009. The subjects consisted of 37,160 adults over 19 years old analyzed using the 24-hour recall method.
General characteristics
General characteristics of this study were classified into gender, age (19-29, 30-49, 50-64, and over 65), marital status (married, unmarried), residential area (large city, middle & small city, and rural area), job status (employed, unemployed), income level and educational level. Additionally, income level was categorized average monthly household income according to the minimum cost of living (set by the Ministry of Health and Welfare for each year of the survey) defined by research of Lee & Kim [18] and Lee et al. [19]. In case of the low income, it was defined as average monthly household income that was less than 1.2 times the minimum cost of living. Also, middle income was 1.2-2.5 times the minimum cost of living. The last, high income level was more than 2.5 times the minimum cost of living. And educational level was divided 3 groups (middle school or less, high school and college or higher) by previous study [3,19,20].
Meal and serving place classification
In this study, meals were divided into breakfast, lunch, dinner, and snacks using codes included in the 24-hour recall variables of the KNHANES data. Additionally, the serving places were divided into home meals, eating-out meals (Korean, Western, Chinese, Japanese, fast-food, snack bar, bakery, street stalls and stores, packed meals, ramen, instant foods, others), and institution meals (school, industry, senior-citizen centers, free, others) based on the categories defined by Chung et al. [7].
Tendency of increase or decrease in consumption by serving place
The analysis investigated two aspects of food consumption by serving place. First, total meals and each of three meals were analyzed for the increase/decrease in the tendency of serving place by meals from 1998 to 2007-2009, and second, the increase/decrease in the tendency of serving place by meals was analyzed from 1998 to 2007-2009 in cases for which variables in which general characteristics such as gender, age, area, education level, income level, job, marital status, and total food intake were adjusted.
Nutrient intake analysis
To gain a better understanding of the tendency for changes in nutrient intake by serving place, five nutrient variables (energy, carbohydrate, protein, fat, and sodium) in the 24-hour recall data were calculated by meals and serving places, and the energy contribution of carbohydrate, fat, and protein was calculated and analyzed to determine the ratio of each macronutrient to energy.
Statistical analysis
Because the KNHANES is a large-scale national database obtained using a multistage stratified cluster sampling method, statistical analysis was performed with stratified sampling weights to consider the above characteristics using the SAS software (version 9.2; SAS Institute, Cary, NC, USA) and SUDAAN software (version 10.01; Research Triangle Institute, Research Triangle Park, NC). For general characteristics of the subjects and the consumption frequency by serving place in all years and meals, the frequency and the percentage were obtained using frequency analysis, after which a Chi-square test (χ2-test) was performed to identify significant differences among groups. During analysis of nutrient intake based on serving places with respect to daily meals in all years, the LSmean, SE and P for trends were obtained after adjustment for categorical variables such as gender, age, residential area, educational level, income level, job status, and marital status by the proc regress command in the SUDAAN software. Additionally, analysis of the tendency for increased or decreased consumption by serving place among all years and meals was conducted using logistic regression analysis and the odds ratio (ORs) and 95% confidence interval (CI) were obtained.
Results
General characteristics
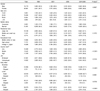
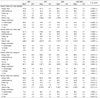
This study was based on data collected from 37,160 adults over 19 years old who participated in the 24-hour recall method as reported in the KNHANES from 1998 to 2007-2009. The general characteristics of the subjects are shown in Table 1. The population consisted of almost equal numbers of males and females, although the ratio of females was slightly higher than males in all years. Subjects were divided into four age groups (19-29, 30-49, 50-64, and over 65), with the 30-49 group accounting for the majority (more than 40%) of the total in all years (P < 0.0001). The ratio of married individuals in 1998, 2001, 2005, and 2007-2009 was 82.2%, 82.9%, 77.6%, and 80.4%, respectively, while the proportion of unmarried individuals increased from 17.8% in 1998 to 19.6% in 2007-2009 (P = 0.0171). More individuals lived in large city than middle and small cities or rural areas. The ratio of high school graduates was the highest in all years until 2005. Specifically, high school graduates accounted for 37.8%, 36.0% and 36.5% of the respondents in 1998, 2001, and 2005, but the college or higher group showed the highest abundance (38.8%) in 2007-2009 (P < 0.001). Based on the minimum cost of living set by the Ministry of Health and Welfare for each year of the survey, a low income level was defined as less than 1.2 times the minimum cost of living, the middle income level was 1.2-2.5 times the minimum cost of living, and the high income level was more than 2.5 times the minimum cost of living. These results showed that over 40% of respondents were categorized as having the middle income level in 1998 and 2001, but the amount of individuals with a high income level has increased since 2005 (P < 0.001). Evaluation of job status revealed that the ratio of employed respondents was higher than that of unemployed individuals, being 59.8%, 59.3%, and 60.0% in 1998, 2001, and 2005, while it was 60.0% in 2007-2009. The number of individuals consuming breakfast was high in all years, but tended to decrease with time, with more than twice the number of respondents (22.3%) skipping breakfast in 2007-2009 than 1998 (P < 0.0001). Over 90% of the respondents reported eating lunch and dinner, and the proportion reporting eating snacks increased significantly from 72.2% in 1998 to 84.4% in 2007-2009 (P < 0.0001).
Consumption by serving place according to years by meals
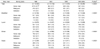
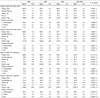
The results of consumption by serving place according to years by meals are shown in Table 2. Among total meals, home-prepared meals were highest (> 55%) in all years, but eating-out gradually increased from 1998 to 2007-2009 (27.9%). Consumption of institution meals also increased from 4.4% in 1998 to 6.5% in 2005, but decreased again to 4.6% in 2007-2009 (P < 0.0001). For breakfast, home-prepared meal consumption was the highest (about 90%), but this value tended to gradually decrease with time, while eating-out breakfast increased from 6.8% in 1998 to 10.1% in 2007-2009 (P < 0.001). Evaluation of lunch consumption by serving place revealed that home-prepared lunch was highest (52.7%) in 1998, but decreased to 40% after 2001, while eating-out lunch increased from 34.8% in 1998 to 37.8% in 2007-2009. Additionally, institution-prepared lunch increased from 12.5% in 1998 to 16.3% in 2005, but decreased to 12.3% in 2007-2009 (P < 0.001). Home-prepared dinner tended decreased from 78.9% in 1998 to 67.6% in 2007-2009, while eating-out dinner increased from 19.0% to 29.1% in 2007-2009 (P < 0.001). Snack eating was mostly provided by eating-out and increased from 52.1% in 1998 to 73.6% in 2007-2009 (P < 0.0001).
Tendency of increase or decrease in consumption by serving place
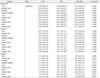
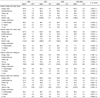
The increases or decreases in consumption by serving place for all meals are shown in Table 3. Home-prepared meals decreased significantly in 2007-2009 compared to 1998 for total meals, breakfast, lunch, dinner and snacks (P for trend < 0.001). Conversely, eating-out increased significantly in 2007-2009 compared to 1998 for total meals and each of the three meals (P for trend < 0.0001). Among these, eating-out snacks increased more than six times when compared to 1998. For institution meals, there were no significant differences in total meals and each of the three meals, except crude snacks, but snacks and adjusted snacks increased by 1.24 times and 1.22 times, respectively, in 2001 compared to 1998. Total meals and each of three meals increased by 1.3-1.63 times in 2005 compared to 1998, but did not differ when compared to 2007-2009.
Nutrient intake from daily meal by serving place in all years
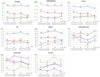
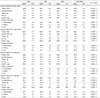
The results of nutrient intake (total meals) by serving place in all years are shown in Fig. 1. Among nutrient intakes of total meals, energy decreased significantly during the past 11 years from 1,988.5 kcal in 1998 to 1,919.5 kcal in 2007-2009 (P for trend = 0.0297). The consumption of carbohydrate and protein also tended to decrease in 2007-2009 relative to 1998 (P for trend < 0.0001), while the consumption of fat and sodium was decreased in 2007-2009 compared to 1998, but this decrease was not significant. The energy contribution ratio of carbohydrate, protein and fat decreased significantly by about 1.1% in 2007-2009 (14.3%) compared to 1998 (15.4%, P for trend < 0.0001), while that of fat increased significantly by about 0.4% in 2007-2009 (17.1%) compared to 1998 (16.7%, P for trend = 0.0076). The energy obtained from home-prepared meals decreased from 1,364 kcal to 1,079 kcal (P for trend < 0.0001), while the sodium intake decreased from 3,747.7 mg to 3,106.2 mg in 1998 and 2007-2009 (P for trend < 0.0001), respectively. The carbohydrate ratio increased gradually from 1998 to 2007-2009, but the protein ratio decreased (P for trend < 0.0001). The fat ratio also decreased in 2007-2009 compared to 1998, but this change was not significant. In eating-out meals, the energy ranged from 893-944 kcal and was higher in 2007-2009 than 1998, but this difference was not significant. Among these meals, the sodium intake was 1,752.9 mg in 1998 and 2,010.7 mg in 2007-2009 (P for trend < 0.0001). The carbohydrate levels were decreased in 2007-2009 compared to 1998, while the protein and fat levels were significantly higher in 2007-2009 than in 1998 (P for trend < 0.01). Analysis of the energy intake in institution meals revealed that it ranged from 849-948 kcal, showing a gradual increase from 1998 to 2007-2009 (P for trend = 0.0006), while the sodium intake increased significantly from 2,253.1 mg in 1998 to 3,035.3 mg in 2007-2009 (P for trend < 0.0001). Evaluation of the energy contribution ratio of carbohydrate, protein and fat revealed that carbohydrate decreased and fat increased significantly from 1998 to 2007-2009 (P for trend < 0.0001), while protein did not change significantly.
The intakes of energy, macronutrients and sodium from breakfast by serving place for all years are shown in Table 4. The energy intake decreased from 513.9 kcal in 1998 to 479.4 kcal in 2007-2009 (P for trend < 0.0001). Moreover, the intakes of protein, fat, and sodium decreased from 1998 to 2007-2009 (P for trend < 0.0001). The energy contribution ratio of carbohydrate tended to increase from 1998 to 2007-2009 (P for trend < 0.0001), while that of protein and fat tended to decrease (P for trend < 0.0001). Analysis of the nutrient intake from home-prepared meals revealed that energy decreased significantly from 511.3 kcal in 1998 to 473.2 kcal in 2007-2009 (P for trend < 0.0001), while sodium decreased significantly from 1,592.7 mg in 1998 to 1,410.2 mg in 2007-2009 (P for trend < 0.0001). The energy contribution ratios of carbohydrate, protein and fat differed significantly (P for trend < 0.0001). The contribution from carbohydrate was 69.2% in 1998, 71.6% in 2001, 70.6% in 2005, and 73.5% in 2007-2009. Conversely, the contribution ratio of protein and fat were lower in 2007-2009 than 1998. Among eating-out meals, the energy intake was between 377.5-476.7 kcal, with a gradual increase occurring from 1998 to 2007-2009 (P for trend = 0.0070). The sodium intake from eating-out meals increased significantly from 881.7 mg in 1998 to 1,152.4 mg in 2007-2009 (P for trend = 0.0080). Evaluation of the energy contribution of carbohydrate, protein and fat revealed that the carbohydrate ratio increased from 56.3% in 1998 to 63.1% in 2007-2009 (P for trend = 0.0005), while the protein ratio and the fat ratio decreased significantly from 1998 to 2007-2009 (P for trend < 0.05). Analysis of the nutrient intake from institution meals revealed that the energy ranged from 587.5-651.6 kcal and the sodium increased significantly from 1,557.3 mg in 1998 to 2,156.0 mg in 2007-2009 (P for trend = 0.0113). Evaluation of the energy contribution ratio of carbohydrate, protein and fat revealed that the protein ratio increased gradually from 1998 to 2007-2009 (P for trend < 0.0001), while those of the carbohydrate and fat did not differ significantly.
The intakes of energy, macronutrients, and sodium from lunch by serving place in all years are shown in Table 5. With the exception of fat and sodium, none of the average energy, macronutrients, or sodium intakes from lunch differed significantly. The fat intake increased from 12.1 g in 1998 to 12.6 g in 2007-2009 (P for trend = 0.0161), while the sodium intake increased from 1,800.4 mg in 1998 to 1,960.9 mg in 2007-2009 (P for trend < 0.0001). Investigation of the energy contribution ratio of carbohydrate, protein and fat revealed that only the fat ratio increased significantly from 1998 (15.9%) to 2007-2009 (16.3%, P for trend = 0.0062). Analysis of the nutrient intake in home-prepared meals revealed that the energy ranged from 526.5-597.7 kcal and decreased gradually from 1998 to 2007-2009 (P for trend = 0.0004). The sodium intake decreased from 1,713.6 mg in 1998 to 1,617.5 mg in 2007-2009 (P for trend = 0.0059). The energy contribution ratio of carbohydrate, protein and fat differed significantly with time. Specifically, the contribution from carbohydrate increased gradually from 1998 to 2007-2009, while those from protein and fat decreased significantly during the same period (P for trend < 0.05). Analysis of the nutrient intake from eating-out meals revealed that energy intake was between 686-704 kcal and the sodium intake was 1,795.0 mg in 1998 and 2,237.6 mg in 2007-2009 (P for trend < 0.0001). Among the energy contributions of carbohydrate, protein and fat, only the carbohydrate ratio and the fat ratio differed significantly. Specifically, the carbohydrate decreased from 64.9% in 1998 to 63.7% in 2007-2009 (P for trend = 0.0064), while the contribution from fat increased from 18.8% in 1998 to 20.0% in 2007-2009 (P for trend = 0.0002). Analysis of the nutrient intake in institution meals revealed that the energy intake ranged from 678.9-754.9 kcal, with a significant increase occurring from 1998 to 2007-2009 (P for trend = 0.0005). Additionally, the sodium intake increased from 1,896.2 mg in 1998 to 2,387.6 mg in 2007-2009 (P for trend < 0.0001). The carbohydrate ratio gradually decreased from 1998 to 2007-2009 (P for trend < 0.0001), while the fat ratio increased significantly from 1998 to 2007-2009 (P for trend < 0.0001).
The intakes of energy, macronutrients and sodium from dinner by serving place in all years are shown in Table 6. The average energy from dinner ranged from 653.2-693.7 kcal and did not differ significantly throughout the study period. Carbohydrate and protein intakes decreased significantly from 1998 to 2007-2009 (P for trend < 0.0001), while sodium increased from 1,768.7 mg in 1998 to 1,836.8 mg in 2007-2009 (P for trend = 0.0448). Evaluation of the energy contribution ratio of carbohydrate, protein and fat revealed that only the protein ratio and the fat ratio differed significantly. Specifically, the protein decreased from 16.7% in 1998 to 15.6% in 2007-2009 (P for trend = 0.0002), while the fat increased from 16.4% in 1998 to 16.8% in 2007-2009 (P for trend = 0.0223). Analysis of the nutrient intake from home-prepared meals revealed a decrease from 617.6 kcal in 1998 to 563.2 kcal in 2007-2009 (P for trend < 0.0001), while the sodium decreased from 1,712.9 mg in 1998 to 1,620.9 mg in 2007-2009 (P for trend = 0.0353). Among the energy contribution ratios of carbohydrate, protein and fat, carbohydrate increased and protein decreased significantly (P for trend < 0.0001). Analysis of the nutrient intake in eating-out meals revealed that energy increased from 782.4 kcal in 1998 to 831.0 kcal in 2007-2009. Additionally, the sodium intake from eating-out meals increased from 1,726.5 mg in 1998 to 2,216.1 mg in 2007-2009 (P for trend < 0.0001). Among the energy contribution ratios of carbohydrate, protein and fat, only the carbohydrate ratio decreased significantly (P for trend = 0.0487). Analysis of the nutrient intake from institution meals revealed that the energy was between 650.2-754.2 kcal, with a significant increase occurring from 1998 to 2007-2009 (P for trend = 0.0155), while the sodium increased from 1,771.5 mg in 1998 to 2,420.9 mg in 2007-2009 (P for trend = 0.0002). Among the energy contribution ratios of carbohydrate, protein and fat, the carbohydrate ratio decreased in 2007-2009 compared to 1998, while the fat ratio increased significantly from 1998 to 2007-2009 (P for trend < 0.05).
The intakes of energy, macronutrients and sodium from snacks by serving place for all years are shown in Table 7. None of the average nutrient intakes from snacks and the energy contribution ratio of macronutrients except carbohydrate, sodium, and protein differed significantly. Among increased or decreased nutrients, carbohydrate decreased by about 7 g in 2007-2009 (65.4 g) compared to 1998 (72.4 g, P for trend < 0.0001), while sodium increased by about 45 mg in 2007-2009 (335.5 mg) relative to 1998 (290.0 mg, P for trend = 0.0003). Among the energy contribution ratios of carbohydrate, protein and fat, the protein ratio decreased from 16.7% in 1998 to 15.6% in 2007-2009 (P for trend = 0.0002). Analysis of the nutrient intake in home-prepared meals revealed that the energy gradually decreased from 326.7 kcal in 1998 to 268.2 kcal in 2001, 244.5 kcal in 2005, and 192.6 kcal in 2007-2009 (P for trend < 0.0001). Additionally, the sodium decreased by about 43 mg from 1998 (296.5 mg) to 2007-2009 (253.5 mg). Among the energy contribution ratios of carbohydrate, protein and fat, the carbohydrate ratio decreased gradually from 1998 to 2007-2009 (P for trend < 0.0001), while the fat ratio increased gradually from 1998 to 2007-2009 (P for trend < 0.0001). Analysis of the nutrient intake from meals consumed while eating-out revealed that the energy intake was 398.0 kcal in 1998, 377.7 kcal in 2001, 348.5 kcal in 2005, and 393.0 kcal in 2007-2009, which did not differ significantly. Additionally, the sodium intake ranged from 310-359 mg, but did not differ significantly among years. Among the energy contribution ratios of carbohydrate, protein and fat, the carbohydrate ratio was lower in 2007-2009 than 1998 (P for trend < 0.0001), while the protein ratio and the fat ratio were significantly higher in 2007-2009 than 1998 (P for trend < 0.01). Analysis of the nutrient intake in institution meals revealed that the energy was between 195-438 kcal with no significant differences among years. Additionally, no significant difference in sodium intake was observed among years for institutional meals. The energy contribution ratio of carbohydrate, protein and fat did not differ significantly.
Discussion
This study used the KNHANES data from 1998 to 2009, which were based on 37,160 respondents 19 years old and over that participated in 24-hour dietary recall. The places in which meals were provided varied by year, with the consumption of meals prepared at home remaining highest, but decreasing, while that of eating-out meals increased. These findings were similar to the results of a study conducted by Kwon [3], who surveyed the habits of Korean adults when eating-out by using the frequency of eating-out as listed in the dietary survey of KNHANES from 1998 to 2005, which showed that the ratio of eating-out more than once per day increased from 22.1% at 1998 to 43.5% at 2005. Moreover, an investigation of consumption showed that eating-out on a weekly basis increased from less than once a week to more than six times a week based on a National Health and Nutrition Examination Survey (NHANES) and the National Health Interview Survey (NHIS) conducted in the USA between 1987 and 2000. Eating-out at least six times a week occurred at a frequency of 11.8% in the total population in 1987, but increased to 14.5% between 1999 and 2000. However, the frequency of eating-out less than once a week was lower than in 1987 (1987: 50%, 1999-2000: 44%) [12]. An increase of eating-out more than once a day from 32% in 1998 to 44% in 2007-2009 including institutions were a different result. Based on these results, further research comparing the frequency of meals provided during eating-out and studies comparing national dietary survey data to overseas research are recommended. Breakfast consumption of meals prepared at home had the highest rate of approximately 90%. Breakfast eating out increased continuously since 1998, but a lower rate of about 10% from an each year was investigated but it shows gradually increase. The ratio of eating-out for breakfast from 1998 to 2007-2009 increased at a lower rate of around 10% when compared with the results of a study investigating the patterns of Korean eating by Moon et al. [21] using the Korean National Nutrition Survey of 1989 ratio of eating-out at breakfast of 2.3%. Evaluation of the consumption of lunch by places at which meals were provided revealed that those prepared at home gradually decreased, while meals prepared at a place other than home increased by more than 50% after 2001. In addition, the results of logistic regression analysis show that eating-out for lunch increased from 1.4 times to 4.28 times. Additionally, the results of this study indicate that the frequency of eating-out has increased for lunch.
The nutrition intake based on places meals were consumed by year was analyzed by dividing data into total meals, breakfast, lunch, dinner and snacks. The energy, fat, and sodium intakes tended to be slightly lower in home meals in 2007-2009 than in 1998, while the sodium intake and the energy contribution ratio of fat in eating-out meals increased significantly from 1998 to 2007-2009. The energy, fat, sodium intake, and energy contribution ratio of fat in institutions increased significantly from 1998 to 2007-2009. These findings were similar to those of a study conducted by Kant and Graubard [12] in which the energy contribution ratio of fat of the group with a higher ratio of eating-out was found to be higher than that of another group that ate out less. Additionally, analysis of nutrient intake data in the USA collected over 20 years using the CSFII (Continuing Survey of Food Intakes by Individual) revealed an 18% increase between 1977 and 1978 to 32% between 1994 and 1996 and a decrease in the energy contribution ratio of fat when eating-out from 42% to 37.7% in adults; however, the energy contribution ratio of fat or saturated fat was high, indicating that the energy contribution ratio of fat through eating-out increased [22]. Chung et al. [7] reported that it is very important to form a healthy eating-out culture to improve high macronutrient intake when dining out.
Evaluation of breakfast revealed lower energy intake from meals cooked at home and eaten at institutions than those consumed while eating-out. However, the energy contribution ratio of carbohydrate intake was lower during eating-out than eating at home and institution, while the energy contribution ratio of fat was more than 10% higher in meals consumed while eating-out than in those provided at home. It has been reported that increasing energy contribution ratios of fat are associated with heart disease and various cancers [7,23,24]. Thus, restaurants should consider high macronutrient intake when they are developing breakfast menus.
For lunch and dinner, the energy intake associated with meals consumed while eating-out and at institutions was higher than that for meals at home, but the energy contribution ratio of fat was higher in meals consumed while eating-out than at home. The energy contribution ratio of carbohydrates was lower in meals consumed while eating-out than in those prepared at home or in institutions. The energy contribution ratio of fat was in the recommended range outlined by the Dietary Reference Intakes for Koreans [25]. In the case of eating-out, the energy contribution ratio of fat increased as in previous studies [7,13,14,26], suggesting that programs should be designed to encourage healthier choices when eating out. All home-cooked, eating-out and institution meals had high sodium levels of 1,700 mg to 2,500 mg per meal, indicating that total daily sodium intake is over the recommended daily intake of 2,000 mg/day set by the WHO (World Health Organization) [27] and Dietary Reference Intakes for Koreans [25]. Therefore, individuals should pay attention to sodium consumption because its excessive consumption is associated with adverse health effects such as hypertension and chronic diseases [28].
Overall, the consumption of meals while eating-out and at institutions has increased since 1998, but eating-out and institution cannot be replaced by home meal completely as shown in the previous study [29]. However, the increase in the amount of food consumed while eating-out may lead to an increase in fat [3], which could increase the risk of various adult diseases, including obesity. Overall, the results of this study indicate that policies and education regarding guidelines and balanced intake of nutrients to improve specific dietary habits are needed.
It should be noted that this study has several limitations. Specifically, the data analyzed did not include the most up-to-date research materials such as the latest 5th KNHANES (2010-2012) data; accordingly, a future study including data from this survey is warranted. Moreover, this study did not address food intake and menu patterns.
 XML Download