

 PDF
PDF ePub
ePub Citation
 Print
Print


Introduction
The number of patients with osteoporosis, a metabolic bone disease, has increased as the elderly population has increased worldwide. In Korea in 2009, the prevalence of osteoporosis in adults over 50 years of age was 8.1% in men and 38.7% in women, according to the results of the 2009 Korea National Health and Nutrition Examination Survey (KNHANES). The rate increased as age increased; the rate has been reported to be 14.6% in those in their 50s, 39.1% in those in their 60s, and 68.2% in women and 20% in men in their 70s [1]. The number of patients with osteoporosis has been steadily increasing, and the medical expenses associated with the disease were 72.2 billion won in 2001, an increase of 35% compared to that 5 years previously [2]. The cure rate of osteoporosis is lower than that of other chronic diseases; thus, prevention is most important for this disease.
Several studies have reported that calcium (Ca) intake and the intake of milk and dairy products affect bone mineral density, peak bone mass, and Ca balance, and are important in the maintenance of bone health [3,4]. Additionally, the intake of vitamin D is necessary for the maintenance of healthy bone.
However, in Korea, Ca intake is low, with only 67.1% of people achieving the recommended intake levels; the rate drops to 50% in those aged > 65 years [1]. The consumption of milk and dairy products, which are important sources of Ca, has increased from 79.9 g/day in 1998 to 105.8 g/day. However, according to a food frequency survey conducted in the past year, milk is consumed on average 3.0 times per week, and only 24.6% of people have milk more than once a day [1].
Several studies have reported that an increase in Ca intake leads to an increase in bone mineral density (BMD) and can reduce not only the risk of osteoporosis but also the risk of fracture [5-7]. Some studies have also suggested that dairy products are a good food to consume for maintaining bone health [8,9]. In particular, studies conducted in Korean adults have shown significant relationships between milk and dairy product intake and BMD and osteoporosis incidence [10,11].
On the other hand, in the USA, the incidence of osteoporosis and fracture has increased despite a gradual increase in the recommended intake of Ca during the past 20 years, and no correlation between Ca intake and the risk of pelvic fracture has been reported [3,8,12-15]. Additionally, it is important to maintain an appropriate level of serum 25(OH) vitamin D (an index of vitamin D status) for the maintenance of bone health. Some studies have reported that the intake of an appropriate level of vitamin D can reduce the risk of fracture and osteoporosis [16-18], although another study has reported that vitamin D deficiency is not a major cause of fracture [19]. Such inconsistency in study results may be due to differences in study design, subjects, and the parts of bone examined.
This study was performed, using 2008-2009 KNHANES data, to investigate the relationship between Ca intake, milk and dairy product intake, and serum 25(OH) vitamin D level and the risk of osteoporosis in Korean adults, and to provide fundamental data for use in strategies to prevent osteoporosis.
Subjects and Methods
Subjects
This study used the results from physical examinations and dietary surveys of 9,444 adults (3,819 men, 5,625 women) aged > 20 years who had undergone BMD testing during the 2008-2009 KNHANES. The subjects were divided into quartiles depending on dietary Ca intake as follows: daily Ca intake < 257.3 mg (Q1), 257.3-397.5 mg (Q2), 397.6-592.3 mg (Q3), and > 592.4 mg (Q4).
Study content
Body weight, height, waist circumference, and body mass index (BMI) were recorded as anthropometric data; serum 25(OH) vitamin D level was also measured. Among BMD data, total, lumbar spine, total femur, femoral neck, Ward's triangle, and trochanter BMD, and their T-score values, were used. Osteoporosis status was determined using the assessment criteria for Asian populations: T-score < -2.5 for osteoporosis, T-score -2.5 to -1.0 for osteopenia, and T-score > -1.0 for normal status [20].
Statistical analysis
All the analyses were conducted using a survey weighting to account for the complex survey design, which consisted of multistage, stratified, clustered samples. Probability sampling weights were used in conjunction with strata and primary sampling units to apply weight to the data analysis. For statistical analysis, SAS 9.13 (SAS Institute Inc., Cary, NC) and SUDAAN 10 (SUDAAN, Research Triangle Institute, Research Triangle Park, NC) were used. The frequency of muscular strength exercise, menstruation status, and hormone supplement use were compared using the chi-square test. All means and standard errors were adjusted for gender and age, and then calculated considering stratification variables and weights. Significant differences between groups were tested using Bonferroni's multiple t-test. For the analyses on the effects of serum 25(OH) vitamin D level, dietary Ca intake, and milk and dairy product intake on osteoporosis risk, odds ratios (ORs) and 95% confidence intervals (CI) were obtained using logistic regression. As factors related to osteoporosis risk could influence the results of logistic regression, the risk was calculated after adjustment for factors known to affect osteoporosis, such as age, gender, BMI, serum 25(OH) vitamin D level, menstruation status, hormone supplement use, menopausal status, and the number of days per week of muscular strength exercise.
Results
General characteristics
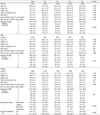
The general characteristics of the subjects are shown in Table 1. The overall average age was 45.9 years. The overall average height was 162.1 cm; the averages were 159.1 cm for Q1, 161.6 cm for Q2, 163.0 cm for Q3, and 164.3 cm for Q4, showing that those in Q4 were significantly taller than those in Q1, Q2, and Q3 (P < 0.05). The overall average weight was 62.4 kg; the averages were 59.5 kg for Q1, 61.9 kg for Q2, 63.4 kg for Q3, and 64.5 kg for Q4, showing that those in Q3 and Q4 (who had higher Ca intake) were significantly heavier than those in Q1 and Q2 (P < 0.05). In both men and women, height and weight were significantly higher in Q4 than in Q1 (P < 0.05). The overall average waist circumference was 81.4 cm, and the overall average BMI was 23.7 kg/m2; waist circumference and BMI were significantly higher in Q4 than in Q1 (P < 0.05). However, waist circumference and BMI did not show significant differences when the groups were categorized into men and women.
The overall average serum 25(OH) vitamin D level was 19.4 ng/mL; the average level was 18.5 ng/mL for Q1, 19.6 ng/mL for Q2, 19.4 ng/mL for Q3, and 20.1 ng/mL for Q4, showing that levels for those in Q4 were significantly higher than levels for those in Q1 (P < 0.05). Serum 25(OH) vitamin D levels in both men and women were significantly higher in Q4 than in Q1 (P < 0.05). The percentage of participants who performed muscular strength exercises on more than 5 days per week was significantly higher in Q4 than in Q1 (P < 0.001). In women, 58.0% were menstruating and 34.2% were menopausal. Hormone supplement use was reported by 7.7% of women.
Bone mineral density
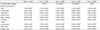
The BMD values of the subjects are shown in Table 2. In all subjects, the average total BMD was 1.138 g/cm2, the average lumbar spine BMD was 0.942 g/cm2, the average total femur BMD was 0.914 g/cm2, and the average femoral neck BMD 0.761 g/cm2. Total, lumbar spine, total femur, femoral neck, Ward's triangle, and trochanter BMD values were significantly higher in Q4 than those in Q1 and Q2 (P < 0.05).
The T-scores for all subjects were -0.622 for lumbar spine, 0.162 for total femur, and -0.561 for femoral neck, showing that the T-score for femur was higher than that for lumbar spine. The lumbar spine T-score in Q4 was -0.533, which was significantly higher than those in Q2 and Q1. The highest T-score found was that for total femur in Q4 (0.265), while the lowest was that for the femoral neck in Q1 (-0.673) (P < 0.05).
Nutrient intake
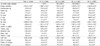
The nutrient intake of the subjects is shown in Table 3. The overall average energy intake after adjusting for age was 1,912.0 kcal/day. The proportion of energy intake from carbohydrate, protein, and fat was 69.2%, 14.2%, and 16.6%, respectively. The Ca intake per 1,000 kcal was 263.8 mg, and the P intake per 1,000 kcal was 608.0 mg; the Ca/P ratio was low (0.42).
The energy intake was 1,396.7 kcal/day in Q1, 1,752.0 kcal/day in Q2, 1,979.6 kcal/day in Q3, and 2,422.9 kcal/day in Q4; energy intake in Q4 was significantly higher than those in the other quartiles. The proportion of energy from carbohydrate, fat, and protein was 65.0%, 15.9%, and 19.1%, respectively, in Q4; this ratio was significantly different from the ratios in the other groups (P < 0.05). The Ca intake per 1,000 kcal was 137.0 mg in Q1, 209.8 mg in Q2, 275.8 mg in Q3, and 413.2 mg in Q4; the level in Q1 was significantly lower than the levels in the other groups (P < 0.05). The intakes of carbohydrate, protein, fat, vitamins, and minerals per 1,000 kcal were significantly higher in Q4 than in Q1 (P < 0.05).
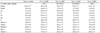
The proportions of subjects who did not achieve estimated energy requirements (EER), estimated average requirement (EAR), or adequate intake (AI) according to Korean dietary reference intakes (KDRIs) were analyzed (Table 4). Intake was inadequate for 66.2% of participants for energy, 73.1% for Ca, 70.4% for K, and 60.6% for riboflavin. The proportion of participants with inadequate intake of all nutrients was significantly lower in Q4 than in the other quartiles (P < 0.05).
Relationship between Ca intake and osteoporosis incidence
The risk for osteoporosis decreased as Ca intake increased; the ORs were 0.45 for Q2 vs. Q1 (95% CI: 0.38-0.54), 0.31 for Q3 vs. Q1 (95% CI: 0.26-0.37), and 0.27 for Q4 vs. Q1 (95% CI: 0.23-0.33). The ORs was 0.66 for Q4 vs. Q1 (95% CI: 0.50-0.87) after adjustment for gender, age, and other factors (BMI, serum 25(OH) vitamin D level, menstruation status, female hormone intake, menopausal status, and the number of days per week of muscular strength exercise) (P < 0.05, Table 5).
Table 6 shows the risk for osteoporosis according to Ca/P ratio; risk decreased as Ca/P ratio increased. The ORs for osteoporosis were 0.59 for Q2 vs. Q1 (95% CI: 0.50-0.69), 0.46 for Q3 vs. Q1 (95% CI: 0.38-0.56), and 0.57 for Q4 vs. Q1 (95% CI: 0.48-0.67) as the Ca/P ratio increased. The ORs was 0.71 for Q4 vs. Q1 (95% CI: 0.59-0.87) after adjustment for gender and age, and 0.76 for Q4 vs. Q1 (95% CI: 0.58-0.98) after further adjustment for BMI, serum 25(OH) vitamin D level, menstruation status, female hormone intake, menopausal status, and the number of days per week of muscular strength exercise (P < 0.05).
Relationship between milk and dairy product intake and osteoporosis
The relationships between the frequency of milk and dairy product intake and the risk of osteoporosis are shown in Table 7. The frequency of milk and dairy product intake (serving size was defined as 200 mL) was categorized as 0/day (reference group), ≤ 1/day, and > 1/day, and the risk for osteoporosis was examined according to these categories. The ORs for osteoporosis were 0.59 for ≤ 1 serving vs. reference (95% CI: 0.46-0.75) and 0.52 for > 1 serving vs. reference (95% CI: 0.41-0.64). After adjustment for gender, age, and other factors, the ORs was 0.71 for > 1 serving vs. reference (95% CI: 0.53-0.96) (P < 0.05).
Relationship between serum 25(OH) vitamin D level and osteoporosis incidence
The risk of osteoporosis tended to decrease as serum 25(OH) vitamin D level increased, but the effect was not statistically significant. However, the decreased risk for osteoporosis as serum 25(OH) vitamin D level increased became significant (P < 0.05) after adjustment for gender, age, and other factors. In particular, the ORs for osteoporosis was 0.71 (95% CI: 0.54-0.93) after adjustment for gender and age, and 0.68 (95% CI: 0.49-0.95) after further adjustment for other factors, in the comparison of Q3 vs. Q1 (Table 8).
Discussion
This study analyzed the effects of dietary Ca intake, milk and dairy product intake, and serum 25(OH) vitamin D levels on the risk of osteoporosis. Korean adults aged > 20 years who had participated in the 2008-2009 KNHANES were divided into quartiles of dietary Ca intake. The BMDs of total femur and lumbar spine in Q4 were significantly higher compared to those in Q1 and Q2. In previous studies, it has been reported that Ca intake is an important dietary factor in the maintenance of BMD [5-7]. Wlodarek et al. [21] reported that BMD was higher in those with 431.1 mg/day Ca intake than in those with 360.4 mg/day Ca intake; these results are similar to those of our study. On the other hand, some studies in children and adolescents [22-25] have reported that Ca intake does not affect BMD, suggesting that the effect of Ca intake on BMD varies according to age.
The Q4 group, which had the highest Ca intake, also had significantly higher intakes of energy, nutrients, and vitamins and minerals than the Q1, Q2, and Q3 groups. As Ca intake increased, the intake of energy from carbohydrate significantly reduced and the intake of energy from protein and fat significantly increased. A Japanese study using NIPPON DATA 80/90 [26] reported that, as Ca intake increased, the intake of energy from carbohydrate decreased and the intake of energy from protein and fat increased in both males and females, and these findings are consistent with the results of this study. Additionally, it has been reported that the intake of vitamin A, vitamin C, sodium, potassium, and iron increase as Ca intake increases. In our study, the Q4 group, which had the highest Ca intake, had significantly higher intake of vitamins and minerals than the other groups, and had a Ca/P ratio more than double that of the Q1 group. Fewer than 5% of subjects in Q4 consumed less than the EAR for Ca, protein, phosphorus, and iron. Additionally, fewer than 25% of subjects in Q4 consumed less than the EAR of vitamins and minerals. Therefore, a greater intake of Ca is associated with better intake of other nutrients. In a study of elderly women in the Daegu area conducted by Choi et al. [10], the intake of vitamin A, thiamin, and riboflavin were significantly lower in the osteopenia and osteoporosis groups than in the normal status group; they also found that a low proportion of these women consumed the recommended intake according to KDRIs standards. Also, Yu et al. [27,28] reported that the intake of Ca, phosphorus, iron, thiamin, and vitamin C were low in children, adults, and elderly with low BMD.
In our study, the risk of osteoporosis tended to decrease as Ca intake increased. After adjustment for gender, age, BMI, serum 25(OH) vitamin D level, menstruation status, female hormone intake, menopausal status, and the number of days per week of muscular strength exercise (all factors that can affect osteoporosis risk), the Q4 group (Ca intake > 592.3 mg/day) had an ORs for osteoporosis of 0.66 (Q4 vs. Q1, 95% CI: 0.50-0.87), suggesting that increased Ca intake can reduce the risk of osteoporosis. The ORs for osteoporosis was 0.57 (crude ORs, 95% CI: 0.48) when the Ca/P ratio was over 0.498 compared to when the ratio was less than 0.297, showing that the risk for osteoporosis tended to decrease as the Ca/P ratio increased. Several previous studies [10,27,28] have reported that Ca intake and Ca/P ratio were lower in groups with osteoporosis than in normal groups.
It has been reported that increased dietary Ca intake reduces the risk of fracture in adults. In one study conducted in menopausal American women [7], individuals with Ca intake (including supplements) of more than 1,200 mg/day had a decreased risk of fracture (relative risk 0.70, 95% CI: 0.52-0.92) compared to those with an intake of less than 600 mg/day, suggesting that Ca intake can also reduce the risk of fracture. Furthermore, a daily increase in the intake of Ca of 300 mg can reduce the risk of fracture, according to the results of the Switzerland Mammography Cohort study. A study of women aged > 55 years [3] reported that women with osteoporosis or fracture experience had low Ca intake, and the results of our study also showed a reduced risk for osteoporosis not only with an increased Ca intake but also with an increased Ca/P ratio. Thus, it is considered that increased Ca intake in adults can help to prevent not only osteoporosis but also fracture.
A survey on the intake of milk and dairy products (major food sources of Ca) showed that more than 80% of subjects never consumed such products, and only 20% consumed more than 1 serving (the daily recommended intake for Korean adults). In a study of female college students [29], the BMD of femur and lumbar spine were significantly higher in groups with milk and dairy product intake > 260 g/day than in groups with intake < 120 g/day; the study also reported that increased intake of dairy products increased the BMD of L2 in the femur and lumbar spine. Also, a study of Polish women aged > 55 years [3] reported a positive correlation between Ca intake through milk and dairy products and BMD of femoral neck and hip. The Framingham Offspring Cohort study in adults reported that an increase in milk and yogurt intake increased BMD of the trochanter, but did not affect BMD of the femoral neck and lumbar spine (L1-L4) [30]. In a study on the relationship between food frequency and BMD using domestic KNHANES (2008-2009) data [11], a correlation between the frequency of milk and dairy product intake and BMD of femur and lumbar spine was not observed in women, but a positive correlation between frequency and BMD of femoral neck was observed in men. Meanwhile, however, a study in elderly subjects in Nuuk, Greenland, found that the intake of milk and dairy products was not related to the incidence of osteoporosis [31], and a study analyzing the Nurses' Health Study data [32] found that the intake of milk did not affect hip fracture incidence. Thus, inconsistencies exist in the results of studies on the effects of milk and dairy products on BMD and the incidence of osteoporosis and fracture. According to several studies, the intake of Ca, milk, and dairy products has positive effects on Ca balance and bone metabolism, leading to improvements in BMD and the prevention of osteoporosis [3,5-7,29,30,32]. Therefore, we believe that consuming more than 1 serving of milk or dairy products per day is a dietary factor that can reduce the risk of osteoporosis. The consumption of more than 1 serving of milk or dairy products each day provides an average Ca intake of 319.2 mg/day, which is about 50% of the recommended Ca intake for Korean adults in the form of milk and dairy products, the important sources of Ca.
In addition, vitamin D-fortified dairy products are a source of vitamin D that can positively affect Ca metabolism and bone health. In fact, it has been found that serum 25(OH) vitamin D levels were increased when 2 servings of Ca- and vitamin D-fortified milk were provided each day for 12 weeks to menopausal women [33]. In a study using the US National Health and Nutrition Evaluation Survey (NHANES) III data [16], and a study of women in menopause [18], a positive correlation between serum 25(OH) vitamin D level and BMD was reported. In our study, osteoporosis risk tended to decrease as serum 25(OH) vitamin D level increased, and the average serum 25(OH) vitamin D level in all subjects was 19.0 ng/mL. This level is slightly lower than the normal level (20 ng/mL). On the other hand, when serum 25(OH) vitamin D levels were analyzed according to quartiles of Ca intake, the Q3 group that had a relatively large number of subjects in the normal range had levels of 18.5-24.0 ng/mL and had the lowest risk of osteoporosis (ORs 0.68). This result is consistent with the findings of previous studies.
The results of this study showed that BMD increases as Ca intakes increases, and that the risk of osteoporosis incidence was reduced when more than 1 serving of milk or dairy products were consumed and serum 25(OH) vitamin D level was maintained in the normal range. Thus, it is considered important that Ca, milk, and dairy product intake should be increased, and that serum 25(OH) vitamin D levels should be maintained in the normal range, for the maintenance of bone health and the prevention of osteoporosis in adults. In addition, it is important for people not only to increase dietary vitamin D intake but also to facilitate sufficient vitamin D synthesis through participation in outdoor activities of at least 30 minutes' duration each day.


 XML Download