

 PDF
PDF ePub
ePub Citation
 Print
Print


Introduction
Obesity is known as a cardiovascular risk factor among adults [1]. The incidence of obesity among children was increased in developing countries [2]. Obese children and adolescents had higher blood pressure during childhood [3], and possess other risk factors of coronary heart disease in the future [4]. Three decades ago, several studies, such as isotope research on hepatic de novo lipogenesis and biochemical studies demonstrated that dietary carbohydrate has an unremarkable role in lipogenesis, and subsequently, in fat accumulation [5]. Therefore, low fat diets were usually prescribed. However, consuming low fat diets had no major effect on the growing trend of obesity [5]. As such, more attentions were paid to carbohydrates. Investigators categorized foods containing carbohydrate according to their potential to elevate post ingestion blood glucose rapidly and named it Glycemic Index (GI) [6]. There are several evidences regarding the effects of dietary GI on obesity, diabetes and hypertension in adults [7-9]. It was suggested that an ad libitum low glycemic index (LGI) diet could not influence the blood pressure among healthy overweight women [9]. The effects of GI diet on obesity in childhood were assessed in a study by Iannuzzi et al. [10]. This clinical trial conducted among obese children could not find any beneficial effect from hypocaloric LGI diet on blood pressure [10]. This study was conducted on both genders with an age range of 7 to 13 years, with different pubertal status. Although a few studies have reported an inverse association between GI and tight intramuscular fat, as an obesity indicator [11], more evidence indicates that there may be a positive relationship between GI and obesity among adults [12,13]. Clinical trials have illustrated inconsistent results. In comparison to the low fat diet, LGI diet showed neutral effects on adulthood obesity [14]. Observational studies among children have reported controversial findings. Body mass index (BMI), waist circumference (WC) and body fat were evaluated in the mentioned studies. One cross-sectional study reported a direct association between GI and obesity among children [15]. These results were not confirmed by other prospective studies [16,17]. There are several clinical trials conducted in different protocols. Some studies have focused on a single meal, and following appetite, satiety, food intake and energy intake [18-20]. Educating the concept of GI is another topic [21,22]. In several studies, investigators have evaluated the effects of LGI diet on obesity. In one study, a list of LGI foods had been prepared and the energy intake had been ad libitum [23]. This study could not show any favorable effect by using LGI diet and obesity. Similar results were gathered in another study with a smaller sample size (n = 8) [24]. In the mentioned study with a small sample size, ad libitum energy intake and unequal distributed macronutrients may confound the results. Other long term studies were conducted on different age groups [25]. There are limited evidences regarding the specific gender and age group with same pubertal status. As a rapid growth in weight and height has been reported in pubertal catch-up growth [26], pubertal status may have a confounder role in obesity-related researches. Furthermore, the prevalence of obesity among girls is higher than boys in Isfahan, a metropolis in Iran [27]. Moreover, the effect of LGI diet in comparison to the healthy nutritional recommendations (HNR) based diet was not assessed. Therefore, we aimed to determine the medium term effects of LGI diet in comparison to the HNR on obesity and blood pressure among adolescent girls in pubertal ages.
Subjects and Methods
Subjects
For conducting this parallel randomized clinical trial, subjects were selected via the Isfahanian student health booklets. Their parents were also invited in a general meeting and comprehensive explanation about this study was described. Furthermore, some volunteers were recruited via flyer advertisements. Informed written consents were completed for children and one of their parents. This study was conducted in Isfahan, Iran in 2011. Volunteers who met the following inclusion criteria were selected: girl, overweight or obese, menstruating, age less than 18 years and no medication using. Participants who started to use medications, which may influence the appetite and weight, and had low compliance were excluded. According to WHO table regarding BMI for age [28], those with BMI values between 85th and 95th percentiles were defined as overweight, and those with BMI values of more than 95th percentile were considered obese. Menstruation, age and use of medications were verbally asked. Finally, fifty volunteers were included in the present study. The sample size was calculated based on the formula suggested for parallel trials [29] N = 2[(Z1-α/2 + Z1-β)2 × S2]/d2 where α (type 1 error) was 0.05, β (type 2 error) was 0.20, S (the variance of body weight) was 3.7 [30] and d (the difference in mean of body weight) was 3.6. We considered the body weight as our principal outcome variable. Therefore, according to the formula, 17 adolescents were needed in each group for adequate power of study. This project was approved by the research council and ethical committee of the School of Nutrition and Food Science, Isfahan University of Medical Science, Isfahan, Iran, and Food Security Research Center, Isfahan University of Medical Science, Isfahan, Iran (project number: 290260). The present study is registered in the Iranian Registry of Clinical Trials (IRCT201109272839N4).
Study procedure
Volunteers were randomly allocated to LGI diet or HNR (n = 25 in each group) for 10 weeks. As this study was a dietary intervention, adolescents were not blinded to the kind of diet that they consumed.
Periodical visits were established each 2.5 weeks. In each visit, subjects were asked about their compliance. Weight was measured during each visit by a blinded assistance. Diets were prescribed to the adolescents and the parents prepared the meals. All the subjects were living independently.
Anthropometric measurements
Anthropometric measurements were conducted at the baseline and on the 10th week. For height measurements, participants were asked to stand near the wall with the shoes off, and touch the wall with their head, heel, shoulder and hip. Wais Circumference was measured by an inelastic tape and with no pressure. Height and WC were measured nearest to 0.1 cm. The body weight measurement was conducted in lightweight clothes and without shoes by a standard scale nearest to 0.1 kg.
Blood pressure measurement
A standard sphygmomanometer was used to measure the systolic and diastolic blood pressure. Measurements were conducted after 3 min resting in sitting position by 2 trained and blinded assistants. The first heart beat was considered as the systolic blood pressure and the last one was considered as the diastolic. Blood pressure assessment was repeated at the end of the trial.
Dietary intervention
At first, the total energy expenditure (TEE) was calculated individually according to the 2005 US Institutes of Medicine formula [31].
TEE was restricted (200 kilocalorie) for those in > 95th percentile of BMI for age according to the table of WHO [28]. Macronutrient distribution was equivalently prescribed in both groups (53-56% of total calorie from carbohydrate, 16-18% of total calorie from proteins and 27-30% of total calorie from fat). The foods that their GI was less than 50 were considered as LGI foods. A list of LGI foods was provided for the intervention group. They were suggested to choose their carbohydrate containing foods from this list; (grains, fruits, vegetables and dairy). High glycemic index (HGI) foods (GI > 50) was forbidden for the intervention group. For choosing non-containing carbohydrate foods (meats and fats), food exchange list was provided for the volunteers, and they were educated. Healthy nutritional recommendations may cover low glycemic index (LGI) based recommendations; to consume whole grains. However, these two kinds of recommendations are different in the fruit and vegetable food groups. For example, most healthy nutritional recommendations did not restrict banana or date intake, but these fruits are forbidden in LGI based recommendations. A list of HNRs was provided for the non-intervention group. The recommendations were focused on avoiding fatty foods, fast foods, fried foods, industrial beverages and unhealthy fats, while drinking 1.5 to 2 liters of water, increasing the intake amount and variety of fruits and vegetables and consuming low fat dairy and whole grains. A complete food exchange list was delivered to nonintervention participants. Volunteers should complete one 24 h dietary record and one 24 h physical activity record for each visit, which was established at every 2.5 weeks. By this procedure, a 4-day dietary and physical activity records (three weekdays and one weekend) were collected. Dietary and physical activity records were checked, and any unclear points were asked. Participants were asked about their adherence and any possible problems in their diets and recommendations. The percent of energy from carbohydrate, protein and fat in the non-intervention group and GI > 50 in the intervention group were considered as markers of adherence in this study. The analysis of the 4 days food records showed that there are no significant differences between the prescribed percent of carbohydrate, protein and fat, and what was reported in the food records (P = 0.202, P = 0.148 and P = 0.172 respectively). Furthermore the mean of GI in the intervention group was lesser than our cut point (mean ± SE; 42.67 ± 0.67).
The GI values were extracted from the native GI table, which included 70 food items [32]. Other GI values were gathered from an international table of glycemic index and glycemic load values [33]. For complex foods, we calculated the GI of carbohydrate containing ingredients. For those that GI values were not measured, we used the reported GI values of the most similar foods. Finally, the GI of whole diet was calculated by this formula [34]:
Statistical analysis
First, the normal distribution of all variables was assessed by using the Kolmogorov-Smirnov test, as well as a histogram curve. According to the results, the distribution of diastolic blood pressure was not normal. For this variable geometric mean was reported. A student t test was used for comparing the mean of nutrient intake, baseline values, endpoint values and percent changes between the two groups. For calculating percent changes, the following formula was used: [(E-B)/B] × 100, in which E shows the end values and B shows the baseline values for each variable. Paired T test was used for comparing the before and after intervention within each group. Ptime, Pgroup and Ptime × group were provided for each variable by using an analysis of the covariance (ANCOVA). As the age of two groups were significantly different, we also considered the possible confounding effect of age. Therefore, the time × age interaction was also reported for all variables.
Subjects were categorized as obese or overweight according to BMI for the age table of WHO [28]. Waist circumference and blood pressure were classified based on the reported cut points [35,36]. All values were reported as the mean ± SE. In this study, P < 0.05 was considered as the significant level. Statistical analysis was performed by using SPSS for windows version 10.
Results
Baseline characteristics
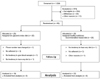
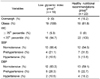
Of the 50 volunteers, 41 subjects (n = 19 in intervention group and n = 22 in non-intervention group) completed the study and included in data analysis (Fig. 1). The age of adolescents in the intervention group was lower than those in the non-intervention group (13.18 ± 0.21 vs 13.98 ± 0.27, P = 0.031). Baseline characteristics of subjects have been illustrated in Table 1. The most subjects of both groups are overweight, abdominally obese and normotensive.
Dietary intake
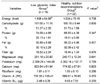
The analysis of the food records showed that there were no significant differences between the consumption of energy (P = 0.708), carbohydrate (P = 0.806), protein (P = 0.347), fat (P = 0.507), fiber (P = 0.975), magnesium (P = 0.641), potassium (P = 0.789), calcium (P = 0.603), riboflavin (P = 0.286), vitamin A (P= 0.253) and vitamin B12 (P= 0.370) in the two groups (Table 2). The GI of the diet in the LGI group was significantly higher than that of the HNR group (42.67 ± 0.067 vs 46.94 ± 1.17 respectively, P = 0.003). The physical activity had no differences between the two groups (1.09 ± 0.01 MET hour/day in intervention group vs 1.12 ± 0.02 MET hour/day in non-intervention group, P = 0.436).
Within and between groups comparison
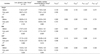
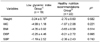
The variations of the anthropometric and blood pressure values at baseline and after intervention in the two groups are shown in Table 3. Although the baseline value of the systolic blood pressure in the non-intervention group was greater than the intervention group (123.86 ± 2.43 vs 117.31 ± 2.00 mmHg, P = 0.049), other variables were not different in two groups. Within group analysis illustrated that in comparison to the baseline values; weight and BMI were decreased after the intervention in two groups (P = 0.0001 for both). There are no significant result regarding to the P value for time, time*group and time*age. Regarding the systolic blood pressure P value for the group is significant (P = 0.016), while this P value is not significant for other variables.
The percent changes of the body weight status and blood pressure are illustrated in Table 4. The comparison between the two groups did not show any difference in percent changes of anthropometric variables. Similar findings were observed for percent changes of blood pressure.
Discussion
This randomized parallel study showed that the changes and variations of weight status and blood pressure were similar in LGI diet consumers and those in the HNR group after a 10-week intervention. Although there are several studies in which the effect of LGI diet on obesity and blood pressure was assessed, to our knowledge, this study is the first randomized clinical trial, focused on adolescents with specific gender, that compared the effects of LGI diet with HNR based diet.
Aside from the effects of genetics, environmental variables, such as diet, have an important role in the onset and treatment of obesity [5].
Our analysis illustrated that a reduction in body weight and BMI was statistically significant within each group. A long-term parallel clinical trial conducted on 26 obese subjects aged 7-13 years demonstrated that BMI was decreased after consuming either a hypocaloric LGI diet or hypocaloric HGI diet [10]. In addition, a significant reduction in WC (not in BMI) was also reported for hypocaloric LGI diet consumers. Comparative analysis was not reported in this study; therefore, we could not compare between LGI diet and HGI diet. Furthermore, severe energy intake limitation (30%) administered in this study may disturb the growth trend and may be unethical.
The comparison between the two groups did not demonstrate any difference in BMI and WC. This result supported a long-term (6-month) study comparing the effects of four diets with different GI and protein content on obesity among the age population of 5 to 18-year olds [25]. The results of an aforementioned study showed that the changes in BMI and WC were not different between the groups. Unlike to present study, Parillo et al. reported that a hypocaloric LGI diet (GI = 60), in comparison to a hypocaloric high glycemic index diet (GI = 90), provided a more weight loss [36]. The sample of this study included 22 obese children from both genders. Differences in gender of samples, GI cut-off point, duration of study and comparing LGI diet vs. HGI diet may explain the differences between the findings of an aforementioned study and our study.
Limited evidence exists for the influence of the GI on blood pressure among children and adolescents. Iannuzzi et al. [10] study showed that either LGI diet or HGI diet could decrease the blood pressure among children. The results of another study demonstrated that in comparison to HGI diet, LGI diet could not improve the blood pressure in children [36]. Hence, the reported evidence was not consistent.
A within-group comparison in the current study demonstrated that anthropometric values were decreased following the intervention in the two groups. Prescribed diets in both groups were balanced in terms of energy and macronutrient compositions. These diets were administered according to each individual's requirement. Therefore, this balance is responsible for weight reduction in each group. This result confirmed that the role of dietary balance in weight status is more important than that of dietary GI.
Between groups analysis showed that in comparison to the HNR, LGI diet could not change the anthropometric and blood pressure values following the intervention. The differences in GI values between the two groups may justify these findings. According to the Iranian native GI table [32], Iranian staple foods, such as rice and white breads, were not considered as HGI food [33]. As such, it is possible that GI did not have a sufficient physiological difference between the two groups. Indeed, the effects of HGI diet on weight and blood pressure may not be declared in the current study. On the other hand, ethical limitations did not let us prescribe HGI diet to adolescents.
There were some suggested controversial mechanisms in relation to the effects of GI on obesity. High glycemic index foods induce insulin secretion and suppress glucagon releasing [15,37]. Insulin inhibits lipolysis and gelyconeogenesis, and stimulates lipogenesis and glycogenesis [15,37]. Thereafter, a rapid downfall in the blood glucose occurred, and the hungry inducing process was activated [37]. Therefore, hungry stimulating effect of HGI foods may result in more energy intake and obesity. Moreover, the effect of insulin on fatty acid oxidation suppression in the long-term may induce insulin resistance [17], which may be recognized as a risk factor of obesity.
On the other hand, HGI foods induce leptin release, a food intake suppressor, and insulin secretion, simultaneously [16]. Leptin function depends on insulin presence [16]. Therefore, GI of foods theoretically have two possible antonym roles in obesity.
The findings of LaCombe and Ganji [38] study showed that one of the major dietary patterns among Iranian children is sweet dietary pattern. The load of ice cream, sugar, soft drinks, refined grains and sweet desserts are high in this pattern [38]. The GI of this dietary pattern should be assessed in future studies. Furthermore, in respect to healthy beneficial effects of legumes [39,40], the effects of a LGI-high legume diet on blood pressure and obesity should be evaluated in future studies.
We should acknowledge that several limitations affected the current findings. The possible lack of a physiological difference in GI between the two groups is the major limitation. Socioeconomic status was also not assessed in this study. Another limitation is that blood pressure was measured one time each visits.
The strength of this study included sufficient sample size, samples from specific gender in pubertal ages, same macro and micro nutrient consumption between the two groups, sufficient intervention period and comprehensive statistical analysis.
Conclusion: The main finding of this study is that both intervention methods provided a significant reduction in body weight and BMI; however, not in blood pressure and abdominal obesity. Further studies with long-term follow up should be conducted.
 XML Download