

 PDF
PDF ePub
ePub Citation
 Print
Print


Introduction
Epidemiologic investigations that focus on overall dietary patterns have been widely reported across various chronic diseases [1-3]. Implications from such reports, rather than from findings on specific nutrients associated with a disease, are considered more likely to parallel the situation in real life and thus may be more applicable to public health. There is a paucity of data on the causal association between dietary patterns and the development of metabolic syndrome (MetSyn) [4,5], while data on the association with MetSyn prevalence are accumulating [4,6-11]. Findings among a Spanish population showed that higher dietary scores, which reflect the Mediterranean dietary pattern, are inversely associated with MetSyn incidence during a 6-year follow-up period [12]. A subsequent study focusing on the Mediterranean-style diet among a U.S. population supported the previous findings [13]. The Mediterranean-style dietary pattern was derived from the dietary guidelines for Greek adults and included major food groups such as grains, vegetables, legumes and nuts, fruit, olive oil, dairy products, and fish [4]. There is a prospective study, which explored dietary patterns using data-driven analysis methods rather than using score-based analysis methods for their association with MetSyn [5]. This study examined 2 major dietary patterns, a Western pattern and a prudent pattern, and found that higher factor scores of the Western pattern were positively associated with the risk of MetSyn. However, the prudent pattern including higher consumption of vegetables and fruit, fish and seafood, poultry, whole grains, legumes, low-fat dairy products, and nuts did not reduce the risk of MetSyn [5]. This is possibly because of a limited sample size or the inability to minimize the influence of dietary changes after learning of the diagnosis of dyslipidemia or hypertension. Thus, data on healthy dietary patterns, besides the Mediterranean diet, which are protective against MetSyn incidence, are warranted. In particular, dietary patterns associated with MetSyn incidence have not yet been reported for Asian populations, who tend to have a low fat and high carbohydrate diet or high fish and soybean consumption [10,11,14]. Such diets have been shown to be protective against cardiovascular disease in both Asian and non-Asian populations [15-18].
To test whether specific dietary patterns are associated with MetSyn risk, we prospectively investigated MetSyn incidence, explored dietary patterns, and then analyzed the association between dietary patterns and MetSyn risk among Korean adults. In addition, we examined individual food groups characterizing the dietary patterns in relation to MetSyn risk.
Subjects and Methods
Study population
The present study is embedded within population-based prospective cohort studies, which are ongoing investigations and part of the Korean Genome Epidemiology Study. Detailed information on the cohort studies has been previously reported [19,20]. Cohort members were aged 40-69 years when they were enrolled at one of the 2 study sites, Korea University Ansan Hospital or the Ajou University Medical Center. Baseline examinations at both sites started from June 18, 2001, and they were completed by January 29, 2003. All members were invited to participate in a comprehensive health examination and a questionnaire-based interview. During the site visit, they completed a health examination that included the evaluation of anthropometric parameters, measurement of blood pressure, and the collection of biospecimens for assays. They also completed the questionnaire on demographic information, dietary intake, lifestyle, medical history, and health condition. Participants were invited for biannual follow-up visits in order to have repeated interviews and health examinations. All study procedures were conducted by trained interviewers and health professionals, who followed a standardized protocol. At each visit, participants signed an informed consent form. All study procedures were approved by the Human Subjects Review Committee either at the Korea University Ansan Hospital or at the Ajou University Medical Center.
Since MetSyn incidence was the outcome of interest, participants who were free of MetSyn during the initial examination were eligible for this study (n=7,298). Participants who provided insufficient or inadequate dietary information (for example, reporting > 6 standard deviations from the mean of calorie intake) were excluded (n=362). In addition, to minimize the influence of dietary changes after learning of the diagnosis of disease, participants who had self-reported diagnoses of cardiovascular disease, cancer, diabetes mellitus, hypertension, or dyslipidemia were further excluded (n=716). After making these exclusions, 84.4% remained in the study for the 2-year follow-up period from April 17, 2003 to February 20, 2005, and thus, a total of 5,251 participants entered the analysis for this first period. Those who met the same inclusion criteria and were not diagnosed with MetSyn during the first follow-up period remained in the analysis for the second follow-up period from February 21, 2005, to November 17, 2006, and similarly, for the third follow-up period from January 15, 2006 to March 12, 2009. Eighty five percent of the participants in the first period were followed up until the third period.
Dietary assessment
Dietary information was obtained using a semi-quantitative food frequency questionnaire (FFQ), which was developed and evaluated for validity by the Korea Centers for Disease Control and Prevention (Seoul, Korea) [21]. For the recall of food items or beverages consumed in the previous year, participants were asked to complete the FFQ table with inquiries about information on the average consumption frequency and serving size for 103 food items. For each food item, 9 categories of consumption frequency, ranging from "almost never" to "3 or more times per day", were reported. In addition, the serving size was queried. Trained interviewers showed food pictures to help participants select one of the 3 serving size options (smaller than, equal to, or larger than a standard serving size). The average frequency of each food item was calculated by multiplying the consumption frequency by 0.5 for smaller amounts, 1 for equal amounts, or 1.5 for larger amounts versus the standard serving size. For the purpose of analysis for deriving dietary patterns, the 103 food items from the FFQ were classified into 27 food groups similar to that used in a previous study [22], which investigated dietary patterns among Koreans. The average frequency of consumption for a specific food group was calculated by adding up frequencies for all food items that belonged to that particular food group. The average daily consumption of nutrients was calculated on the basis of FFQ responses and the food composition database published by the Rural Development Administration of Korea [23]. In this study, dietary information from the baseline FFQ, which was collected between June 18, 2001 and January 29, 2003, was utilized for analysis because all of the subjects who responded to the baseline FFQ were ascertained for MetSyn in at least one of the follow-up periods.
Definition and measurements for metabolic syndrome
Individuals were diagnosed with MetSyn if they met at least 3 of the 5 diagnostic criteria for MetSyn. The definition given by Alberti et al. [24] was used for the diagnostic criteria of MetSyn components, except abdominal obesity. An alternative criterion suggested by the Korean Society for the Study of Obesity [25] was used to define abdominal obesity. Thus, the following criteria for each component were used: abdominal obesity (waist circumference ≥ 90 cm for men and ≥ 85 cm for women), high concentrations of serum triglycerides (≥ 150 mg/dL or the use of medications for lowering blood lipid), low concentrations of serum high density lipoprotein (HDL) cholesterol (< 40 mg/dL for men and < 50 mg/dL for women), high blood pressure (systolic ≥ 130 mmHg, diastolic ≥ 85 mmHg, or the use of antihypertensive medications), and high concentrations of fasting plasma glucose (≥ 100 mg/dL or the use of hypoglycemic agents).
Trained personnel performed an anthropometric examination and took blood pressure measurements of each participant wearing light clothing. With an inelastic but flexible measuring tape, waist circumference was measured at the narrowest part of the waist between the lower rib and the iliac crest to the nearest 0.1cm and calculated as the average of 3 measurements. Blood pressure was measured in a sitting position with a mercury sphygmomanometer (Baumanometer®, W.A. Baum Co., Inc., Copiague, NY, USA) after at least a 5-minute period of rest. A repeated measurement of blood pressure was taken approximately 30 seconds after the first measurement and recorded to the nearest 2 mmHg. The systolic and diastolic blood pressures used in this report were based on the average of the 2 measurements. All participants had fasted for at least 8 hours before the beginning of blood collection. Assays were conducted for blood concentrations of HDL-cholesterol, triglycerides, and glucose. Inter-assay coefficient variations from routine assays were reported as 3.8% for HDL-cholesterol, 5.2% for triglycerides, and 2.8% for glucose.
Potential confounding factors
We considered potential confounding characteristics such as age, income, occupation, educational level, smoking status, alcohol consumption, physical activity, calorie intake, and FTO rs9939609 genotypes, which were reportedly associated with MetSyn [26]. Detailed information on the calculated average daily alcohol consumption and total metabolic equivalent score (MET/hour) for physical activity is available elsewhere [19]. In this study, information on demographic characteristics and lifestyle variables was taken from the baseline questionnaires and FTO rs9939609 genotype information was derived from the genome-wide association data that have been described in an earlier study [27].
Statistical analysis
Food groups and alcoholic beverages were used for factor analysis to generate major dietary patterns and factor loadings. Varimax rotation method was applied for greater interpretability. After evaluation of eigenvalues (greater than 2.0) and the Scree test, 2 factors, which were labeled as dietary patterns, were determined. Factor scores for each dietary pattern, which were assigned to individuals, were classified into quintiles. To test associations between dietary patterns and the incidence of MetSyn, pooled logistic regression analysis was used to calculate relative risk (RR) and 95% confidence interval (CI). Using the lowest quintile of factor scores, the multivariable-adjusted RR was derived after adjusting for potential confounding variables including age (continuous variable), sex, income (monthly wage of < 106 or ≥ 106 won), occupation (office job, non-office job, or housework), educational level (< 9 or ≥ 9 years of schooling), smoking status (never smoked, former smoker, current smoker smoking < 20 or 20+ cigarettes daily), alcohol consumption status (abstainer, drinker with alcohol consumption of < 5.1, 5.1-15, 15.1-30, > 30 g/day), physical activity (quintiles of metabolic equivalents per hour, daily), and quartiles of average daily calorie intake. Associations between specific food groups and MetSyn risk were also examined. Average daily servings of 5 food groups, such as (1) grains, noodles, flour products, and starchy vegetables; (2) meat, fish and seafood, eggs, and legumes; (3) green and orange vegetables, kimchi, mushrooms, and seaweed; (4) fruits; and (5) dairy products were classified into quintiles. Consumption of nuts and sweetened carbonated beverage was dichotomized into "no consumption" versus "consumption". Consumption of green tea was classified into "no consumption", "consumption less than once a day", and "daily consumption" and coffee drinking was classified into quintiles. Using the lowest consumption group as the reference group, the multivariable-adjusted RR and 95% CI were calculated. Tests for linear trends were conducted by assigning the median value of each category as factor scores for dietary patterns or servings per day for specific foods in the model. In addition, the relationship between dietary patterns and individual diagnostic criteria of MetSyn that contribute to case occurrence was evaluated. All testing was based on a 2-sided level of significance. The SAS program (SAS 9.1.3, 2008, SAS Institute, Cary, NC, USA) was used to conduct statistical analyses.
Results
Characteristics and dietary intake of the study participants
During a 6-year follow-up period, 1,325 cases (658 men and 667 women) of MetSyn were newly identified. When comparing individuals who participated in the follow-up evaluations with those who did not, there was no significant difference in the distribution of quintiles of factor scores for each dietary pattern. It was observed that the proportion of macronutrients from calories were 71% for carbohydrate, 14% for fat, and 15% for protein reflecting a typical caloric distribution examined among Korean adults [22]. Average servings, consumed daily, were 3.9 servings of grains and starches (refined white rice, mixed grain rice, flour products, cereal, and starch vegetables), 2.7 servings of protein foods (red meat, processed meat, fish and other seafood, eggs, poultry, and legumes), 7.4 servings of vegetables (vegetables except starch vegetables and seaweed), 1.6 servings of fruits, and 0.7 servings of dairy products. According to the Bicycle Food Guide endorsed by the Korean Nutrition Society [28], 3-4 servings of grains and starches (approximately equal to 3.5-5 cups of cooked rice), 2.5-5 servings of protein foods (approximately equal to 1-2 cups of fish or meat), 5-7 servings of vegetables (approximately equal to 2-3 cups of spinach), 1-3 servings of fruits (approximately equal to half to one and a half of an apple), and 1 serving of dairy products (approximately equal to 1 cup of milk) are recommended for adults aged 19 years or older. Considering these recommendations, the study participants were less likely to consume dairy products although the estimates of consumption might be underestimated because of the use of the FFQ, which included limited food items.
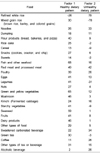
Table 1 presents the factor loading scores for the 2 derived dietary patterns. Factors 1 and 2 explain 13.5% and 7.5% of the variability, respectively. Factor 1 was characterized by the high intake of a variety of foods including fish and seafood, vegetables, seaweed, meat, dairy products, mushroom, eggs, legumes, fruits, potatoes, flour products, poultry, green tea and other tea, and mixed grain rice, which showed 30 or more after being multiplied by 100. In contrast, factor 2 was characterized by the high intake of limited food items, such as refined white rice, meat, sweetened carbonated beverage, and noodles, and by the low intake of mixed grain rice and legumes. On the basis of these characteristics, we labeled factor 1 as the healthy dietary pattern and factor 2 as the unhealthy dietary pattern.
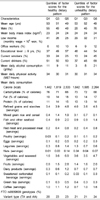
In Table 2, age-standardized characteristics are shown across the quintiles of factor scores for the healthy dietary pattern and the unhealthy dietary pattern. Participants with higher scores of the healthy dietary pattern were likely to have more education and higher incomes while those with higher scores of the unhealthy dietary pattern were likely to be men, smokers, office workers, and alcohol consumers. The average ratios of carbohydrate, fat, and protein for a given daily calorie intake for those in the top quintile of the healthy diet scores were 66%, 18%, and 15%, respectively. The average servings per day were 4.8 servings for grains and starches, 5.0 servings for protein foods, 6.9 servings for vegetables, 2.8 servings for fruits, and 1.2 servings for dairy products. These findings support the recommended servings of the Korean Food Guide. In contrast, participants in the bottom quintile of the healthy diet scores were likely to consume a high carbohydrate diet, consisting of refined grains and starches. Those in the top quintiles of the unhealthy diet scores were less likely to consume mixed grain rice, cereal, and legumes and more likely to consume red meat, processed meat, and sweetened carbonated beverages.
Association between dietary intake and metabolic syndrome
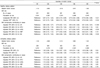
Table 3 shows the associations of dietary patterns with MetSyn incidence and its individual diagnostic criteria. After controlling for potential confounding factors, the risk of MetSyn was inversely associated with higher quintiles of factor scores for the healthy dietary pattern (P-value for linear trend < 0.05); the multivariable-adjusted RR [95% CI] for MetSyn risk was 0.76 [0.60-0.97] for individuals in the top quintile when compared with those in the bottom quintile. The interaction between gender and the healthy dietary pattern was analyzed and found to be non-significant. When we analyzed the components that contributed to the incidence of MetSyn associated with dietary patterns, the healthy dietary pattern showed favorable effects on 3 components: large waist circumference (LW), low serum HDL-cholesterol (LHDL), and high fasting glucose (HG). The multivariable-adjusted RRs were 0.61 [0.45-0.81] for LW, 0.73 [0.56-0.95] for LHDL, and 0.67 [0.45-0.99] for HG for participants in the top quintile compared with those in the bottom quintile of the healthy diet scores. On the contrary, the unhealthy dietary pattern had no association with MetSyn risk (P-value for linear trend =0.38) and had a positive association with LW (P-value for linear trend < 0.01). Because there was a significant interaction between gender and the unhealthy dietary pattern (P-value for the interaction term < 0.05), we further analyzed associations stratified by gender (data available from authors on request). A significant association between the unhealthy dietary pattern and MetSyn risk was found only among women; multivariable-adjusted RR [95% CI] were 1.18 [0.92-1.50] for the second quintile, 1.07 [0.83-1.37] for the third quintile, 1.37 [1.07-1.75] for the fourth quintile, and 1.36 [0.99-1.87] for the top quintile when compared with the bottom quintile.
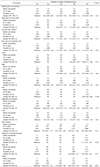
Table 4 shows the associations between individual food groups and MetSyn incidence. The multivariate models took into account the potential confounding factors listed in Table 3. The consumption of dairy products and nuts was independently associated with MetSyn risk. Participants with an average daily consumption of 1.6 servings of dairy products had a 20% [4%-33%] reduced risk of MetSyn and those eating an average of 20-25 g of nuts per week had a 31% [14%-44%] risk reduction. In contrast, participants drinking 1 cup of sweetened carbonated beverage a week, on average, were at an elevated risk of MetSyn; the multivariable-adjusted RR [95% CI] was 1.17 [1.02-1.35]. When analyzing the individual diagnostic criteria of MetSyn, the beneficial effects of dairy product or nut consumption and the detrimental effects of drinking sweetened carbonated beverages appeared to be driven by associations with abdominal obesity (P-value for trend < 0.05 for dairy products, nuts, or sweetened carbonated beverages), triglycerides (P-value for trend < 0.05 for dairy products or nuts), HDL-cholesterol (P-value for trend < 0.05 for dairy products, nuts, or sweetened carbonated beverages), or blood pressure (P-value for trend < 0.05 for dairy products and P-value for trend = 0.05 for nuts).
Discussion
In a population-based cohort study including middle-aged and older Korean men and women, we identified 2 major dietary patterns using factor analysis. One pattern was labeled as a healthy dietary pattern, which included the consumption of a wide variety of foods, such as grains and starches, vegetables and fruits, and protein foods, including fish and seafood, meat, poultry, eggs, legumes, and dairy products. The other pattern was labeled as an unhealthy dietary pattern including refined rice, meat, sweetened drinks, and noodles. We observed a 24% reduction in MetSyn risk among individuals with the highest factor scores of the healthy dietary pattern when compared with those with the lowest scores after taking into account potential risk factors. The inverse association between factor scores of the healthy dietary pattern and MetSyn risk was found to be derived from associations with some individual diagnostic criteria of MetSyn such as abdominal obesity, HDL-cholesterol, and fasting glucose.
A few cross-sectional [7] and prospective [5] epidemiological studies have explored dietary patterns and have reported their associations with metabolic syndrome. Dietary patterns found among populations living in North America and European countries include a prudent or healthy diet, which has been typified by high intakes of whole grains, legumes, poultry, fish, vegetable, and fruit, and a Western diet, which has been characterized by high intake of refined grains, red meats, and high fat foods [5,6,8]. Although data among other ethnic groups are limited, some studies have reported dietary patterns for Hispanics [9], Iranians [7], and Asian populations [10,11,14]. These studies demonstrated not only a healthy-style and a Western-style diet but also an ethnic-specific diet, which is a high carbohydrate diet consisting of rice, legumes, and vegetables, and found a positive association [9] or no association [7,10] between an ethnic-specific pattern and MetSyn prevalence. Among MetSyn components, in particular, a high carbohydrate diet seemed to have detrimental effects on HDL-cholesterol, triglycerides, and glucose homeostasis [7,9,10], but its causality was undetermined. Thus far, only 1 study [5] has prospectively evaluated the relation of the development of MetSyn with dietary patterns that were derived using factor analysis methods. Lutsey et al. [5] identified a prudent diet and a Western diet and found that MetSyn risk has no association with a prudent diet, but has a significant association with a Western diet. They characterized a Western diet as high consumption of meat, fried foods, and sugar-sweetened or artificially sweetened beverages, which individually elevated MetSyn risk [5]. Our study provides evidence that a healthy dietary pattern consisting of a variety of food choices has a significant inverse association with MetSyn incidence among Korean adults. In our analysis of individual food items, we confirmed a positive association for sweetened carbonated beverage consumption and an inverse association for dairy intake as shown in earlier studies [5,29,30]. Although we do not have specific information on artificially sweetened drinks (or diet soda) or sugar-sweetened carbonated drinks (or regular soda), both types might have contributed to the elevated risk [29]. Regarding dairy intake, we did not distinguish between low fat and regular products on the questionnaire, but low fat products are not commonly used among Koreans. Therefore, our data suggest that consumption of dairy products with regular fat may not be detrimental. Similar findings have been reported in an earlier study that demonstrated beneficial effects of high dairy product intake on all MetSyn components [31]. We also found beneficial effects of nut consumption among the study population, only 12% of whom regularly consumed nuts at least twice a week. Formerly, only 1 prospective study examined the association between nut consumption and MetSyn incidence, but a null association was found after adjusting for smoking, physical exercise, and dietary factors [5]. Thus, we provide novel data on the link between nut consumption and the protection of MetSyn. Although vegetables, fish and seafood, which were major food items characterizing the healthy dietary pattern, were not individually associated with MetSyn risk, these foods are considered elements of a healthy diet. Consumption of fish rich in n-3 polyunsaturated fatty acids, which were found to be protective against MetSyn incidence, in our previous study [32], might have contributed to the beneficial effects of the healthy dietary pattern on MetSyn. Furthermore, we postulate that other constituents of the healthy dietary pattern include monounsaturated fatty acids, fiber, high quality protein, low glycemic index, vitamins, minerals, and other bioactive compounds and that the unhealthy dietary pattern includes limited amounts of these constituents. Interestingly, we observed that people with the healthy dietary pattern are less likely to have a large waist circumference even after adjustment for caloric intake. This may be due to the effects of foods that have lipolytic actions in abdominal adipose tissue. We found that the consumption of dairy products and nuts was inversely associated with waist circumference, as reported in other studies [33,34].
The strengths of the present study include its population-based setting, the use of standardized methods to identify outcomes, and consideration of a broad range of confounding variables. However, several limitations should be considered in interpreting our findings. We collected dietary information using a food- and dish-based FFQ, which was constructed on the basis of dietary information from the Korea National Health and Nutrition Examination Survey [21] to include food items that are frequently consumed by Korean adults. However, because the FFQ does not query consumption of cooking oil and seasonings added in dishes, fat and sodium intake were likely underestimated. Further investigations may need to identify proper quantities of constituents that make up the healthy dietary pattern. Because dietary patterns identified using the factor analysis method are specific for a study sample, similar dietary patterns that we observed may not be found for other populations, in particular the younger or older populations or populations from other ethnic backgrounds.
In conclusion, we encourage a healthy diet that includes a variety of food choices and corresponds to the recommendation for Korean adults [28] for the prevention of MetSyn development on the basis of the significant association between such a diet and MetSyn risk.
 XML Download