

 PDF
PDF ePub
ePub Citation
 Print
Print


Introduction
The prevalence of overweight or obesity in preschool children has steadily increased worldwide over a decade, from 4.2% in 1990 to 6.7% in 2010 [1]. Consistent with the worldwide trend, the overweight or obesity epidemic in Korea has progressed gradually among children of ages 2 to 6 years, reaching an estimated 14.4% in 1997 and 16.3% in 2005 [2], highlighting a new public health concern. Obesity at an early age has serious implications not only for the short-term but also for long-term health consequences, given that childhood obesity typically persists into adulthood [3] and has been identified as important predictors of cardiovascular disease [4], type 2 diabetes mellitus [5], and early death [6] in adulthood. Such implications suggest that the prevention of early onset obesity may be critical in delaying the initiation of chronic disease processes throughout life.
Dietary habits are established during early childhood and may persist throughout childhood and beyond [7,8]. Similarly, levels of physical activity and sedentary behaviors persist over time [9,10]. Together, these trends suggest that the preschool period could be crucial to the lifelong effects of positive energy balance, presumably induced by high energy intake and low physical activity, and to the likelihood of becoming obese adults. However, relatively few epidemiologic studies have focused on obesity in preschool children, and studies are even sparser for Korean preschool children. Previous studies have identified plausible contributors to overweight and/or obesity in preschoolers, including the following: diets high in animal products [11], a high proportion of total energy intake from fat [12], low fruit and vegetable consumption [13], high levels of sugar-sweetened beverage consumption [14,15], skipping breakfast [16], insufficient physical activity, prolonged TV viewing [17,18], and infrequent family meals [19,20]. However, the available literature is insufficient to confirm existing evidence from other countries because most of the studies from Korea have included small sample sizes and did not adjust for important confounding factors. Koreans have still retained dietary patterns low in saturated fat and high in vegetables, while they have substantially increased their levels of animal protein consumption over the past few decades that accompany the rapid economic development and the adoption of Western-style foods [21].
The 2009 Korean Dietary Action Guides for Children (KDAGC) [22], a dietary and activity guideline for children aged 3-12 years, issued by the Korea Ministry of Health and Welfare, provides recommendations to promote healthy eating and physical activity choices. However, few efforts have been initiated to evaluate the degree of adherence to this national guideline and the subsequent health outcomes among preschool children. We thus created a measure to evaluate the level of adherence to all 19 practice recommendations of the 2009 KDAGC to rate the overall quality of dietary and activity behaviors. We named this measure the Korean Dietary Action Guides for Children Adherence Index (KDAGCAI).
Considering all the above factors, understanding Korean children's overall quality of dietary or activity behaviors could promote a comprehensive and strategic approach to developing intervention programs and policy initiatives for the prevention of childhood obesity. The present study aimed to examine the relationships between the prevalence of overweight or obesity and the quality of dietary and activity behaviors, as measured by the 2009 KDAGCAI-score, and the frequency of fruit and vegetable consumption in a representative sample of children aged 4-7 years attending 400 child care centers in Seoul, Korea.
Subjects and Methods
Study participants
A cross-sectional survey was conducted in Seoul between November 2010 and January 2011 to assess dietary behaviors and related factors of preschool children. To obtain a representative sample, a multi-stage stratified cluster sampling design was used in which we performed stratifications first by districts, then by types of care centers, and last by the density of children enrolled in child care centers. The Seoul metropolitan area is divided into a total of 25 administrative districts, and of these districts, we excluded 2 for which there was no information on the age of the preschool children. We then excluded centers in which no children aged 4-7 years were enrolled or that were classified neither as a private nor as a public center, leaving a total of 1939 centers. Children were recruited from 400 of 1939 child care centers (private, n = 295; public, n = 105) within 23 districts.
We mailed survey packages to the participating child care centers. Each package contained invitation letters, consent forms, survey instructions, and self-administered parent questionnaires concerning demographics, children's dietary and activity behaviors, and frequency of fruit and vegetable consumption. Completed survey questionnaires were obtained for a total of 3,096 children. Of 3,096 children, we excluded those for whom there was no information on sex (n = 393), height or weight (n = 560), or who had an implausible height (< 50 or > 170 cm, n = 6) or weight value (< 3 or > 80 kg, n = 2). We also excluded children for which at least one question on the KDAGCAI components (n = 97) was left blank. After all the exclusions, the remaining 2,038 children constituted the primary analyses. For frequency of fruit and vegetable consumption, we separately excluded participants if they had missing information regarding fruit (n = 131) or vegetable consumption (n = 99), including 2,004 children for fruit and 2,036 children for vegetable consumption. The Institutional Review Board of the Sungshin Women's University approved the protocol for this study, and all parents of participating children provided signed informed consent.
The Korean Dietary Action Guides for Children Adherence Index (KDAGCAI)
A set of behavioral qualities related to diet and activity were assessed with the parental involvement questionnaire derived from the 2009 KDAGC [22]. In 2003, the Korea Ministry of Health and Welfare issued the first dietary guidelines for Koreans (DGK) [23] to promote health and to reduce the risk for preventable diet-related disease by promoting healthy eating and physical activity throughout the life cycle. The revised edition of the 2003 DGK was released in 2009 and has the same basic principles as the previous version, with more emphasis on the average daily serving sizes of food groups, snacking frequency, and healthy activity (both physical activity and sedentary behavior). The current guidelines were developed in collaboration with expert committees in the fields of nutrition, preventive medicine, and health promotion, as well as the various agencies from the Ministries of Health and Welfare, Agriculture and Forestry, Education and Human Resources Development, and the Environment; these are based on an in-depth review of the research evidence from the Korea National Health and Examination Survey (KNHANES 2005 and 2007) [24,25] representing current nutritional status, population-level health problems, and the changing patterns of chronic disease prevalence. In this cross-sectional analysis, we used a 5-point Likert scale to determine the extent to which children adhere to the 19 practice recommendations based on the primary 5 guideline messages of the 2009 KDBGC and named it the Korean Dietary Action Guides for Children Adherence Index (KDAGCAI). Each index item was scored using the following 5-point Likert scale: 1 = not met; 2 = minimally met; 3 = modestly met; 4 = well met; and 5 = fully met. For a measure of the overall quality of an individual's dietary habits and level of activity, we averaged a total of 19 components and assigned a single score out of a maximum 5 points, with a higher score representing better quality of dietary and activity behaviors. Each component contributes equally to the total score.
Fruit and vegetable consumption and preference
Parents were asked to report their children's usual fruit and vegetable consumption per week based on a questionnaire in which we assigned midpoints on 6 consumption frequency scales: 7 (daily); 5.5 (5-6 times/week); 3.5 (3-4 times/week); 1.5 (1-2 times/week); 0.63 (2-3 times/month); to 0 (1 times or less/month). Parents were also asked to rate two questions in relation to their children's fruit and vegetable preferences using a 5-point Likert scale: 5 = extremely high; 4 = high; 3 = moderate; 2 = low; and 1 = extremely low level of preference.
Demographic characteristics and other variables
The parents of participating children answered questions regarding area of residence, relationship with the child (father, mother, grandparents on either mother's side or father's side), parent's occupation (professional, government official, general office worker, housewife, and others), monthly household income, family size, and children's dietary supplement use.
Classification of overweight and obesity
Parents reported their children's weight (kg) and height (cm). We calculated body mass index (BMI) as weight (kg) divided by height (m2). Using age- and sex-specific BMI percentiles based on the 2007 Korean national growth charts [26], we defined overweight as a BMI at or above the 85th percentile and lower than the 95th percentile, obesity as a BMI at or above the 95th percentile, and lean/normal as less than the 85th percentile. In the additional analysis, we also used the International Obesity Task Force (IOTF) reference [27], for comparison with the studies of Western children.
Statistical analysis
We compared the characteristics of children across three BMI percentile categories by using chi-square tests for categorical variables and an analysis of variance (ANOVA) for continuous variables. We used generalized linear regression models to calculate multivariate-adjusted geometric means and 95% confidence intervals (CIs) for each KDAGCAI component and for the total average KDAGCAI-score across three BMI categories. The multivariate-adjusted model included age (years), sex, and monthly household income (≤ 1,990,000, 2,000,000-3,990,000, and ≥ 4,000,000 Korean won, KRW). Missing indicator variables were created for monthly household income. We tested for linear trends across BMI percentile categories by assigning a median value to each category and entering the values into the model as a continuous variable. The degree of the association between children's preferences and the consumption of fruit and vegetables was estimated using Spearman partial correlation analyses adjusted for age, sex, and monthly household income. To investigate the association between the KDAGCAI-score and the frequency of fruit and vegetable consumption in relation to the prevalence of overweight or obesity, we used polytomous logistic regression models (overweight vs. lean/normal or obesity vs. lean/normal), adjusting for the same variables that we used in the generalized linear regression models, and tested the linear trends. To further evaluate the potential for effect modification of overweight or obesity and KDAGCAI-score (categorized into two groups based on the median value of the total population), we stratified analyses by age (4-5 and 6-7 years), sex, and levels of monthly household income (≤ 3,990,000 and ≥ 4,000,000 KRW) and included the cross-product interaction within the same models; the statistical significance of the interactions were assessed by using the Wald test. All analyses were performed using SAS statistical software, version 9.2 (SAS Institute, Inc., Cary, NC). All P values are two-sided.
Results
Characteristics of preschool age children according to BMI levels
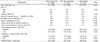
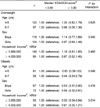
The estimated prevalence of overweight and obesity using the Korea 2007 reference was 10.8% and 6.8%, respectively (Table 1), which differ slightly from the estimates using the IOTF reference (12.9% and 4.4%, respectively) but were similar in total prevalence of overweight or obesity. Compared with lean/normal weight children, obese children were significantly more likely to live in low-income households (P = 0.011), to have a lower preference for vegetable (P = 0.003) and fruit (P = 0.017), and to have lower quality of dietary and activity behaviors (P < 0.001), as indicated by the KDAGCAI-score. Obese children were also more likely to have preferential likes and dislikes of certain foods, have full-time working mothers, and live in large household sizes (≥4 members), but these relationships did not reach statistical significance.
KDAGCAI-scores according to BMI levels
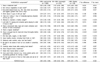
Obese children had lower adherence to the KDAGCAI compared to those with lean/normal weight (3.69 vs. 3.85; P trend = 0.002) (Table 2). We found significant monotonic trends of decreasing adherence to 9 index items with increasing BMI adjusted for age, sex, and household income: 'protein-based foods' (P trend = 0.027); 'healthy weight' (P trend < 0.001); 'TV viewing/computer game playing' (P trend = 0.004); 'structured meal/snack schedule and amount of foods consumed' (P trend < 0.001); 'enough time for meal' (P trend < 0.001); 'salty, sugary, and fatty foods' (P trend < 0.001); 'healthy snacks' (P trend = 0.003); 'carefully selected foods' (P trend = 0.067); and 'frequent family mealtimes (P trend = 0.001); however, the mean adherence score was slightly higher in overweight children than in lean/normal weight peers for 'structured meal/snack schedule and amount of food consumed' and 'healthy snacks'. In contrast, obese children had a higher mean adherence score of 'good table manners' than lean/normal groups (3.96 for obese group and 3.68 for those with lean/normal weight; P trend < 0.001). Additionally, obese children were less likely to comply with 'have a balanced diet' or 'eat various vegetables at each meal' compared with lean/normal weight children.
Risk of overweight and obesity according to fruit and vegetable consumption levels
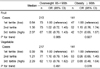
Daily vegetable intake, but not fruit intake, was associated with the decreased prevalence of obesity, although this association was of borderline significance (OR 0.65; 95% CI 0.40, 1.04; P trend = 0.078 for the highest vs. lowest tertile of consumption frequency) (Table 3). However, neither fruit nor vegetable intake was significantly associated with the prevalence of overweight. We also found that fruit and vegetable preferences appeared to be modestly predictive of fruit and vegetable consumption (r = 0.37; P < 0.001 for fruit and r = 0.36; P < 0.001 for vegetable).
Risk of overweight and obesity according KDAGCAI-score levels
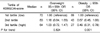
The multivariate ORs (95% CIs) of obesity across increasing tertiles of the mean KDAGCAI-score, adjusted for age, sex, and household income (month), were 1.00 (reference), 0.67 (0.45, 1.00), and 0.49 (0.31, 0.78), respectively (P trend = 0.001) (Table 4). However, we found no significant association for overweight. In analyses stratified by age (4-5 and 6-7 years), sex, and monthly household income (≤ 3,990,000 and ≥ 4,000,000 KRW) (Table 5), we found that age (P interaction = 0.048) and household income (P interaction = 0.014) significantly modified the association between the KDAGCAI-score and the prevalence of obesity, and the associations were more apparent among those who were older, 6-7 years of age (OR 0.44; 95% CI 0.24, 0.79) for above vs. below the median of KDAGCAI-score, 3.89) and lived in lower-income households, ≤ 3,990,000 KRW (OR 0.53; 95% CI 0.34, 0.84 for the corresponding comparison). However, the association of KDAGCAI-score with obesity did not differ by sex (P interaction = 0.418).
Discussion
In this large cross-sectional study of a representative sample of preschoolers aged 4-7 years in the capital city of Korea, we found that the prevalence of overweight or obesity was 17.6% based on the 2007 Korean national growth chart, a result that was similar to the prevalence found using the IOTF reference (17.3%). The findings of this study support the applicability of the KDAGCAI to assess the quality of dietary and activity behaviors associated with the prevalence of obesity among preschool children in Korea. Obese preschoolers were less likely to comply with the KDAGCAI. Preschool children with the highest KDAGCAI-score had 51% lower obesity prevalence with a monotonic linear trend compared to those with the lowest score; the inverse association was more pronounced among children who were older and lived in lower income households. We also observed that children in the highest tertile of vegetable consumption had a 35% lower prevalence of obesity compared to those in the lowest tertile with borderline significance.
Our findings that the association between compliance with the KDAGCAI and the prevalence of obesity was stronger in children from low-income households than those from high-income households may be partially explained by previous evidence [28,29]; obesity is more commonly observed among low socioeconomic status populations, and individuals in economically challenged families are more likely to have poor quality diets consisting of high-energy foods but low quantities of fruits and vegetables, which cost more than unhealthy foods [28,29]. In addition, we observed that older children seemed to have more favorable effects on obesity, which may potentially support the biological plausibility that increased exposure to unhealthy diet and activity behaviors over long periods of time may be potential contributing factors to the rising prevalence of obesity [7-10], presumably resulting from high energy intake and low energy expenditure.
Other Korean studies have also suggested the possibility that the degree of adherence to the Korean national dietary and activity guideline could be used as a quality assessment tool for dietary and activity behaviors among children; one study found that obese middle school children had a lower adherence index score compared to normal weight children [30], and another study found that primary school children with high levels of adherence to the guideline more likely to consume adequate levels of essential nutrients, including calcium, vitamin A, and riboflavin, compared to those with low adherence to the guideline [31]. In Western countries, several indices including the Youth Healthy Eating Index (YHEI) [32], the Children's Dietary Quality Index (C-DQI) [33], the Revised Children's Diet Quality Index (RC-DQI) [34], the Nutritional Quality Index (NQI) [35], and the Dietary Guideline Index for Children and Adolescents (DGI-CA) [36] have been developed to assess the overall dietary quality and dietary behaviors in preschool or older children, as measured by compliance with dietary recommendations, taking into account specific nutrients [35] or food groups [32,36], specific recommendations or a combination of both nutrients and food groups [34]. Favorable health outcomes such as decreased percentage of abdominal fat [37] and obesity [32,38] from a high degree of adherence to these dietary recommendations have been observed. In particular, Kranz et al revised the C-DQI [33] and developed the RC-DQI [34] to better reflect children's current nutritional status and to increase the applicability of measures to preschool children based on the current US dietary intake recommendations. This evaluation tool appeared to appropriately assess the extent to which a range of index scores is linked to their dietary quality, with higher scores indicating healthy diets characterized by high amounts of fiber, fruits, vegetables, and essential fatty acids but low amounts of added sugars and juices. This higher index score was related to the decreased prevalence of obesity among children aged 2-5 years [38].
In Korea, a growing area of interest in obesity is the effect of dramatic dietary changes characterized by increases in processed food, dining out, and energy intake partly because of improved living standards, a rise in women's labor force participation, and the gradual shift from traditional Korean meals to Western-style convenience foods [39]. Most preschool children in the US and UK consume less than the recommended 5 servings of fruits and vegetables daily [40], and similarly, Korean preschool children do not typically consume 5 servings of fruits and vegetables daily [28]. Notably, we found that most children liked animal products and disliked green leafy vegetables (data not shown) among those who reported that they had strong likes or dislikes for particular foods, consistent with other studies that showed that vegetables were the least preferred food [41,42]. Parents and child care providers may play major roles in establishing children's eating habits, food preference patterns and acceptance of new foods because they represent role models [42,43]. According to the 2009 national estimates, the reliance on child care centers and kindergartens has continued to rise among Korean preschool children aged 3-5 years, reaching approximately 42.3% and 38% enrollment rates, respectively [44]; therefore, the role of child care providers in improving children's overall quality of diet and activity has become more crucial [45], as the eating habits established in childhood typically persist into adulthood [7,8].
Data from the 2010 KNHANES [28] showed that 20.4% of children aged 3-6 years had family breakfasts less than four times per week, 1.4% had infrequent family dinners (< 4 per week) and 7.4% skip breakfast. Although these issues are not yet regarded as priority public health concerns for preschool children, we may need to pay close attention because of their potential relationship to adequate essential nutrient intake, overall diet quality, and overweight [19,20,46,47]. Our findings of the relationship between a high BMI and a low adherence to healthy behaviors were in accordance with some observations from previous studies, including "TV viewing/computer game playing" [17,18,47], "structured meal and snacks" [48], "unhealthy food intake (e.g., sugar, salty, and fatty foods)" [12,14,15], and "protein-based foods" [11].
A limitation of this study is its observational, cross-sectional design, and thus, casual inferences cannot be drawn from this data. Additional unmeasured variables related to obesity may confound the relationships we observed; however, adjustment for potential confounding factors did not substantially change the results. Another limitation is the use of parental-reported data for children's weight, height, and fruit and vegetable consumption, rather than measured data and thus our results should be interpreted with caution. Several studies on the validity of parent-reported weights and height has raised to concern to use of parent-reported data because of its less accuracy than direct measurement [49-50]. However, other studies have described that using a parent-reported weight and height may be reasonably valid to estimate the prevalence of obesity in epidemiologic studies [51-53].
The estimated prevalence of overweight or obesity from our data was fairly close to those found in previous reports that used nationally representative samples to estimate the prevalence of overweight or obesity based on measured BMI and the 2007 Korean national growth chart that we used (2005 estimates for children aged 2-6y: 10.0% for overweight and 6.3% for obesity) [2]. Although we did not have detailed information on the serving sizes of fruit and vegetable, a previous study [54] found that the estimated proportion of the variance in most food intake explained by frequency of consumption was greater than the variance explained by portion size, thus supporting the use of frequency of consumption as an acceptable dietary assessment tool.
The present study also has several strengths. To our knowledge, this study is the first to evaluate a wide range of behavioral qualities among Korean preschoolers, as measured by the KDAGCAI-score that contains all recommendations derived from the Korean national dietary and activity guideline, and it is the first to assess the relationships between compliance with the KDAGCA and the prevalence of overweight and obesity. Our study is likely to be largely representative of preschool children living in metropolitan areas in Korea, not only because the study subjects were carefully selected through systematic sampling strategies but also because a high proportion of preschoolers in Korea are placed in day care centers during their preschool period [44]. Previous obesity research concerning preschoolers' dietary or activity behaviors in Korea did not adjust for potential confounders or was based on small sample sizes, making it difficult to draw conclusive inferences; however, we could account for important potential confounders that could influence weight status in this population.
In conclusion, we identified that a high degree of adherence to the Korean national dietary and activity guideline for children was associated with a decreased prevalence of obesity among Korean preschool children. Because obesity may have a multifactorial etiology, the present study, from a behavioral perspective, may help broaden our understanding of the influence of a set of behavioral factors on the obesity epidemic among preschool children. Interventions targeting compliance with the KDAGCAI may be promising for improving obesity-related behaviors, especially for children living in low-income households, with a strong potential to prevent childhood obesity epidemic. However, future research is needed to confirm whether adherence to the 2009 KDAGC could be an effective approach for reducing obesity in other populations.
 XML Download