

 PDF
PDF ePub
ePub Citation
 Print
Print


Introduction
Sodium is an essential nutrient which is important for the physiological functions in the body including fluid balance, nerve impulse transmission, and muscle contraction. However, excess sodium intake has been known as a contributing factor for the development of hypertension, cardiovascular diseases, and stomach cancer [1-3].
It has been reported that Korea is the highest sodium consuming country in the world [4]. According to the National Health and Nutrition survey results in 2010, the average daily sodium intake of Koreans was reported to be 4,877.5 mg [5], which was 346% of the adequate intake level set by Dietary Reference Intake for Koreans [6] and more than twice of the amount recommended by WHO (2000 mg). The high sodium consumption in Koreans contributes to the high prevalence of hypertension. The prevalence in adults aged over 30 years old has reached to 28.9% [5]. Because hypertension is an established risk factor for cardiovascular diseases [7] and intervention to reduce sodium intake can decrease blood pressure [8,9], lowering sodium intake has become the main interest for national public health.
Most dietary sodium is consumed as salt. About 80% of sodium intake came from discretionary salt added during cooking and food processing in Koreans [10]. Usual sodium intake has been suggested to correlate with sensitivity and preference to salty taste [11,12]. Dietary habits consuming excess sodium is formed in the young and sodium consumption increases with age [6]. Considering the difficulty in permanently reducing sodium intake in adults shown by the long term intervention studies [13,14], public strategies to establish the desirable dietary behaviors including low sodium intake in the childhood should be emphasized.
The school meal program is being widely practiced in Korea and plays a major role in the diet of school-aged children and adolescents, providing more than one third of their daily nutrition needs. In addition, school meal has been paid attention to as an important nutrition education tool for children and family. Korea Food and Drug Administration (KFDA) has performed the survey on the elementary school, middle school, and nursery meals since 2008 and has been building up data-base on sugar and sodium contents for scientific management of the food service quality [15-17]. Although the data on accurate sodium content of the school meals is important, the reference values applicable in field are in need for self-monitoring of dishes by practical method. In addition, specific approaches should be considered in nutrition education based on dietary behavior and perception related to sodium intake of the children and adolescents.
This study was carried out to estimate the salt content of dishes for monitoring school meals and to provide basic information for nutrition education on lowering sodium intake appropriate for the age. Three main research questions were addressed: What was the average salt content of the dishes provided in the school meal and what are the major dish sources of salt in school meals? What were the main differences in knowledge and dietary attitude related to sodium intake among elementary, middle, and high school students? And were there any difference in taste perception on school meals between students and staffs?
Subjects and Methods
Study subjects
Students and staffs working for school meal service were recruited from 24 schools (9 elementary, 7 middle, 8 high schools) in Gyeonggi-do, Korea. Students recruited in the study were 4th graders in the elementary schools and 2nd year students in both middle and high schools. A total of 798 students (255 elementary school students, 248 middle school students, and 295 high school students) and 256 staffs were included in the study after subjects with uncompleted questionnaire were excluded.
Questionnaire
A self-administered questionnaire was developed and consisted of the following sections: general information, perception on the saltiness of the school meal, nutrition knowledge and dietary attitude related to salt intake, and consumption frequency of commonly consumed salty Korean dishes. Subjects were asked to respond 'yes' or 'no' to the questions on nutrition knowledge and dietary attitude. The response alternatives for consumption frequency were everyday, 3-5 times per week, 1-2 times per week, once a month, and never, which were coded as 7, 4, 1.5, 0.25, 0, respectively. The frequency was rated using once a week for 1.
Dish collection and analysis of salt content in school meals
We collected 382 dishes from the schools where the survey was performed during June and July of 2010. Students (one boy and one girl) in each school brought foods in the same way as he (she) eats usually in the school, which means the portion size would not be changed. Meals were collected for 3 consecutive days from each school. Collected dishes were weighed, diluted with 10 times water and pulverized completely with blender. Salt contents were calculated from salinity (measured with ESL-421, ATAGO, Japan) and weight of individual food. The contribution rate of the dishes to total salt content of the meal was also calculated. Most of the school meals consisted of cooked rice, soup, main dish, 1 or 2 side dishes, and kimchi. Dessert was included sometimes. The dishes were classified into a hierarchical system consisted of 6 dish types and 18 groups, which broadly reflected KNHANES dish categorization [18].
Statistical analysis
Data were analyzed using the SAS (version 9.2, SAS Institute, Inc, Cary, NC) package program. Age, weight, height, BMI, salinity and salt content of the dishes, and dish consumption frequency were reported as means ± standard deviations. Means were compared by Student's t test or one-way analysis of variance (ANOVA) followed by Duncan's multiple range test for individual group comparisons. Dietary attitude and nutrition knowledge were reported as frequencies of correct answers and response of 'yes', respectively. The differences among groups were analyzed by Chi-square test. The P value of < 0.05 was considered as statistically significant.
Results
Subject characteristics
Among the 798 students participated in this study, the proportion of elementary, middle, and high school students were 32%, 31%, 37%, respectively. The students were 418 males and 380 females, while the majority of staffs (99.6%) were females and the mean age of the staffs was 44.8 years old. Average body mass indices (BMI) of the subjects were in the normal range.
Salt content and contribution of dishes from school meals
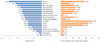
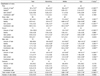
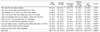
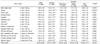
Table 1 shows salinity and salt content of dish types in school lunch menu. The average salt content of served meals was 4.03 g (elementary school, 2.44 g; middle school, 3.96 g; high school, 5.87 g, respectively). Greatest contributors to the salt content across all grade levels were soup and stew (38.6%) and main dishes with meats, eggs, and beans were the next major sources. The salinities of dish types were not significantly different among elementary, middle, and high school, except for main dish. The main dish had the highest salinity in the high school meal and the lowest in the elementary school meal. The saltiness and relative contributions of the dish groups to salt content of school meals is shown in Fig 1. Sauces, kimchies, and stir-fried foods were the most salty dishes with high salinity. However, noodles, stews, sauces, and soups were the major sources of salt considering the amount of food consumed.
Perceptions on the saltiness of school meal
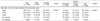
Compared with the staffs working for school cafeteria, the students perceived the school meal more salty than home-made meal (P < 0.001, Table 2). The proportion of students who answered that school meals were saltier was the lowest in the elementary school and the highest in the high school (P < 0.001).
Nutrition knowledge and dietary attitude related to salt intake
The scores of nutrition knowledge related to salt intake was shown in Table 3. The correct answer rate was less than 50% on questions regarding recommended daily salt intake, cooking tips to lower salt use, and physiological function of sodium. On the other hand, subjects were well aware of hidden sources of sodium and the relationship of sodium intake and diseases. Among the students, nutrition knowledge score increased as grade levels went up (P < 0.001). The correct answer rate were significantly different on questions regarding major sources of salt intake, nutrition labeling on sodium, cooking tips to lower salt use, and the relationship of sodium intake and diseases. The staffs had more experience of nutrition education significantly for lowering salt intake than the students (P < 0.001). Among the students, the high school students had fewer chance of education compared with the elementary and middle school students (P < 0.05).
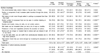
Subjects' dietary attitude related to salt intake is shown in Table 4. Among the students, middle and high school students showed higher total scores compared with elementary students, which indicated the preference for salty taste in middle and high school students than the elementary school students (P < 0.001). Middle and high school students had significant propensity for the preference of one-dish meal, frequent intake of processed foods, eating much broth of stews and noodles, eating much dipping sauce or seasoning, and a fixed idea of dishes being pretty seasoned, compared with the elementary students (P < 0.001). This tendency was supported partly by the dish frequency questionnaire (DFQ) (Table 5). The consumption frequency of Ramen was higher in the middle and high school students than the elementary students (P < 0.001). The consumption frequencies of seaweed soup and seasoned spinach were lower in the middle and high school students.
Discussion
Considering the importance of school meal in childhood and adolescent nutrition, monitoring and control of sodium content in school meal can be an effective strategy to reduce sodium intake. The average salt content of school meal was 4.03 g, which was about 1,612 mg of sodium. This amount is approximately 80% of the recommended daily sodium intake by WHO. When compared with Korean children's average daily sodium intake (3,300.8 mg in age 6~11, 4,503.2 mg in age 12~18) [5], the salt content of school lunch was relatively high for a single meal, which provided 29.6, 32.5, 52.1% of daily sodium intake of elementary, middle, and high school students, respectively. This result indicated that contribution of school meals to daily sodium intake became greater as grade levels went up. The higher salinity of main dish, a major contributing menu to total salt content of school meal, was evident in the middle and high schools, in addition to the more salt content of each menu due to a larger serving size of the meal. This was supported by perceptions of school meal saltiness among students. More students responded that school meal was saltier than home-made meal in the order of high, middle, and elementary schools. It has been reported that school meal program participation was associated with increased prevalence of excessive sodium intakes [19]. On average, school meal participants consumed roughly 200 mg more sodium at lunch than matched non-participants did, which was statistically significant and observed for all elementary, middle, and high schools. Thus, the excessive sodium content in the school meals and the students' perception of school meal saltiness indicated the urgent need for lowering salt content in the school meals.
The salinity of menu type and individual dish and contribution from them to salt content suggest the direction of improving school meal. The contribution of each menu to salt content was in the following order: soup and stew > main dish > kimchi > side dish > cooked rice, dessert. It is interesting that soup and stew was the primary salt source in school meals, reaching to 45.03% in elementary school lunch. This is contrary to the report that kimchi was a chief sodium source in all age groups from KHANES [18]. The researches on school lunch and foodservice cafeteria supported our results that kimchi would not be the primary contributor of sodium intake [17,20]. The sodium content of kimchi in school lunch was analyzed to be about half of that used in KNHANES [17,21]. In addition, 24h recall method in KNHANES depends on the subject's memory and ability to estimate portion size. It is likely that subjects tend to underestimate the amount of seasonings and sauces. Interestingly, sauces were the dish with the highest salinity and provided large contribution to total salt in school meals. It is necessary to reduce the amount of sauce and to develop recipe of low sodium sauce for lowering salt content in school meals.
Noodles, soups, and stews were the major sources of salt due to the large serving size. Considering the report that these foods with broth provided above 30% of total sodium intake [18], the consumption of less broth and reduction of serving size of soups and stews should be a primary strategy. In addition, the salinity of soups and stews (0.85~0.89%) in our study indicated the need for lowering the amount of salt added in soups and stews. Previous studies reported that the preference for salty taste was lower in children compared with adults [22] and that children and college women preferred 0.5~0.6% of salt in meat broth [23,24]. However, most staffs seasoned school meal dishes to their taste with less than 50% using salimeter in our study (data not shown). It is likely that the staffs working for food service field use higher amounts of salt compared with homemade dishes to make food more tasty. Monitoring of saltiness with objective and scientific tools in the school food service field should be established. Considering that salt content measured in this study was within the range of sodium content measured by atomic absorption spectrometry [17], monitoring foods with salimeter would be a practical tool in school meals.
It is interesting that more students perceived school meals salty than staffs did, although the dietary attitude and DFQ score indicated that students might have preference for the salty taste compared with the staffs. More experience of education on low-sodium diet in staffs could have influenced the answering to questionnaire on preference and frequency of salty foods. Sodium intake reached to 2000 mg/day in children at 3~5 years and increased with age in Korea [5]. Our results suggested that frequent eating out and convenience-oriented eating habit could be a reason for higher sodium consumption of the older students compared with the younger students.
Nutrition education that leads to improved knowledge and dietary behavior is a powerful strategy to lower salt intake in the young. However, the approaches should be differentiated for different groups. Considering the low correct answer rates, it was evident that recommended intake of sodium, physiological function of sodium, and cooking tips to for lowering salt use should be focused in the education for overall age groups. Detailed dietary information regarding low sodium food selection and preparation can also derive desirable dietary behavior in the middle and high school students.
This study has some limitations. We measured the salt content provided in the school meal, not the real sodium intake of students. It is likely that students might not eat all the foods or sauces that were taken by themselves and salt intake from a school lunch may be overestimated in this study. However, the amount of leftover was little, so the amounts of foods taken seem to be close to the average intake. The other limitation is the fact that we depended upon a self-administered questionnaire to obtain the results on the dietary attitude and consumption frequency for salty dishes. In addition, this study did not collect the data from nationally representative sample. Nation-wide future study would be helpful to address specific strategy with consideration of difference in menu plans and recipes according to the regions. Nonetheless, this study provides the basis for nutritional education to meet a demand and the direction of improvements in school meals to reduce salt content.
These results suggest that the salt content of school meals should be controlled by monitoring and the contents and methods of education system in school should be considered to lower sodium intakes.
 XML Download