

 PDF
PDF ePub
ePub Citation
 Print
Print


Introduction
Evaluating the relationship between diet and chronic disease is very important in epidemiological studies. But, it is challenging to precisely measure and quantify the actual dietary intake of Koreans. Typical Korean meals are very different from Western meals. They consist of steam-cooked short-grain rice, soup, and multiple side dishes (banchan). Kimchi is served often, sometimes at every meal. Commonly used ingredients include sesame oil, doenjang (fermented bean paste), soy sauce, salt, garlic, ginger, pepper flakes, and gochujang (fermented red chili paste). Many foods are cooked using oils [1]. A meal is often served family style, and side dishes are shared with multiple individuals. Thus, Koreans may have difficulties determining their consumption frequency and portion size for a specific food item [2].
Several methods are available for measurements such as diet records (DRs), the 24-hr recall method, and the food frequency questionnaire (FFQ). The FFQ is widely used for epidemiological purposes because it is inexpensive and collects dietary information. Selected food items are listed in the FFQ, and the intake frequencies and usual portion sizes are noted. But, data need to be validated for each new questionnaire and for each new population group assessed [3]. Willett et al. [4] reported that multiple days of DRs over four seasons may be superior to a FFQ and has been frequently used as a reference method in many validation studies. But, 3-day DRs have been commonly used in practical settings in Korea for validation studies [5-9] and are an acceptable validation tool [2]. Few Korean studies had been validated when we developed our FFQ validation [10-12]. Our FFQ was developed to investigate the relationship between diet and risk of chronic diseases such as diabetes, cardiovascular disease and cancer in asymptomatic Korean adults. We also wanted to assess the nutritional status and to counsel for correcting bad eating habits of healthy individuals who underwent a screening examination at our health promotion center. The purpose of this study is to evaluate the validity of the FFQ which was developed to assess the nutritional intake.
Subjects and Methods
Subjects
The subjects were recruited from participants at the health promotion center of Samsung Seoul Hospital (Seoul, Korea). We asked 898 participants to compile DRs from May 2010 to December 2010. The participants received written instructions on how to record all foods and beverages consumed on 3-day DRs. In total, 310 patients consented to and completed the 3-day DRs and the FFQ. Five patients, whose mean 3-day energy intake was lower than 1,000 kcal, were excluded. Thus, 305 subjects were enrolled, including 190 males and 115 females.
The food frequency questionnaire
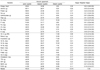
The food items listed in the quantitative FFQ were based on the food records from the Korea Health and Nutrition Examination Survey in 1998 and the modified Block's Health Habit and History Questionnaire [13]. From 1996 to 1998, we used the FFQ, which included 330 food items at our health promotion center [14]. From 1998 to 2000, we used a FFQ with 161 high-frequency food items for adults aged 40 or older at our health promotion center. We excluded 23 low-frequency food items. Our foods list included 138 items (Table 1). The food items included rice (6), breads and cereals (5), potatoes (4), noodles (9), soups and stews (5), kimchi (6), meat and eggs (14), fish and shellfish (16), soybean products (3), vegetables (22), mushrooms and seaweed (3), fruit (18), milk, and dairy products (7), beverages (3), sweets and snacks (7), oils and nuts (5), and alcoholic beverages (5). Questionnaire items were arrayed in the order of breakfast, lunch, dinner, and snacks. Our FFQ consisted of 109-food based questions and 29-dish based questions. The frequency of servings was classified into nine categories. The FFQ included never, less than once per month, 2-3 times per month, 1-2 times per week, 3-4 times per week, 5-6 times per week, once per day, twice per day and three times per day. The portion size was referenced from sixth recommended dietary allowances for Koreans [15], household measures of commonly used food items [16], and a food exchange table for Korean diabetes [17]. The portion size of each food item was classified as follows: cereal and cereal products for the three meals were classified into seven steps (range, 0.3-2 times), whereas others were classified into six steps (range, 0.5-4 times). The participants recorded the FFQ during a personal interview. The FFQ was automatically calculated using a computer program (Samsung Medical Information Systems). The database was based on the food composition table of the Korean Nutrition Society program Can-pro 3.0 (Nutritional Assessment Program 2008 Korean Nutrition Society, Seoul, Korea).
Three-day diet records
Participants were asked to keep non-consecutive 3-day DRs (two weekdays and one weekend day or a holiday). Before the health examination, the participants received written instructions on how to record all foods and beverages consumed in 3-day DRs. The food record format allowed entry of foods and fluids. All food items, preparation methods, recipes, quantity, and portion sizes were recorded, as well as industrialized products. Intake was calculated with Can-pro 3.0.
Interview
On the day of the health examination, participants recorded on the FFQ as trained dietitians individually interviewed participants about their exact portion size using measuring cups and three-dimensional food models. The participants confirmed the portion size of the 3-day DRs using the three-dimensional food models. Dietitians checked the written diet record in a standardized way. It took 15 minute. Dietitians had a minimum 2 years experience with nutritional interviews.
Statistical analysis
We calculated that the relevant sample size was over 246 using nQuery Advisor 4.0 ® (Statistical Solutions, Cork, Ireland). The mean nutrient intakes from the DRs were compared with the FFQ using Wilcoxon's signed-rank test. Data were analyzed after log-transformation to improve the normality of the nutrient intake distribution. Adjusted Pearson's correlations were used to identify the relationship between the FFQ and DR nutrient intakes. To correct for within person daily variability in the DR measurements, the observed correlation was multiplied by a de-attenuation factor (1 + γ/n)½, where γ is the ratio of the within and between person variances [18]. The weighted kappa (κ) statistic was estimated. Throughout this study, we considered a correlation efficient greater than 0.4 as meaningfully acceptable. The statistical analysis was performed using SAS software (SAS Institute, Cary, NC, USA). A P-value of less than 0.05 was considered significant.
Results
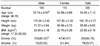
Table 2 shows the general characteristics of the study subjects. The mean age was 54.05 ± 7.13 years, and the body mass index was 23.82 ± 0.16. Drinkers comprised 65.79% of the total subjects, and smokers comprised 25.57% of all participants.
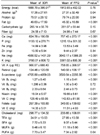
Table 3 shows the average nutrient intakes by the FFQ and 3-day DRs. The mean nutrients on the FFQ (energy, protein, carbohydrate, fiber, zinc, vitamin B2) were not different from those of the 3-day DRs. Nutrient (fat, iron, sodium, vitamin A, β-carotene, vitamin B1, vitamin E, cholesterol, polyunsaturated fatty acid) intakes on the 3-day DRs were higher than those of the FFQ.
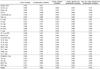
Table 4 shows the results of crude, energy-adjusted, de-attenuated, and all-adjusted Pearson's correlation coefficients for the FFQ and 3-day DRs. The crude Pearson's correlation coefficients for nutrients ranged from 0.279 (polyunsaturated fatty acid) to 0.760 (carbohydrate) with a median of 0.501. The de-attenuated correlation coefficients ranged from 0.401 (vitamin A) to 0.877 (energy), with a median value of 0.668. Energy adjusted and de-attenuated correlation coefficients ranged from 0.323 (polyunsaturated fatty acid) to 0.835 (alcohol) with a median value of 0.571. Age, gender, energy-adjusted, and de-attenuated correlation coefficients ranged from 0.317 (polyunsaturated fatty acid) to 0.748 (carbohydrate) with a median value of 0.550. All adjusted Pearson's correlation coefficients except those for iron, zinc, vitamin A, and polyunsaturated fatty acid were greater than 0.4, indicating a good correlation.
Table 5 shows the result of quartiles for two nutrients to examine whether their levels were in agreement, and the results were analyzed by kappa statistics. The average proportions of classification into the same quartiles, adjacent quartiles, and distant quartiles between the 3-day DRs and the FFQ were 49.35%, 28.57%, and 9.09%, respectively. More than 75% of the subjects were classified into the same or adjacent quartiles. Simple kappa values ranged from 0.06 (vitamin A) to 0.43 (carbohydrate). The weighted kappa values ranged from 0.18 (vitamin A) to 0.57 (carbohydrate). Good agreements (weighted kappa value ≥ 0.4) were noted for energy, alcohol, carbohydrate, protein, fiber, phosphorus, iron, sodium, potassium, and vitamin C.
Discussion
Our FFQ was developed to assess personal nutritional status and food intake habits in participants at a health promotional center. Previous Korean studies have used 3-day DRs rather than the 24-hour recall method [5-7,9]. In this study, we evaluated the relative validity of this FFQ using 3-day DRs. Our study recruited 305 participants, which satisfied the relevant sample size. Our study had a larger sample size than that of previous studies [6,19,20]. Statistical methods such as energy-adjusted and de-attenuated correlation coefficients [6,19], and kappa values [5,7] were also used in previous studies. Correlations are the most applied statistical procedures, and they should be adjusted for different variables, particularly energy, age, and gender. De-attenuating the correlation is critical to reduce its dependency on between-person variation [21]. From our data, de-attenuation to correct for intra-individual variability improved the median value (0.501-0.668). According to Willett [22], adjusting for energy increases the correlation coefficients when the variability in nutrient consumption is related to energy intake. However, correlation coefficients decrease when the variability in nutrient consumption depends on systematic errors of overestimation and underestimation. In our data, energy adjusting to correct for intra-individual variability did not improve the median value (0.501-0.408). Energy adjustment and de-attenuating the correlation are critical statistical methods used in dietary intake validation studies [21]. From our data, energy adjusting and de-attenuation to correct for intra-individual variability improved the median value (0.501-0.571).
The Japanese diet is similar to that of Koreans, and a review of Japanese studies showed that the median value of correlation coefficients between DRs and FFQs ranged from 0.31 to 0.56. Relatively poor validity was found in FFQ estimates for consumption of sodium, niacin, and polyunsaturated fatty acid [23]. From a Chinese report, correlation coefficients ranged from 0.38 to 0.64 for macronutrients, 0.33 to 0.58 for micronutrients, and 0.35 to 0.72 for food groups [24]. In Western studies, correlations ranged from 0.40 to 0.60 (median, 0.53) [25], from 0.25 (fiber) to 0.90 (alcohol) [26], and from 0.55 to 0.85 [27].
Several Korean validation studies have been conducted [5-9,11,12,19,28-31]. Kim et al. [31] reported on the validation of a FFQ for Korean-Americans. After the correlations were energy-adjusted and de-attenuated, they ranged from 0.45 (carbohydrate) to 0.84 (potassium) [31]. Ahn et al. [19] reported that FFQ correlation coefficients ranged from 0.23 (vitamin A) to 0.64 (carbohydrate) with a median for nutrients of 0.39 after adjusting for energy and de-attenuation. Sodium was not mentioned.
In this study, the median exact agreement was 49.35% and the average exact agreement was 49.81% and more than 75% of the subjects were classified into the same or adjacent quartiles. Other studies in Korea that compared 3-day DRs or 24-hr recall and FFQs presented median or average agreements that were lower than those in our study [6,19,32].
Previous Korean studies had several features. Participants had difficulties remembering events over the course of a full year [2,20] and might have trouble remembering consumption frequency or the amount of food consumed in a year [20]. Additionally, participants might overestimate food intake, in part, because the answers were taken as multiple choices of frequencies at discrete intervals [6]. Intakes of energy and carbohydrate in FFQ are significantly higher than those in DRs [5,8,9,19]. Ahn et al. [19] and Bae et al. [6] reported that carbohydrate consumption may be overestimated in FFQ because rice is the staple food of Korean; grains and noodles are also included as food items. Furthermore, Koreans may have low perception of portion size and have difficulties answering about the consumption frequency of a specific item, particularly in unprepared dishes [19]. Participants confound real portion size and color photographs of median-sized food portions.
In our study, we checked the FFQ within 3 months or a season so that participants could easily remember events. Comparing the two methods, energy and carbohydrate intake were not different in our study (Table 3). It is possible that a questionnaire of food items about grain and noodles was easy to answer as they were arrayed in the order of meals. Portion size was subdivided the six or seven sections, and trained dietitians checked the actual portion size using three-dimensional food models in a personal interview.
Intakes of nutrients from seasonings and cooking oils have been underestimated in a food-based FFQ [33]. A dish based FFQ could have advantages over a food-based FFQ, which has been developed and validated in Korea [34]. A dish based FFQ includes ingredients such as seasonings, spices, and cooking oils. Seasonings are a major contributor to sodium intake, as cooking oils are to polyunsaturated fatty acid intake [35]. This type of analysis would allow for a more accurate estimate of antioxidant vitamins, phytochemicals, and fatty acids [34]. Excluding seasonings and oils to assess nutrient intake underestimates total energy, vegetable fat, vitamin E, and sodium intake. We must be cautious about the interpreting studies that do not include seasonings and oils [33]. Our FFQ reflected seasonings and cooking oils by conducting a more dish-based questionnaire. For example, food-based questions were calculated to include only bean sprouts, whereas the dish-based questionnaire was calculated to include bean sprouts with seasonings and oils.
Checking the calories of alcoholic beverages may influence energy intake. Some individuals drink no alcohol, whereas others consume large amounts [23]. Thus, we added alcoholic beverages to the FFQ. Validation studies for alcoholic beverages are rare in Korea [12], but in the foreign countries, checking alcoholic beverages is common [23,27,36,37]. Other Korean studies did not mention alcoholic beverages [5,6,9,11,19,28,29]. According to our study, the rate of alcoholic beverages intake was 80.53% in men and 40.87% in women. Thus, including alcoholic beverage on the FFQ was helpful for checking calories.
Our FFQ had some limitations. First, all subjects were recruited from a health promotion center for a medical check-up. Less than 80% of the subjects resided within a big city; thus, subjects were more concerned about their health and nutritional status. Second, seasonal variability was not reflected in this study. Third, biomarkers were not introduced to validate food intake measurements. Fourth, the reproducibility of the FFQ was not checked.
In conclusion, our FFQ had special characteristics. All adjusted Pearson's correlation coefficients between the FFQ and the 3-day DRs ranged from 0.317 to 0.748 (median for all nutrients, 0.550). All nutrients were mentioned and alcohol and fatty acid were added. Energy and carbohydrate of the FFQ were not different from those of the 3-day DRs. Previously known poorly validated nutrients such as fat, sodium, cholesterol, niacin, and saturated fatty acid are more meaningful when compared to those of other Korean studies. This FFQ may be a useful tool for assessing nutritional status, investigating the relationship diet and risk of chronic disease and correcting for the bad eating habits in healthy Korean adults.
 XML Download